Chapter 11 Image Enhancement and Feature Extraction Spectral


")
 provided by JAXA")

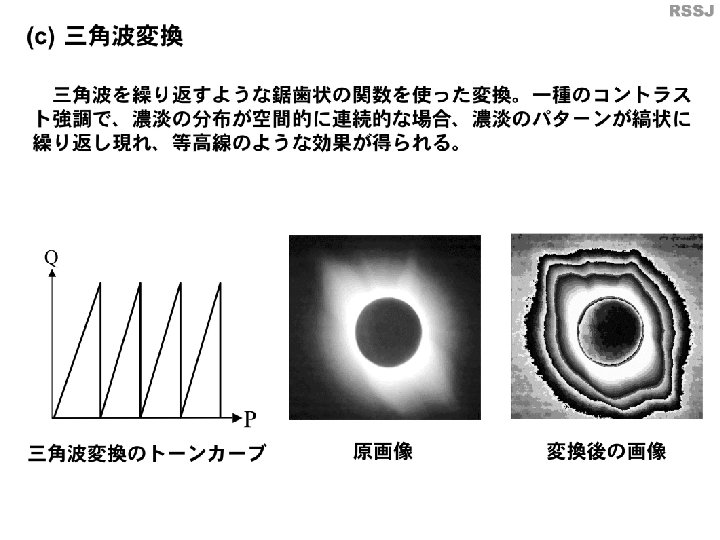
 Tone curve of the triangle wave conversion (2) Input image")
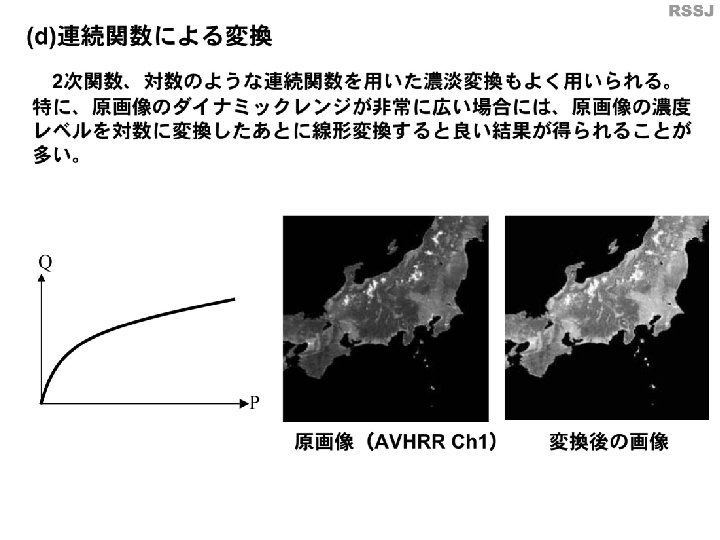
 (1) Tone curve of the continuous")
Input image(B: B 1, G: B 2, R: B")

Dark image (4) Histogram of the image (1) (2)")

Input image (b) Pseudo color image")


")


")
 and first derivative spectra (lower) - example for a luxuriant rice")
 between grain protein content and")
- Slides: 43
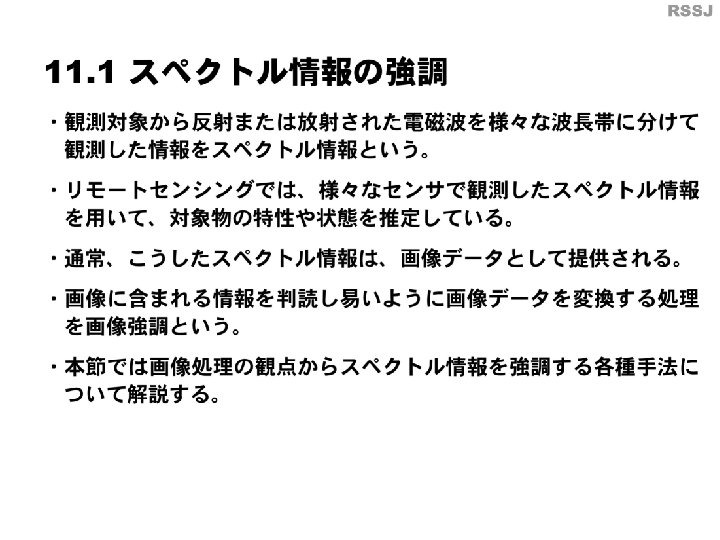
Chapter 11 Image Enhancement and Feature Extraction: Spectral Information
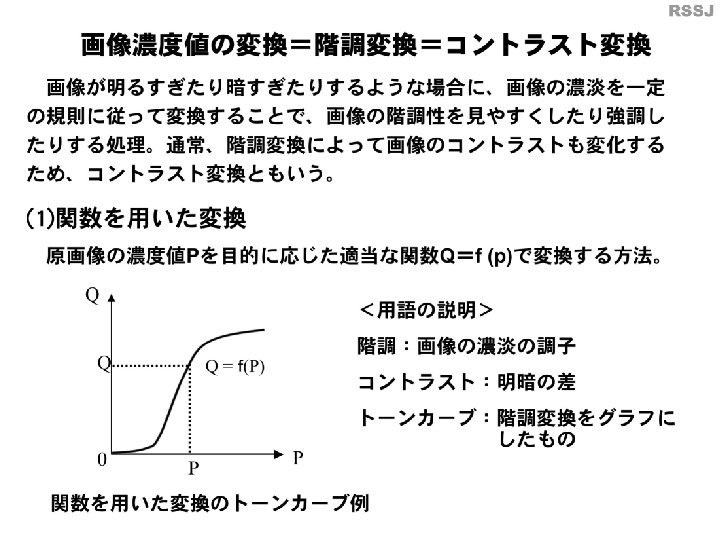
Example of a tone curve for a functional conversion
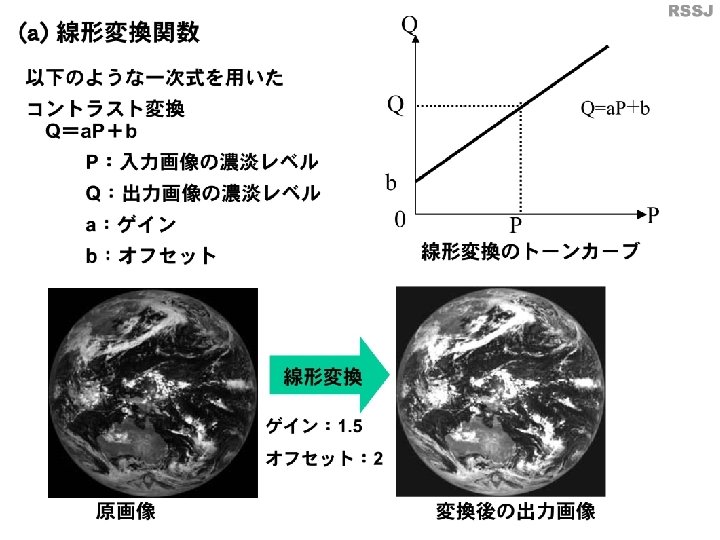
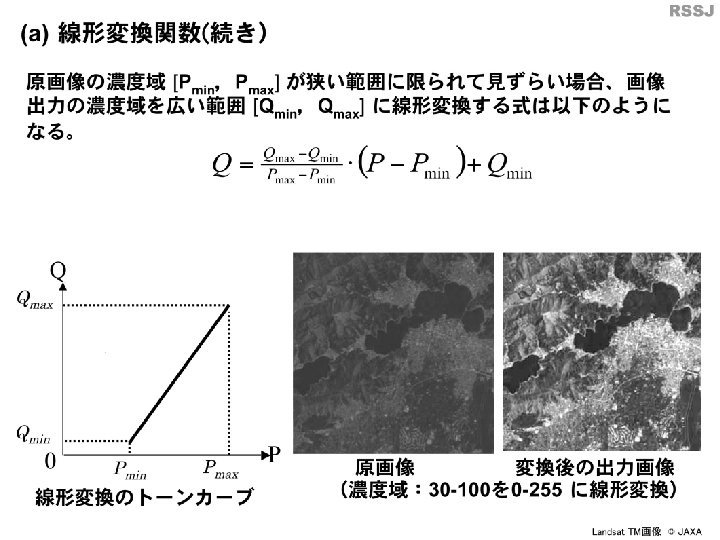
An example of linear conversion (image: MTSAT-1 R)
An example of linear conversion (Image: Landsat/TM) provided by JAXA
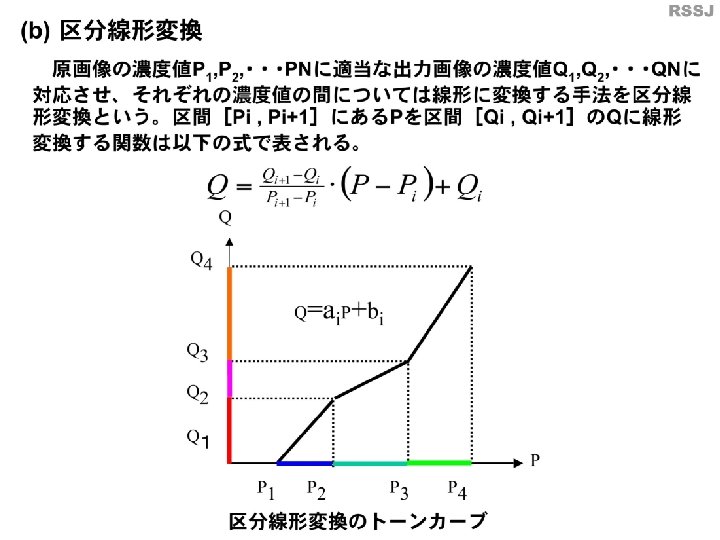
Tone curve of Piece-wise linear conversion
Triangle wave conversion (1) Tone curve of the triangle wave conversion (2) Input image (3) Output image
Continuous function conversion (in case of logarithmic function) (1) Tone curve of the continuous function (2) Input image (3) Output image
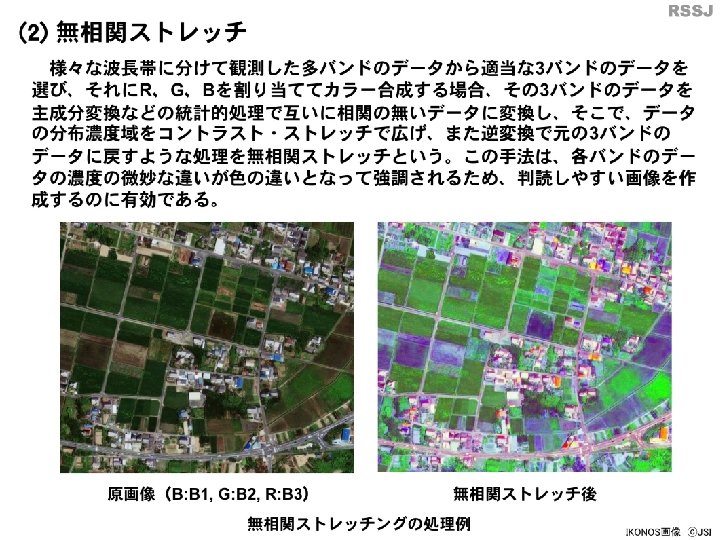
An example of decorrelation stretch (1)Input image(B: B 1, G: B 2, R: B 3) (2)Output image after decorrelation stretch (image: IKONOS) provided by JSI
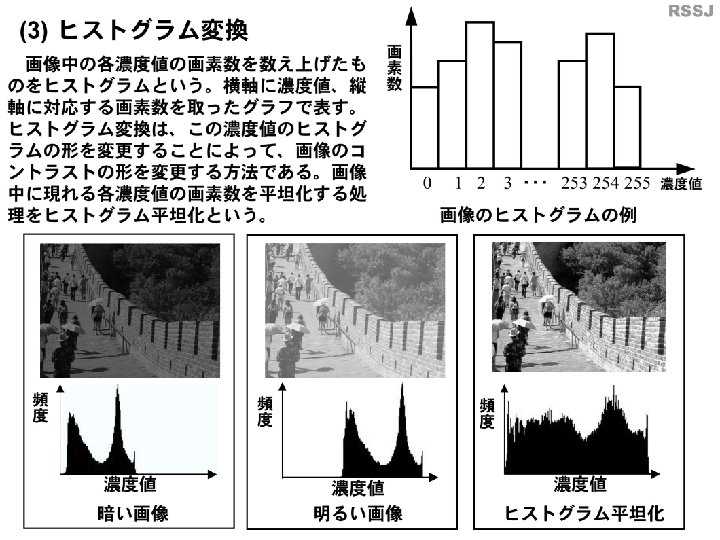
Histogram of gray level
An example of histogram equalization (1)Dark image (4) Histogram of the image (1) (2) Bright image (5) Histogram of the image (2) (3) Histogram equalization (6) Histogram of the image (3)
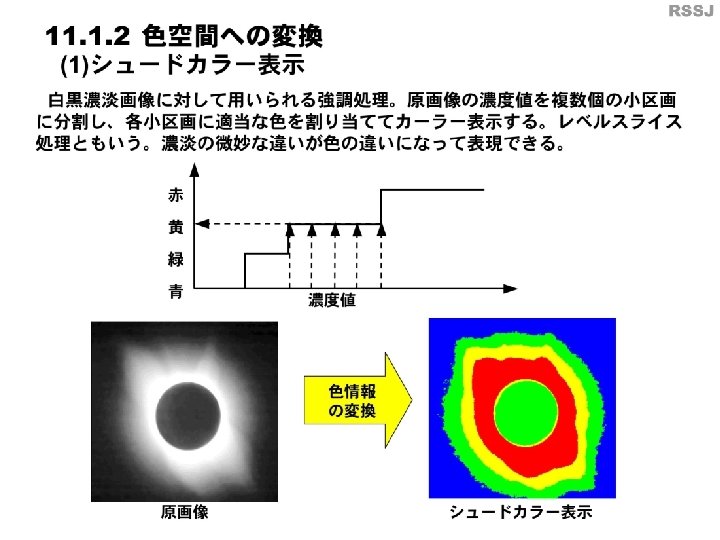
Concept of pseudo color
An example of pseudo color (a)Input image (b) Pseudo color image
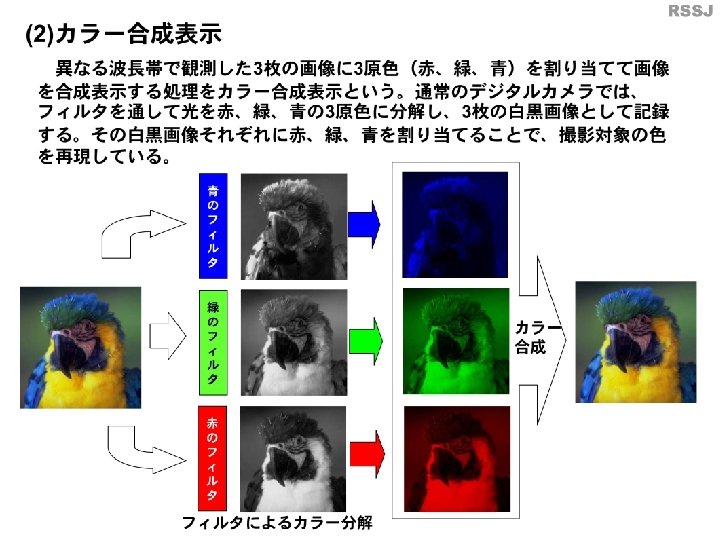
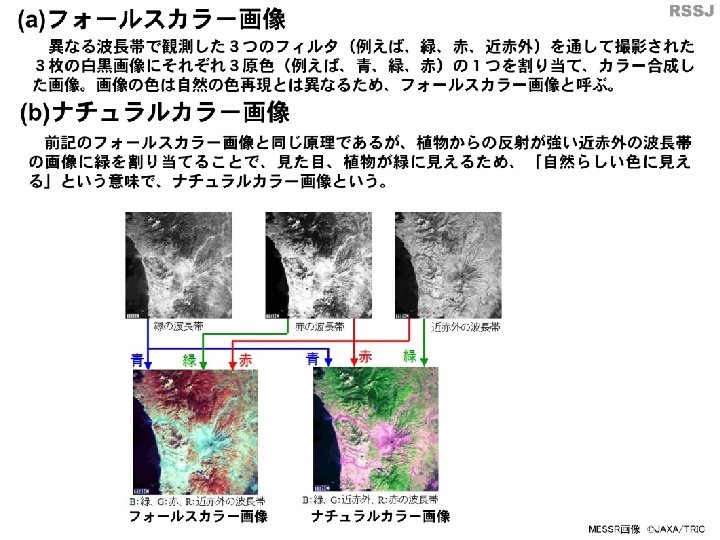
Concept of color composite
Difference between false color and natural color False color image Natural color image (image: MESSR, JAXA/TRIC)
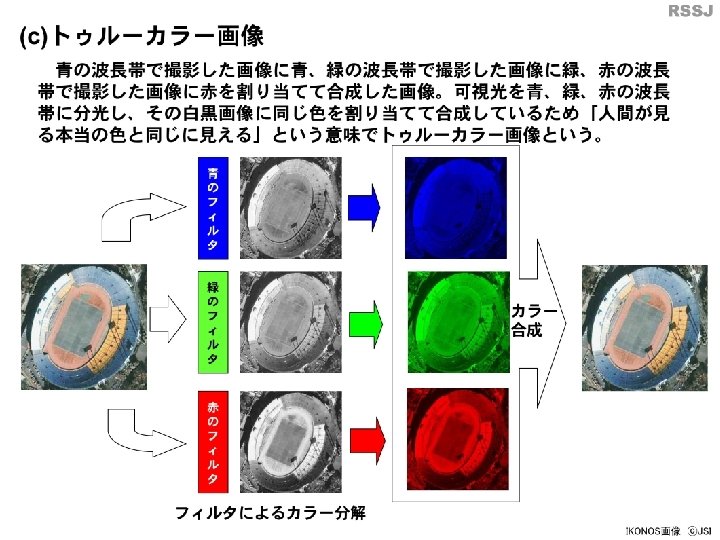
True color image composite (image: IKONOS, JSI)
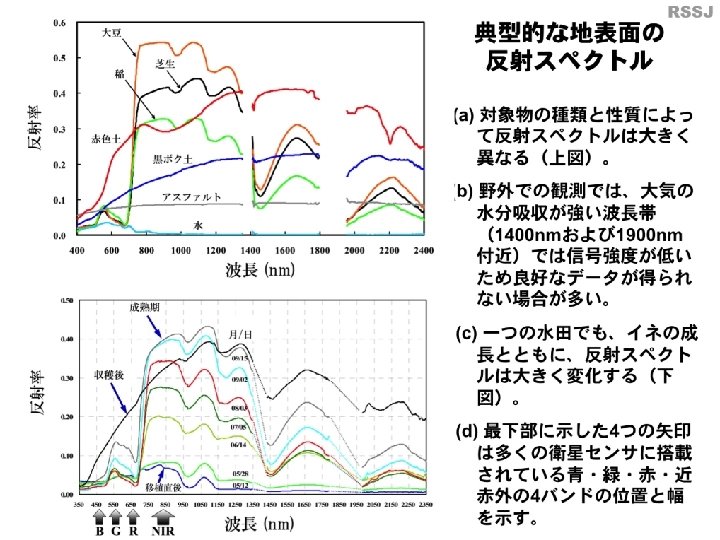
Typical reflectance spectra major land surface objects seasonal change of reflectance spectra in a rice canopy Note) Wavelength regions around 1430 nm and 1950 nm are missing due to strong absorption by water vapor in the atmosphere.
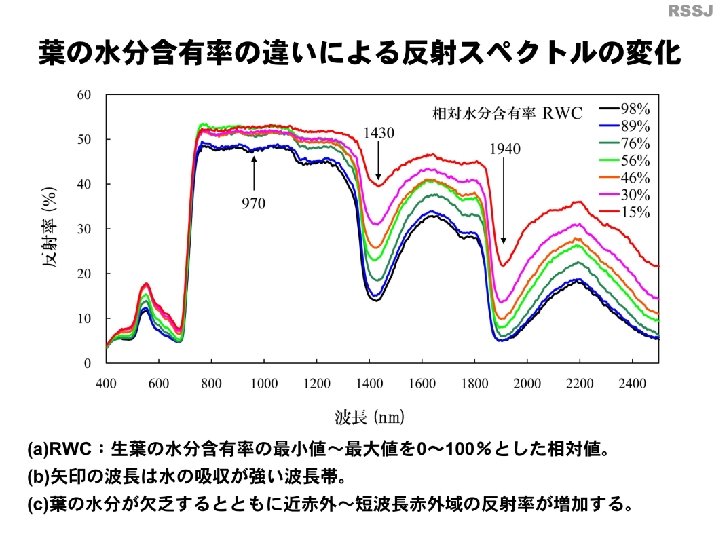
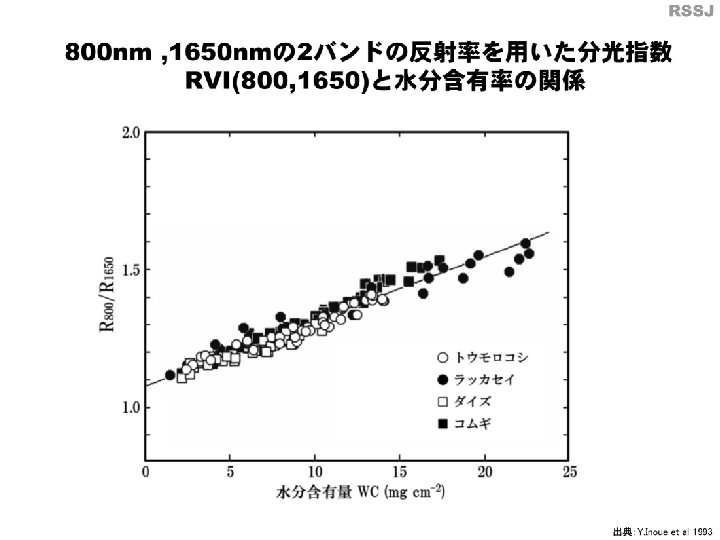
Reflectance spectra A wheat leaf with different relative water content The relationship between leaf water content and a ratio spectral index R 800/R 1650 using reflectance at 800 nm and 1650 nm wavelengths
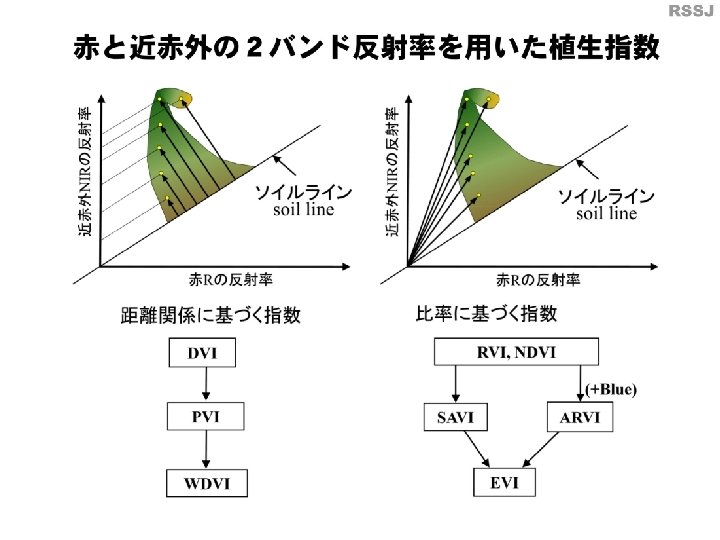
Conceptual implications and categories of spectral vegetation indices using reflectance data in red (R) and near-infrared (NIR) wavebands
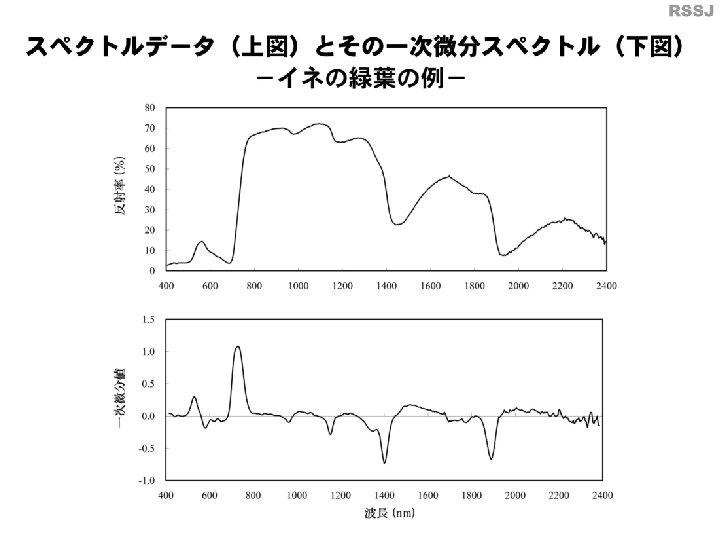
Reflectance spectra (upper) and first derivative spectra (lower) - example for a luxuriant rice canopy -
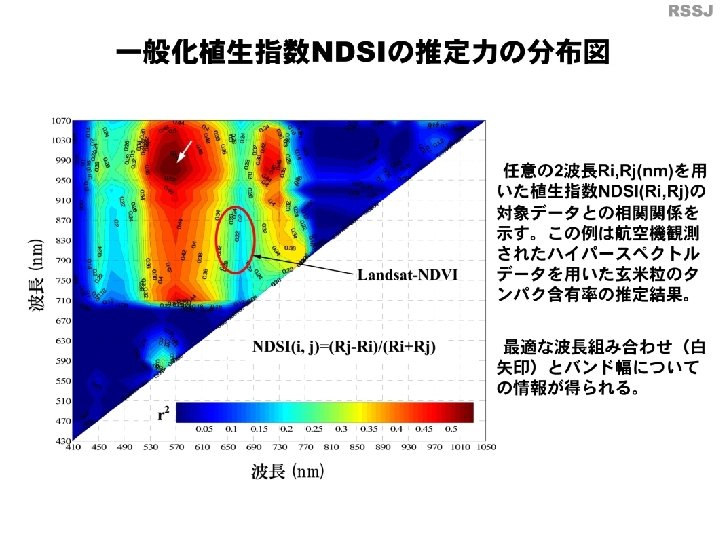
A contour map of coefficient of determination (r 2) between grain protein content and the normalized difference spectral indices (NDSIs) using the combinations of two wavelengths on x and y axes Notes) The white arrow indicates the optimal NDSI (550, 970). The red ovalcorresponds to the location of NDVI using R (660± 30 nm) and NIR (830± 70 nm) of Landsat TM.