
Chapter 10 The Family and Household Transition Chapter
- Slides: 31
Chapter 10 The Family and Household Transition
Chapter Outline • Defining Family Demography And Life Chances • The Family And Household Transition • Proximate Determinants Of Family And Household Changes
Chapter Outline • Changing Life Chances • The Intersection Of Changing Life Chances And The Family And Household Transition
Families • In virtually every human society, people have organized their lives around a family unit. • A family is any group of people who are related to one another by marriage, birth, or adoption. • Family members share a sense of social bonding: the mutual acceptance of reciprocal rights and obligations, and of responsibility for each other’s well-being.
Households • People who share a housing unit are said to have formed a household. • A family household is a housing or residential unit occupied by people who are related to one another. • A nonfamily household is a housing unit that includes a person who lives alone, or consists of people living with nonfamily coresidents.
Family Demography • Concerned largely with the study and analysis of family households: n Their formation n Their change over time n Their dissolution
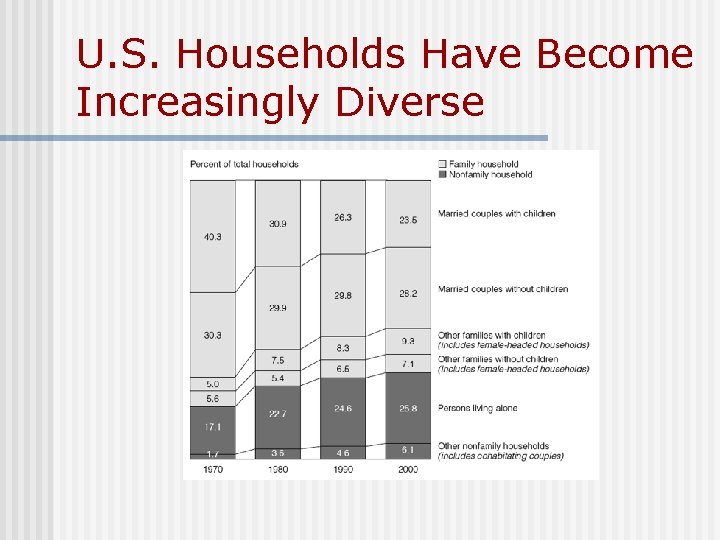
Household Composition and Family Structure • Total number of households in the United States increased from 63 million in 1970 to 106 million in 2000. • Within that increase was a change in the composition of the American household. • Married couples with children have become less common.
U. S. Households Have Become Increasingly Diverse
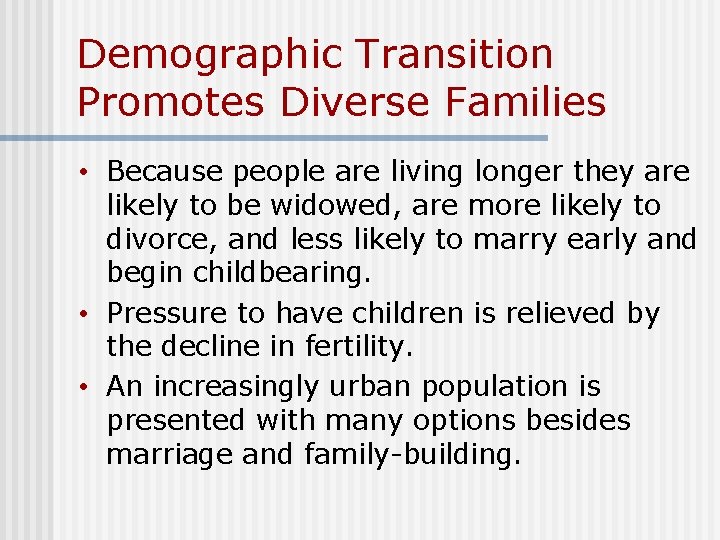
Demographic Transition Promotes Diverse Families • Because people are living longer they are likely to be widowed, are more likely to divorce, and less likely to marry early and begin childbearing. • Pressure to have children is relieved by the decline in fertility. • An increasingly urban population is presented with many options besides marriage and family-building.
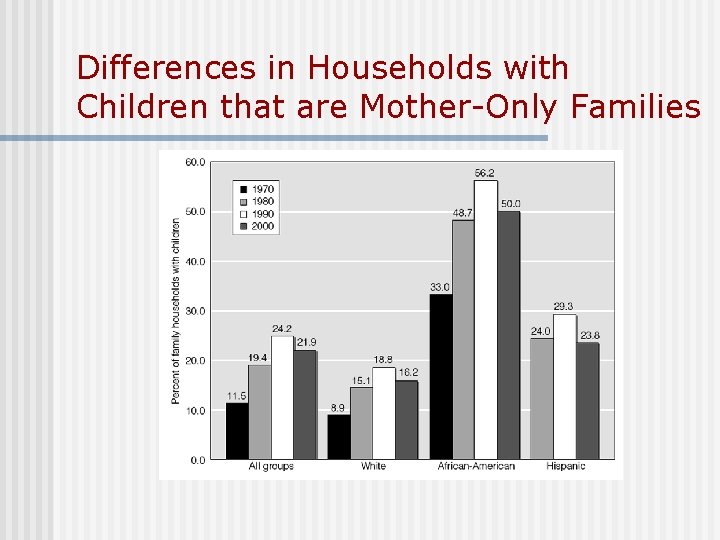
Differences in Households with Children that are Mother-Only Families
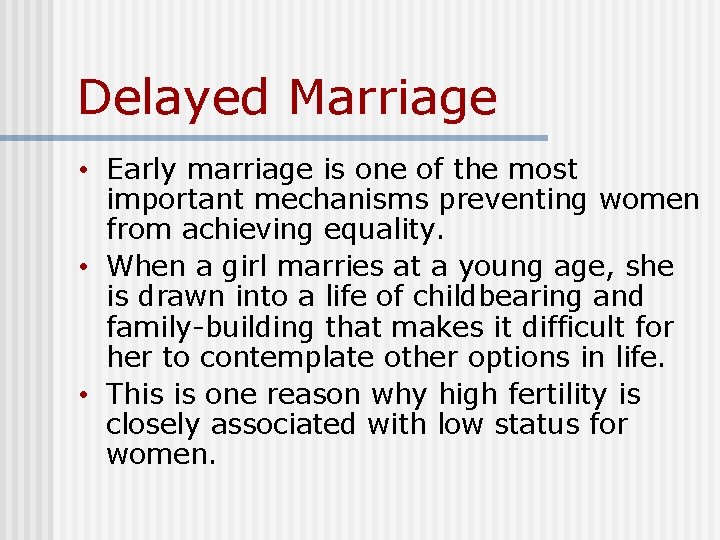
Delayed Marriage • Early marriage is one of the most important mechanisms preventing women from achieving equality. • When a girl marries at a young age, she is drawn into a life of childbearing and family-building that makes it difficult for her to contemplate other options in life. • This is one reason why high fertility is closely associated with low status for women.
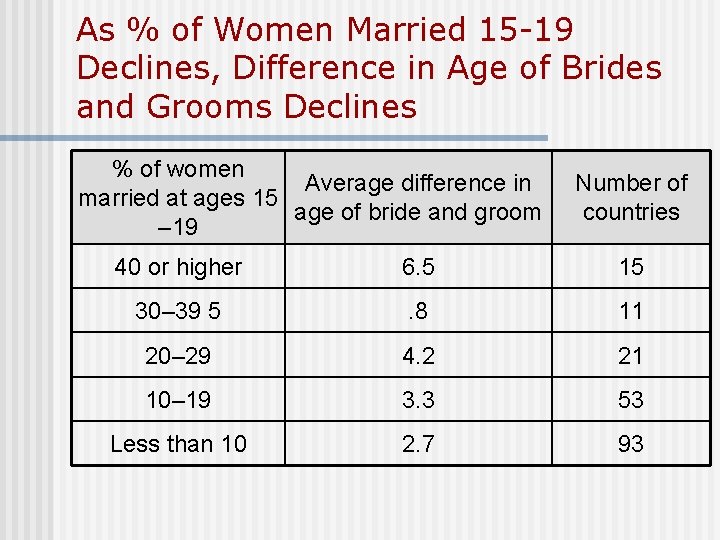
As % of Women Married 15 -19 Declines, Difference in Age of Brides and Grooms Declines % of women Average difference in married at ages 15 age of bride and groom – 19 Number of countries 40 or higher 6. 5 15 30– 39 5 . 8 11 20– 29 4. 2 21 10– 19 3. 3 53 Less than 10 2. 7 93
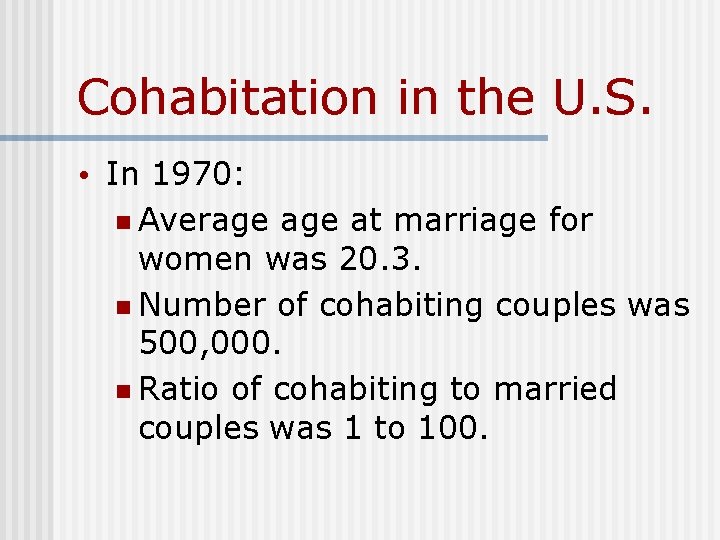
Cohabitation in the U. S. • In 1970: n Average at marriage for women was 20. 3. n Number of cohabiting couples was 500, 000. n Ratio of cohabiting to married couples was 1 to 100.
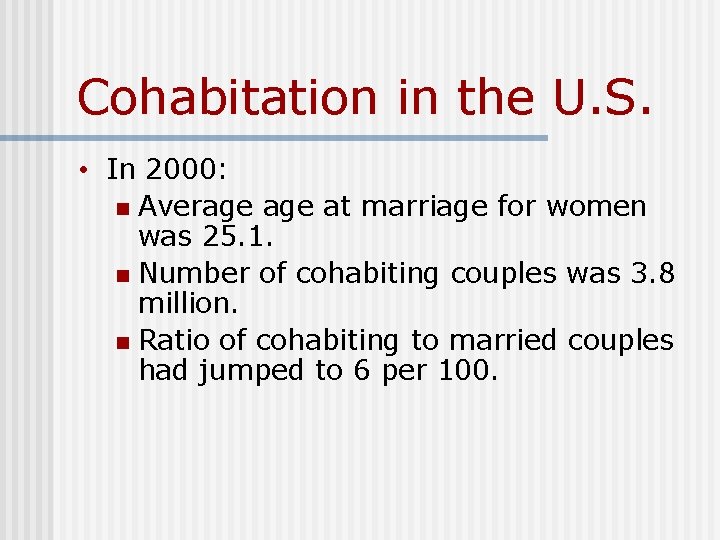
Cohabitation in the U. S. • In 2000: n Average at marriage for women was 25. 1. n Number of cohabiting couples was 3. 8 million. n Ratio of cohabiting to married couples had jumped to 6 per 100.
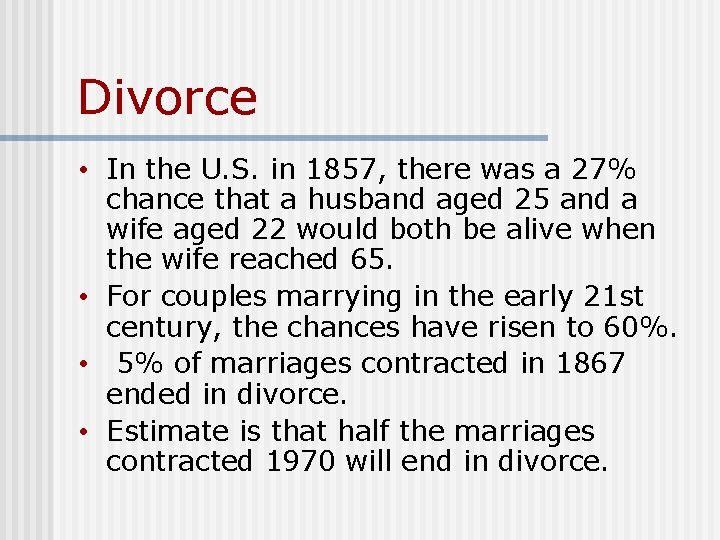
Divorce • In the U. S. in 1857, there was a 27% chance that a husband aged 25 and a wife aged 22 would both be alive when the wife reached 65. • For couples marrying in the early 21 st century, the chances have risen to 60%. • 5% of marriages contracted in 1867 ended in divorce. • Estimate is that half the marriages contracted 1970 will end in divorce.
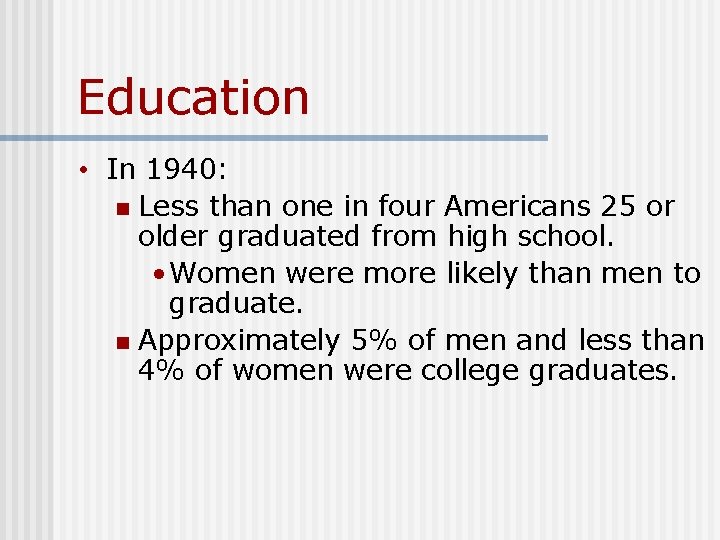
Education • In 1940: n Less than one in four Americans 25 or older graduated from high school. • Women were more likely than men to graduate. n Approximately 5% of men and less than 4% of women were college graduates.
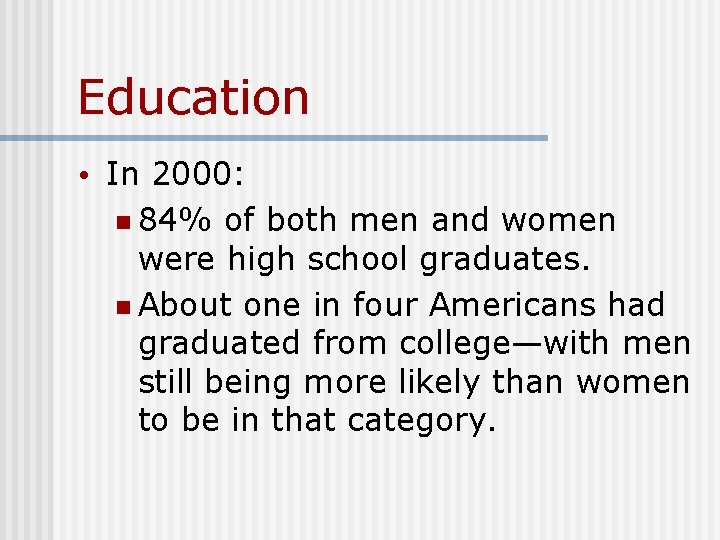
Education • In 2000: n 84% of both men and women were high school graduates. n About one in four Americans had graduated from college—with men still being more likely than women to be in that category.
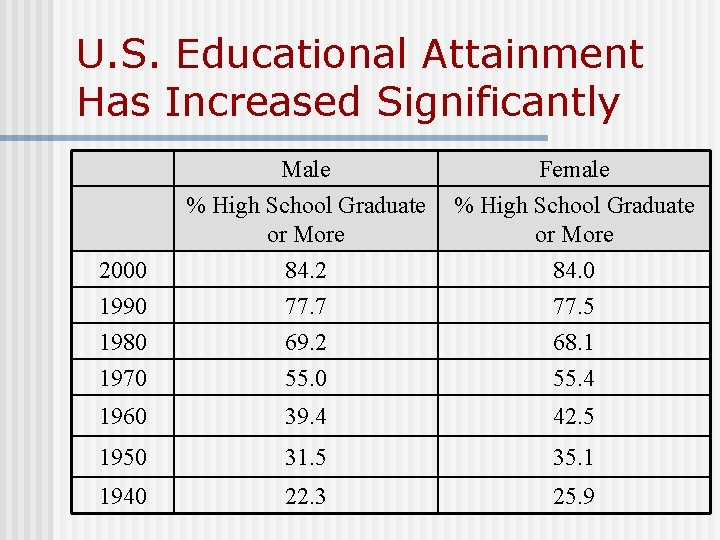
U. S. Educational Attainment Has Increased Significantly Male % High School Graduate or More Female % High School Graduate or More 2000 84. 2 84. 0 1990 1980 1970 77. 7 69. 2 55. 0 77. 5 68. 1 55. 4 1960 39. 4 42. 5 1950 31. 5 35. 1 1940 22. 3 25. 9
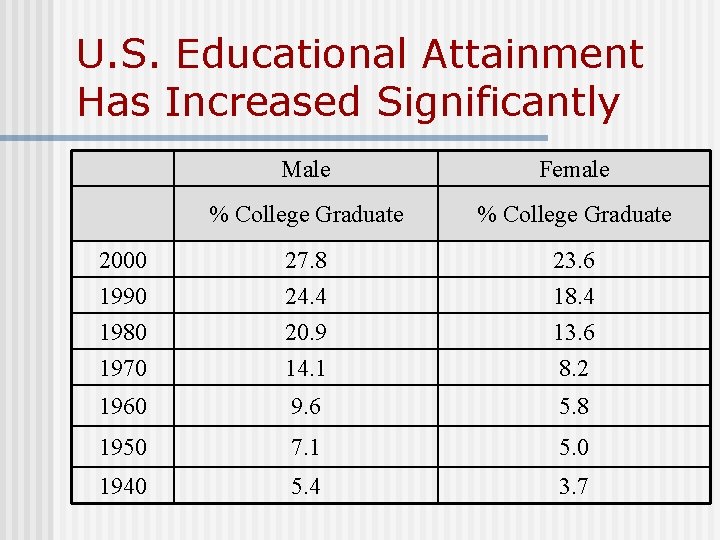
U. S. Educational Attainment Has Increased Significantly Male Female % College Graduate 2000 27. 8 23. 6 1990 1980 1970 24. 4 20. 9 14. 1 18. 4 13. 6 8. 2 1960 9. 6 5. 8 1950 7. 1 5. 0 1940 5. 4 3. 7
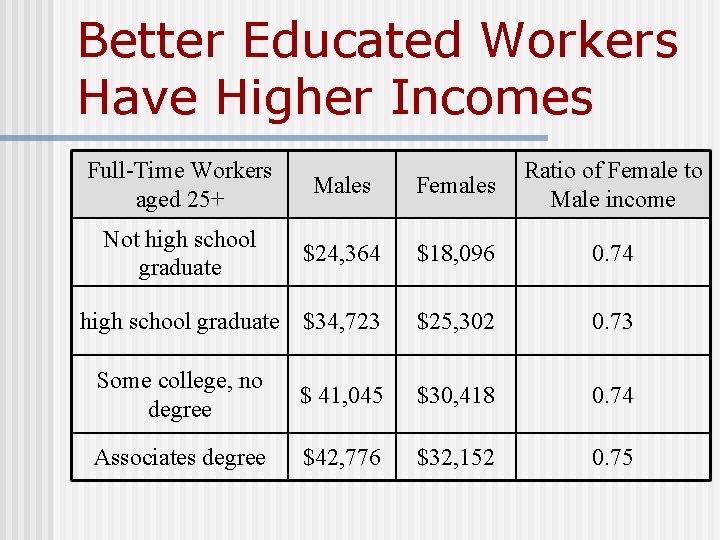
Better Educated Workers Have Higher Incomes Full-Time Workers aged 25+ Males Females Ratio of Female to Male income Not high school graduate $24, 364 $18, 096 0. 74 high school graduate $34, 723 $25, 302 0. 73 Some college, no degree $ 41, 045 $30, 418 0. 74 Associates degree $42, 776 $32, 152 0. 75
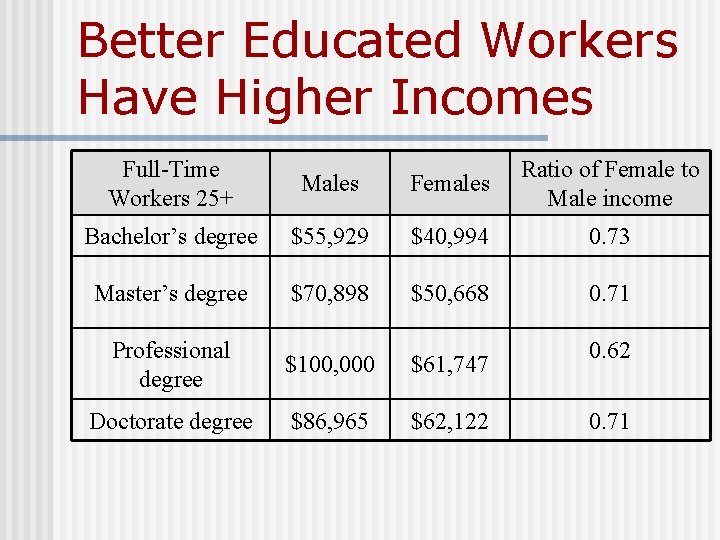
Better Educated Workers Have Higher Incomes Full-Time Workers 25+ Males Females Ratio of Female to Male income Bachelor’s degree $55, 929 $40, 994 0. 73 Master’s degree $70, 898 $50, 668 0. 71 Professional degree $100, 000 $61, 747 Doctorate degree $86, 965 $62, 122 0. 62 0. 71
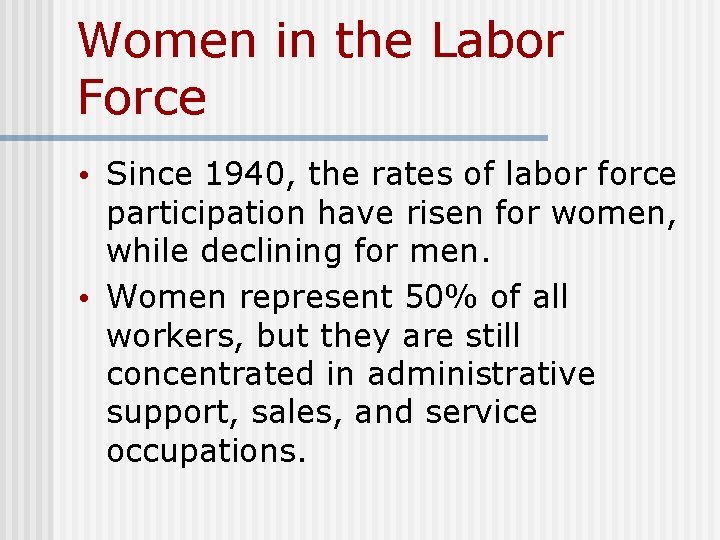
Women in the Labor Force • Since 1940, the rates of labor force participation have risen for women, while declining for men. • Women represent 50% of all workers, but they are still concentrated in administrative support, sales, and service occupations.
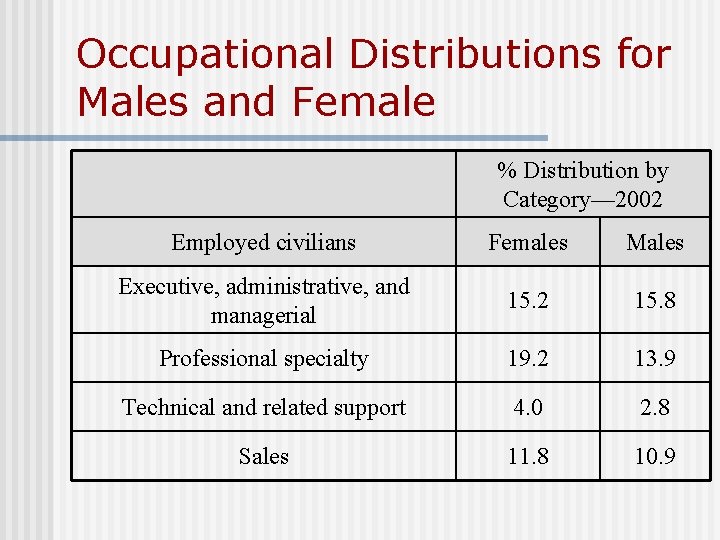
Occupational Distributions for Males and Female % Distribution by Category— 2002 Employed civilians Females Males Executive, administrative, and managerial 15. 2 15. 8 Professional specialty 19. 2 13. 9 Technical and related support 4. 0 2. 8 Sales 11. 8 10. 9
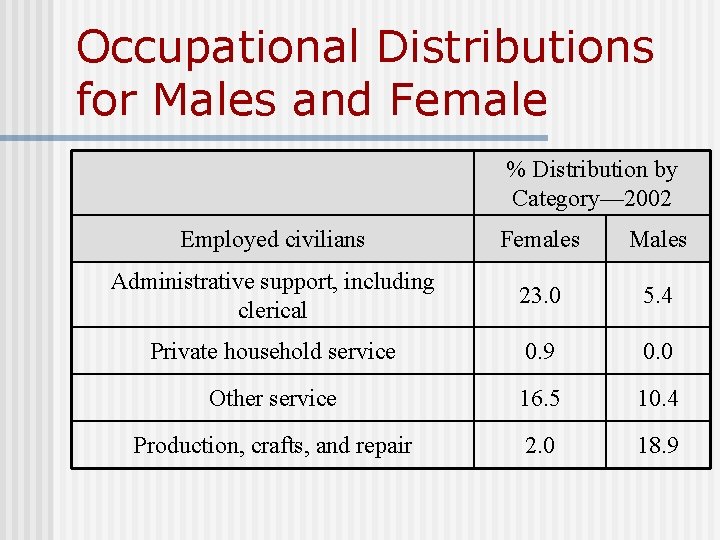
Occupational Distributions for Males and Female % Distribution by Category— 2002 Employed civilians Females Males Administrative support, including clerical 23. 0 5. 4 Private household service 0. 9 0. 0 Other service 16. 5 10. 4 Production, crafts, and repair 2. 0 18. 9
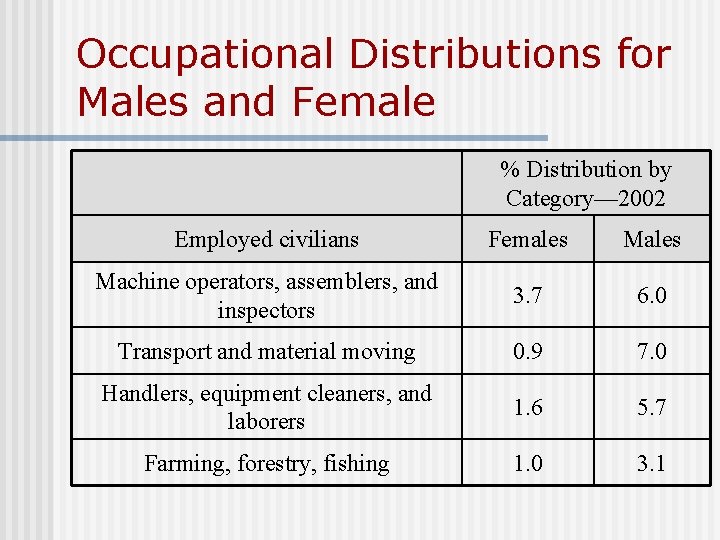
Occupational Distributions for Males and Female % Distribution by Category— 2002 Employed civilians Females Machine operators, assemblers, and inspectors 3. 7 6. 0 Transport and material moving 0. 9 7. 0 Handlers, equipment cleaners, and laborers 1. 6 5. 7 Farming, forestry, fishing 1. 0 3. 1
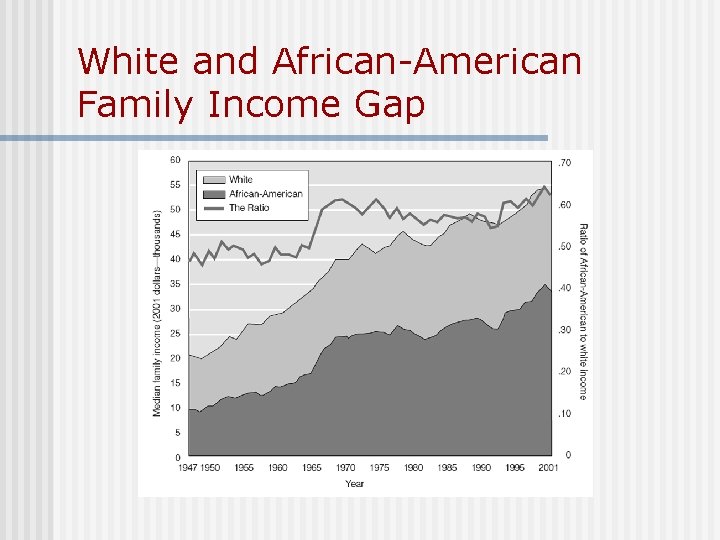
White and African-American Family Income Gap
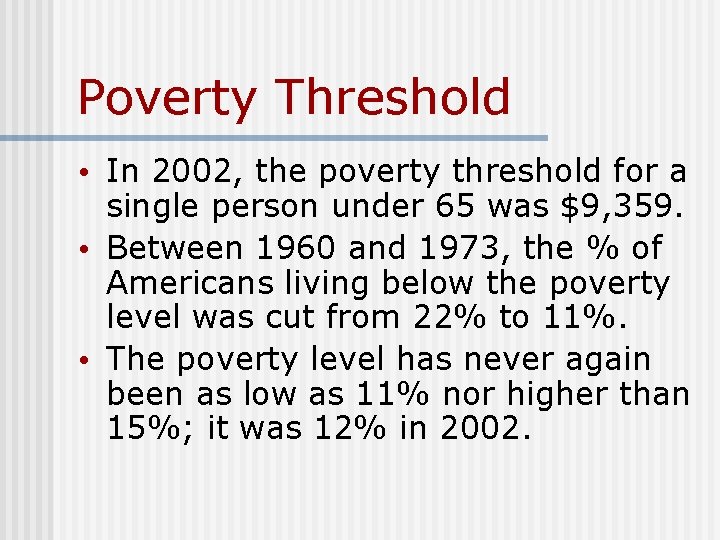
Poverty Threshold • In 2002, the poverty threshold for a single person under 65 was $9, 359. • Between 1960 and 1973, the % of Americans living below the poverty level was cut from 22% to 11%. • The poverty level has never again been as low as 11% nor higher than 15%; it was 12% in 2002.
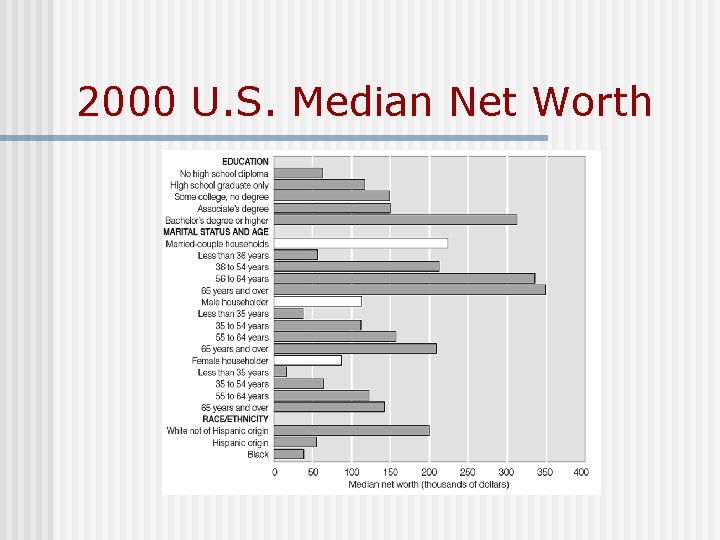
2000 U. S. Median Net Worth
Benefits of Marriage 1. Married couples have higher household income, 2. Married couples save more of their income. 3. Married couples have more wealth. 4. Married men and women live longer, and engage in fewer highrisk behaviors.
Benefits of Marriage 5. Children are better off financially than those in a one-parent family. 6. Children are less likely to drop out of school, less likely to have a teenage pregnancy, and less likely to be “idle” as a young adult than children in a oneparent family. 7. Married couples have sex more often and derive greater satisfaction from it than the unmarried do.