
Chapter 10 Reexpressing Data to Straighten Linear Regressions

- Slides: 7
Chapter 10 Re-expressing Data (to Straighten Linear Regressions) AP Statistics
I wanna use r… but assoc is not linear! • Straighten to SIMPLIFY the model and SIMPLIFY explanation of it. – Occam’s Razor: Simpler explanations are likely better explanations • Linear association allows us more precision! –r – R 2 – Linear equation • Yes, there is a Curve of Best Fit, but stat. s is limited for this, so we won’t use it!
Common Problems and Solutions • Lack of symmetry due to skew log • Spread of compared groups not the same log • Association not linear log • Spread in scatterplot fanned log What’s a common solution?
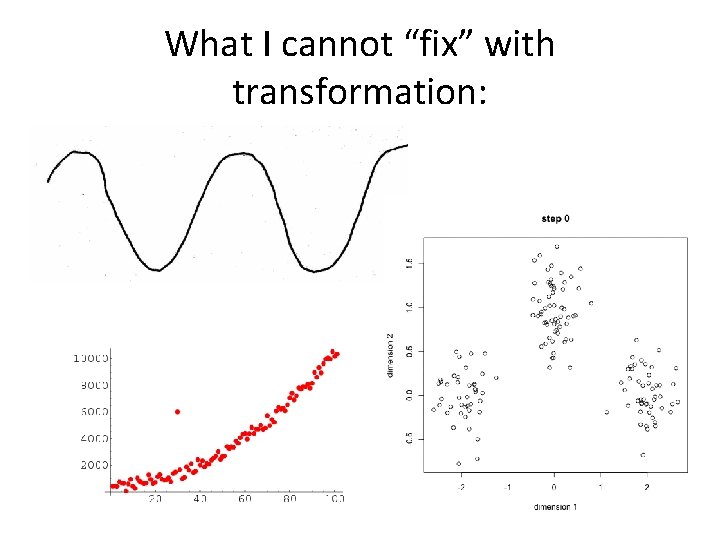
What I cannot “fix” with transformation:
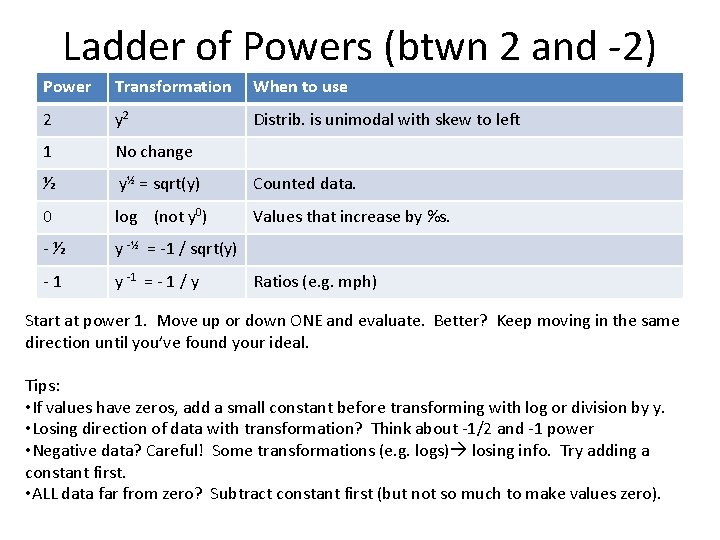
Ladder of Powers (btwn 2 and -2) Power Transformation When to use 2 y 2 Distrib. is unimodal with skew to left 1 No change ½ y½ = sqrt(y) Counted data. 0 log (not y 0) Values that increase by %s. -½ y -½ = -1 / sqrt(y) -1 y -1 = - 1 / y Ratios (e. g. mph) Start at power 1. Move up or down ONE and evaluate. Better? Keep moving in the same direction until you’ve found your ideal. Tips: • If values have zeros, add a small constant before transforming with log or division by y. • Losing direction of data with transformation? Think about -1/2 and -1 power • Negative data? Careful! Some transformations (e. g. logs) losing info. Try adding a constant first. • ALL data far from zero? Subtract constant first (but not so much to make values zero).
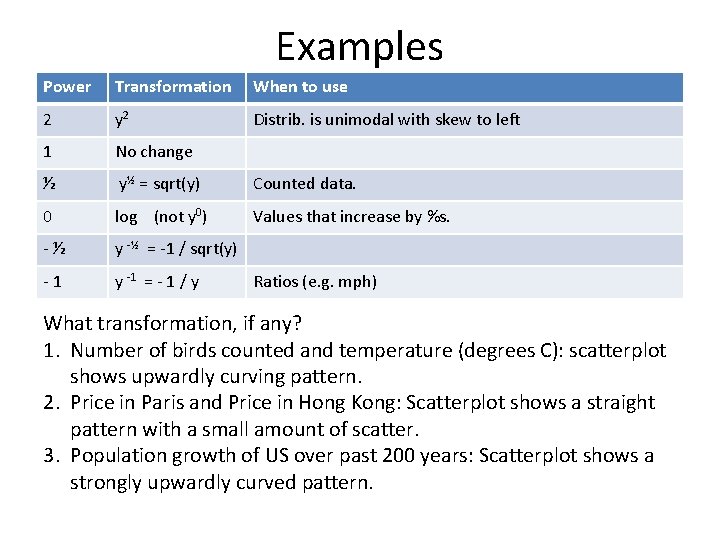
Examples Power Transformation When to use 2 y 2 Distrib. is unimodal with skew to left 1 No change ½ y½ = sqrt(y) Counted data. 0 log (not y 0) Values that increase by %s. -½ y -½ = -1 / sqrt(y) -1 y -1 = - 1 / y Ratios (e. g. mph) What transformation, if any? 1. Number of birds counted and temperature (degrees C): scatterplot shows upwardly curving pattern. 2. Price in Paris and Price in Hong Kong: Scatterplot shows a straight pattern with a small amount of scatter. 3. Population growth of US over past 200 years: Scatterplot shows a strongly upwardly curved pattern.
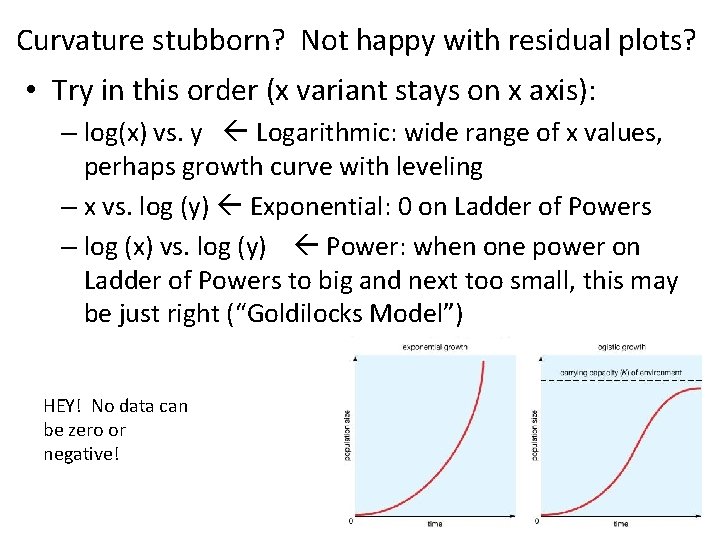
Curvature stubborn? Not happy with residual plots? • Try in this order (x variant stays on x axis): – log(x) vs. y Logarithmic: wide range of x values, perhaps growth curve with leveling – x vs. log (y) Exponential: 0 on Ladder of Powers – log (x) vs. log (y) Power: when one power on Ladder of Powers to big and next too small, this may be just right (“Goldilocks Model”) HEY! No data can be zero or negative!