Chapter 10 outline Photometric calibration High dynamic range

Chapter 10

outline � Photometric calibration � High dynamic range imaging � Super-resolution and blur removal � Image matting and compositing � Texture analysis and synthesis

10. 1 Photometric Calibration � 10. 1. 1 Radiometric response function � 10. 1. 2 Noise level estimation � 10. 1. 3 Vignetting � 10. 1. 4 Optical blur (spatial response) estimation
")
10. 1. 1 Radiometric Response Function(1/7)
 � As we can see in Figure 10.")
10. 1. 1 Radiometric Response Function(2/7) � As we can see in Figure 10. 2, a number of factors affect how the intensity of light arriving at the lens ends up being mapped into stored digital values. � The first factors to affect this mapping are the aperture and shutter speed (Section 2. 3), which can be modeled as global multipliers on the incoming light, most conveniently measured in exposure values (log 2 brightness ratios).
 � Ignoring, for now, photon noise, on-chip noise,")
10. 1. 1 Radiometric Response Function(3/7) � Ignoring, for now, photon noise, on-chip noise, amplifier noise, and quantization noise, which we discuss shortly, you can often assume that the mapping between incoming light and the values stored in a RAW camera file is roughly linear.
")
10. 1. 1 Radiometric Response Function(4/7)
 � Given the complexity of all of this")
10. 1. 1 Radiometric Response Function(5/7) � Given the complexity of all of this processing, it is difficult to model the camera response function (Figure 10. 3 a), i. e. , the mapping between incoming irradiance and digital RGB values, from first principles. � A more practical approach is to calibrate the camera by measuring correspondences between incoming light and final values
")
10. 1. 1 Radiometric Response Function(6/7)
 �A more practical alternative is to use a")
10. 1. 1 Radiometric Response Function(7/7) �A more practical alternative is to use a calibration chart (Figure 10. 3 b) such as the Macbeth or Munsell Color. Checker Chart. � The biggest problem with this approach is to ensure uniform lighting. � One approach is to use a large dark room with a high-quality light source far away from (and perpendicular to) the chart.

Joke
 � In addition to knowing the camera response")
10. 1. 2 Noise level estimation(1/5) � In addition to knowing the camera response function, it is also often important to know the amount of noise being injected under a particular camera setting (e. g. , ISO/gain level). � The simplest characterization of noise is a single standard deviation, usually measured in gray levels, independent of pixel value.
 � As with the camera response function, the")
10. 1. 2 Noise level estimation(2/5) � As with the camera response function, the simplest way to estimate these quantities is in the lab, using a calibration chart. � The noise can be estimated either at each pixel independently, by taking repeated exposures and computing the temporal variance in the measurements, or over regions, by assuming that pixel values should all be the same within some region and computing a spatial variance.
 � First, segment the image into such regions")
10. 1. 2 Noise level estimation(3/5) � First, segment the image into such regions and fit a constant or linear function inside each region. Next, measure the standard deviation of the differences between the noisy input pixels and the smooth fitted function away from large gradients and region boundaries. Plot these as a function of output level for each color channel, as shown in Figure 10. 4.
 � Noise level function estimates obtained from a")
10. 1. 2 Noise level estimation(4/5) � Noise level function estimates obtained from a single color photograph.
 Original image. (b) Segmentation. (c) Persegment affine reconstruction. (d) Affine reconstruction plus")
� (a) Original image. (b) Segmentation. (c) Persegment affine reconstruction. (d) Affine reconstruction plus boundary blur. (e) The sorted eigenvalues in each segment. (f) RGB values projected onto the largest eigenvector.

Joke
 �A common problem with using wide-angle and wide-aperture lenses is")
10. 1. 3 Vignetting(1/6) �A common problem with using wide-angle and wide-aperture lenses is that the image tends to darken in the corners. This problem is generally known as vignetting and comes in several different forms, including natural, optical, and mechanical vignetting.
 � An approach is to stitch a panoramic scene and")
10. 1. 3 Vignetting(2/6) � An approach is to stitch a panoramic scene and to assume that the true radiance at each pixel comes from the central portion of each input image. � This is easier to do if the radiometric response function is already known (e. g. , by shooting in RAW mode) and if the exposure is kept constant.
 � (a) original average of the input images � (b)")
10. 1. 3 Vignetting(3/6) � (a) original average of the input images � (b) after compensating for vignetting � (c) using gradient domain blending only � (d) after both vignetting compensation and blending.
 � If only a single image is available, vignetting can")
10. 1. 3 Vignetting(4/6) � If only a single image is available, vignetting can be estimated by looking for slow consistent intensity variations in the radial direction.
 � The original algorithm proposed by Zheng, Lin, and Kang")
10. 1. 3 Vignetting(5/6) � The original algorithm proposed by Zheng, Lin, and Kang (2006) first pre-segmented the image into smoothly varying regions and then performed an analysis inside each region. � Instead of pre-segmenting the image, Zheng, Yu, Kang et al. (2008) compute the radial gradients at all the pixels and use the asymmetry in this to estimate the vignetting.
 � (a) original image with strong visible vignetting � (b)")
10. 1. 3 Vignetting(6/6) � (a) original image with strong visible vignetting � (b) vignetting compensation as described by Zheng, Zhou, Georgescu � (c–d) vignetting compensation as described by Zheng, Yu, Kang et al. (2008).

Joke
 estimation(1/7) � One final characteristic of imaging")
10. 1. 4 Optical blur (spatial response) estimation(1/7) � One final characteristic of imaging systems that you should calibrate is the spatial response function, which encodes the optical blur that gets convolved with the incoming image to produce the point-sampled image. � The shape of the convolution kernel, which is also known as point spread function (PSF)
 estimation(2/7) �A good estimate of this function")
10. 1. 4 Optical blur (spatial response) estimation(2/7) �A good estimate of this function is required for applications such as multi-image superresolution and de-blurring. � A more practical approach is to observe an image composed of long straight lines or bars, since these can be fitted to arbitrary precision. � Because the location of a horizontal or vertical edge can be aliased during acquisition, slightly slanted edges are preferred.
 estimation(3/7) � The slant-edge technique can be")
10. 1. 4 Optical blur (spatial response) estimation(3/7) � The slant-edge technique can be used to recover a 1 D projection of the 2 D PSF, slightly vertical edges are used to recover the horizontal line spread function (LSF). � The LSF is then often converted into the Fourier domain and its magnitude plotted as a one-dimensional modulation transfer function (MTF), which indicates which image frequencies are lost (blurred) and aliased during the acquisition process.
 estimation(4/7) � Finally a large linear least")
10. 1. 4 Optical blur (spatial response) estimation(4/7) � Finally a large linear least squares system is solved to recover the unknown PSF kernel K, where B is the sensed (blurred) image, I is the predicted (sharp) image, and D is an optional downsampling operator that matches the resolution of the ideal and sensed images.
 estimation(5/7) � Calibration pattern with edges equally")
10. 1. 4 Optical blur (spatial response) estimation(5/7) � Calibration pattern with edges equally distributed at all orientations that can be used for PSF and radial distortion estimation.
 estimation(6/7) � Sub-pixel PSFs at successively higher")
10. 1. 4 Optical blur (spatial response) estimation(6/7) � Sub-pixel PSFs at successively higher resolutions (note the interaction between the square sensing area and the circular lens blur).
 estimation(7/7) � (b) The radial distortion and")
10. 1. 4 Optical blur (spatial response) estimation(7/7) � (b) The radial distortion and chromatic aberration can also be estimated and removed. � (c) PSF for a misfocused (blurred) lens showing some vignetting effects in the corners.

Joke

10. 2 High Dynamic Range Imaging � 10. 2. 1 High Dynamic Range Imaging � 10. 2. 2 Tone mapping
 � Registered images taken at different exposures")
10. 2. 1 High Dynamic Range Imaging(1/17) � Registered images taken at different exposures can be used to calibrate the radiometric response function of a camera. � More importantly, they can help you create well-exposed photographs under challenging conditions, such as brightly lit scenes where any single exposure contains saturated (overexposed) and dark (underexposed) regions.
 � Sample indoor image where the areas")
10. 2. 1 High Dynamic Range Imaging(2/17) � Sample indoor image where the areas outside the window are overexposed and inside the room are too dark.
 � This problem is quite common, because")
10. 2. 1 High Dynamic Range Imaging(3/17) � This problem is quite common, because the natural world contains a range of radiance values that is far greater than can be captured with any photographic sensor or film. � Taking a set of bracketed exposures gives you the material from which to create a properly exposed photograph.
 � While it is possible to combine")
10. 2. 1 High Dynamic Range Imaging(4/17) � While it is possible to combine pixels from different exposures directly into a final composite, this approach runs the risk of creating contrast reversals and halos.
 � The more common approach is to")
10. 2. 1 High Dynamic Range Imaging(5/17) � The more common approach is to proceed in three stages: 1. 2. 3. Estimate the radiometric response function from the aligned images. Estimate a radiance map by selecting or blending pixels from different exposures. Tone map the resulting high dynamic range (HDR) image back into a displayable gamut.
 �")
10. 2. 1 High Dynamic Range Imaging(6/17) �
 �")
10. 2. 1 High Dynamic Range Imaging(7/17) �
 � Minimize the follow:")
10. 2. 1 High Dynamic Range Imaging(8/17) � Minimize the follow:
")
10. 2. 1 High Dynamic Range Imaging(9/17)
")
10. 2. 1 High Dynamic Range Imaging(10/17)
 � Under real-world conditions, casually acquired images")
10. 2. 1 High Dynamic Range Imaging(11/17) � Under real-world conditions, casually acquired images may not be perfectly registered and may contain moving objects. � We should use an algorithm that combines global registration with local motion estimation (optical flow) to accurately align the images before blending their radiance estimates (Figure 10. 16).
 � Since the images may have widely")
10. 2. 1 High Dynamic Range Imaging(12/17) � Since the images may have widely different exposures, care must be taken when estimating the motions, which must themselves be checked for consistency to avoid the creation of ghosts and object fragments. � Even this approach, however, may not work when the camera is simultaneously undergoing large motions and exposure changes.
")
10. 2. 1 High Dynamic Range Imaging(13/17)
 � Recently, some cameras, such as the")
10. 2. 1 High Dynamic Range Imaging(14/17) � Recently, some cameras, such as the Sony 550 and Pentax K-7, have started integrating multiple exposure merging and tone mapping directly into the camera body. � In the future, the need to compute high dynamic range images from multiple exposures may be eliminated by advances in camera sensor technology.
 � However, the need to blend such")
10. 2. 1 High Dynamic Range Imaging(15/17) � However, the need to blend such images and to tone map them to lower-gamut displays is likely to remain. � Fuji Super. CCD high dynamic range image sensor
 HDR image formats � If storage space")
10. 2. 1 High Dynamic Range Imaging(16/17) HDR image formats � If storage space is not an issue, storing each of the R, G, and B values as a 32 -bit IEEE float is the best solution. � A more compact representation is the Radiance format (. pic, . hdr), which uses a single common exponent and per-channel mantissas.
 Portable Pix. Map (. ppm) � (b) Radiance")
HDR image encoding formats � (a) Portable Pix. Map (. ppm) � (b) Radiance (. pic, . hdr) � (c) Open. EXR (. exr)

Joke
 � Once a radiance map has been computed, it")
10. 2. 1 Tone mapping(1/10) � Once a radiance map has been computed, it is usually necessary to display it on a lower gamut (i. e. , eight-bit) screen or printer. � The simplest way to compress a high dynamic range radiance image into a low dynamic range gamut is to use a global transfer curve (Larson, Rushmeier, and Piatko 1997).
 � (a) input HDR image, linearly mapped; � (b)")
10. 2. 1 Tone mapping(2/10) � (a) input HDR image, linearly mapped; � (b) gamma applied to each color channel independently; � (c) gamma applied to intensity
 � Unfortunately, when the image has a really wide")
10. 2. 1 Tone mapping(3/10) � Unfortunately, when the image has a really wide range of exposures, this global approach still fails to preserve details in regions with widely varying exposures. � Figure 10. 21 shows how this process works. As before, the image is split into its luminance and chrominance channels.
 � Then low-pass filtered to produce a base layer")
10. 2. 1 Tone mapping(4/10) � Then low-pass filtered to produce a base layer and a high-pass detail layer.
 � The base layer is then contrast reduced by")
10. 2. 1 Tone mapping(5/10) � The base layer is then contrast reduced by scaling to the desired log-luminance range, and added to the detail layer to produce the new log-luminance image.
 � (a) low-pass and high-pass filtered log luminance images")
10. 2. 1 Tone mapping(6/10) � (a) low-pass and high-pass filtered log luminance images and color image; � (b) resulting tone-mapped image shows visible halos around the trees.
 � Note how the detail layer has visible halos")
10. 2. 1 Tone mapping(7/10) � Note how the detail layer has visible halos around the high contrast edges, which are visible in the final tone-mapped image. This is because linear filtering, which is not edge preserving, produces halos in the detail layer. � The solution to this problem is to use an edge -preserving filter to create the base layer. Durand Dorsey (2002) study a number of such edge-preserving filters, and select bilateral filtering as their edge preserving filter.
 �A bilateral filter is an edge-preserving and noise reducing")
10. 2. 1 Tone mapping(8/10) �A bilateral filter is an edge-preserving and noise reducing smoothing filter. The intensity value at each pixel in an image is replaced by a weighted average of intensity values from nearby pixels. � An another to compressing the base layer is to compress its derivatives, i. e. , the gradient of the log-luminance image.
 � (a) lowpass and high-pass bilateral filtered log luminance")
10. 2. 1 Tone mapping(9/10) � (a) lowpass and high-pass bilateral filtered log luminance images and color image; � (b) resulting tone-mapped image shows no halos.
 � Gradient domain tone mapping")
10. 2. 1 Tone mapping(10/10) � Gradient domain tone mapping

10. 3 Super-resolution and blur removal � 10. 3. 1 Color image demosaicing

10. 3 Super-resolution and blur removal � While high dynamic range imaging enables us to obtain an image with a larger dynamic range than a single regular image, superresolution enables us to create images with higher spatial resolution and less noise than regular camera.

10. 3 Super-resolution and blur removal �

10. 3 Super-resolution and blur removal �

10. 3 Super-resolution and blur removal � In practice, this depends a lot on the amount of blur and aliasing in the camera optics, as well as the accuracy in the motion and PSF estimates. � Less blurring and more aliasing mean that there is more high frequency information available to be recovered. � However, because the least squares formulation uses no image prior, a lot of high-frequency noise can be introduced into the solution.

10. 3 Super-resolution and blur removal � For this reason, most super-resolution algorithms assume some form of image prior. � The simplest of these is to place a penalty on the image derivatives, and the overall problem is still linear least squares.

10. 3 Super-resolution and blur removal � The resulting prior image model is a Gaussian Markov random field (GMRF). � Unfortunately, GMRFs tend to produce solutions with visible ripples.

10. 3 Super-resolution and blur removal

10. 3 Super-resolution and blur removal �

10. 3 Super-resolution and blur removal � Figure 10. 32 shows the results of missing details using this approach and compares these results to a more recent algorithm by Fattal (2007). � This algorithm learns to predict oriented gradient magnitudes in the finer resolution image based on a pixel’s location relative to the nearest detected edge along with the corresponding edge statistics (magnitude and width). � It is also possible to combine robust derivative priors with example-based super-resolution.
 original 32 x")
10. 3 Super-resolution and blur removal � Example-based super-resolution: � (a) original 32 x 32 low-resolution image � (b) example-based super-resolved 256 X 256 image � (c) upsampling via imposed edge statistics

Joke

10. 3. 1 Color image demosaicing �A special case of super-resolution, which is used daily in most digital still cameras, is the process of demosaicing samples from a color filter array (CFA) into a full-color RGB image. � Figure 10. 34 shows the most commonly used CFA known as the Bayer pattern, which has twice as many green (G) sensors as red and blue sensors.
 color filter")
10. 3. 1 Color image demosaicing � Bayer RGB pattern: � (a) color filter array layout � (b) interpolated pixel values, with unknown values shown as lower case.

10. 3. 1 Color image demosaicing
 original full-resolution image. � (b) bilinear")
10. 3. 1 Color image demosaicing � (a) original full-resolution image. � (b) bilinear interpolation results, showing color fringing near the tip of the blue crayon and zippering near its left (vertical) edge. � (c) the high-quality linear interpolation results of Malvar, He, and Cutler (2004) (note the strong halo artifacts on the yellow crayon). � (d) using the local two-color prior of Bennett, Uyttendaele, Zitnick et al. (2006).

Joke

10. 4 Image Matting And Compositing � 10. 4. 1 Blue screen matting � 10. 4. 2 Natural image matting � 10. 4. 3 Smoke, shadow, and flash matting

10. 4 Image Matting And Compositing � Matting and compositing are the most commonly used components in making visual effects. � During matting, the foreground elements are extracted. During composiitng, the extracted foreground elements are placed onto a novel background.

10. 4 Image Matting And Compositing F foreground color C alpha matte B background plate
 input image with a “natural” background")
10. 4 Image Matting And Compositing � (a) input image with a “natural” background � (b) hand-drawn trimap—gray indicates unknown regions � (c) extracted alpha map � (d) extracted foreground colors � (e) composite over a new background

10. 4. 1 Blue Screen Matting
 describe")
10. 4. 1 Blue Screen Matting � Chuang, Curless, Salesin et al. (2001) describe a newer technique called Mishima’s algorithm, which involves fitting two polyhedral surfaces (centered at the mean background color), separating the foreground and background color distributions and then measuring the relative distance of a novel color to these surfaces to estimate.

10. 4. 1 Blue Screen Matting Two-screen matting � In their paper, Smith and Blinn (1996) also introduce an algorithm called triangulation matting that uses more than one known background color to over-constrain the equations required to estimate the opacity and foreground color F.

10. 4. 1 Blue Screen Matting

Joke

10. 4. 2 Natural Image Matting � The most general version of image matting is when nothing is known about the background except, perhaps, for a rough segmentation of the scene into foreground, background, and unknown regions, which is known as the trimap. � The paper by Wang and Cohen (2007 a) has detailed descriptions and comparisons of all of matting techniques.

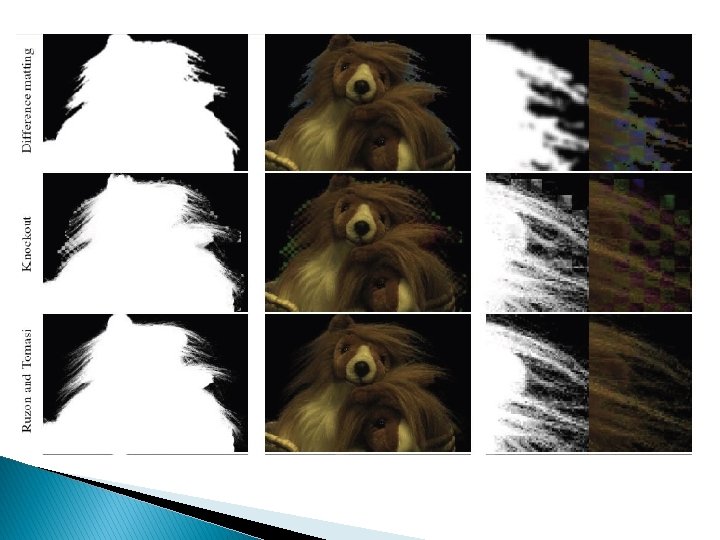
10. 4. 2 Natural Image Matting �A relatively simple algorithm for performing natural image matting is Knockout. � In this algorithm, the nearest known foreground and background pixels are determined and then blended with neighboring known pixels to produce a per-pixel foreground F and background B color estimate. The background color is then adjusted so that the measured color C lies on the line between F and B. � Finally, opacity is estimated on a per-channel basis, and the three estimates are combined based on per-channel color differences.

10. 4. 2 Natural Image Matting � More accurate matting results can be obtained if we treat the foreground and background colors as distributions sampled over some region. Ruzon and Tomasi (2000) model local color distributions as mixtures of (uncorrelated) Gaussians and compute these models in strips. � They then find the pairing of mixture components F and B that best describes the observed color C, compute the as the relative distance between these means, and adjust the estimates of F and B so they are collinear with C.

10. 4. 2 Natural Image Matting

10. 4. 2 Natural Image Matting � Stroke-based segmentation result

10. 4. 3 Smoke, Shadow, and Flash Matting � In addition to matting out solid objects with fractional boundaries, it is also possible to matte out translucent media such as smoke. � Starting with a video sequence, each pixel is modeled as a linear combination of its (unknown) background color and a constant foreground (smoke) color that is common to all pixels.

10. 4. 3 Smoke, Shadow, and Flash Matting � Voting in color space is used to estimate this foreground color and the distance along each color line is used to estimate the per-pixel temporally varying alpha.

Joke

10. 5 Texture Analysis and Synthesis � The problem of texture synthesis can be formulated as follows: given a small sample of a “texture”, generate a larger similarlooking image. As you can imagine, for certain sample textures, this problem can be quite challenging.
 given a small patch of texture, the task is to synthesize �")
� (a) given a small patch of texture, the task is to synthesize � (b) a similar-looking larger patch � (c) other semi-structured textures that are challenging to synthesize.

10. 5 Texture Analysis and Synthesis � Traditional approaches to texture analysis and synthesis try to match the spectrum of the source image. � The distributions of the responses at different frequencies must also match. � Heeger and Bergen (1995) develop an algorithm that alternates between matching the histograms of multi-scale responses and matching the final image histogram.

Application � exemplar-based inpainting with confidencebased filling order
 reference (target) image; � (b) source texture; � (c)")
Application Texture transfer � (a) reference (target) image; � (b) source texture; � (c) image rendered using the texture (Poisson blending).

END
- Slides: 102