
Chapter 10 OneSample Tests of Hypothesis 1 Goals

- Slides: 42
Chapter 10 One-Sample Tests of Hypothesis 1
Goals 1. Define a hypothesis and hypothesis testing 2. Describe the five step hypothesis testing procedure 3. Distinguish between a one-tailed and a two -tailed test of hypothesis 2
Goals 4. Conduct a test of hypothesis about a population mean 5. Conduct a test of hypothesis about a population proportion 3
Goals Chapters 1 – 9 Everything we have learned so far, we can use in this chapter! Chapters 10 We will test peoples claims by running experiments and then conclude whether the initial claims are reasonable or not! 4
Define A Hypothesis § A Hypothesis is a statement about the value of a population parameter developed for the purpose of testing. § Examples of hypotheses made about a population parameter are: § The mean monthly income for systems analysts is $3, 625 § Twenty percent of all customers at Bovine’s Chop House return for another meal within a month § The mean yearly salary for a real estate agent is 5 $85, 000
Define Hypothesis Testing § Hypothesis testing is a procedure, based on sample evidence and probability theory, used to determine whether: § The hypothesis is a reasonable statement and should not be rejected or § The hypothesis is unreasonable (not reasonable) and should be rejected § Parallel Examples: Legal System, Doctors 6
Define Hypothesis Testing § Illustration (Example 5): § The hypothesized mean yearly salary earned by full -time realtors is $85, 000 (sigma = $12, 549) § The mean salary is not significantly different from $85, 000 § If we take a sample and get a sample mean of $88, 595, we must make a decision about the difference of $3, 595 § Is it a true difference or § Is it sampling error § Five steps to hypothesis testing 7
5 Steps In Hypothesis Testing Procedure • Step 1: State Null Hypothesis (H 0)and Alternate Hypothesis (H 1). • Step 2: Select a Level of Significance (alpha). • Step 3: Select the Test Statistic (z or t). (Draw picture and calculate Critical Value). • Step 4: Formulate the Decision Rule based on steps 1 -3. • Step 5: Make a decision about the Null Hypothesis based on sample information. (Take a random sample, compute the test statistic, compare it to critical value, and make decision to reject or not reject null hypotheses). Interpret the results of the test. 8
Step 1: State Null Hypothesis (H 0)and Alternate Hypothesis (H 1) § Null Hypothesis = H 0 § “H sub zero, ” or “H sub not” § A statement about the value of a population parameter § This is the value we test § After the experiment, we will either: § Reject H 0, and accept alternative hypothesis § Fail to reject H 0 (Does not prove that H 0 is true) § Example: H 0 : μ ≤ $85, 000 9
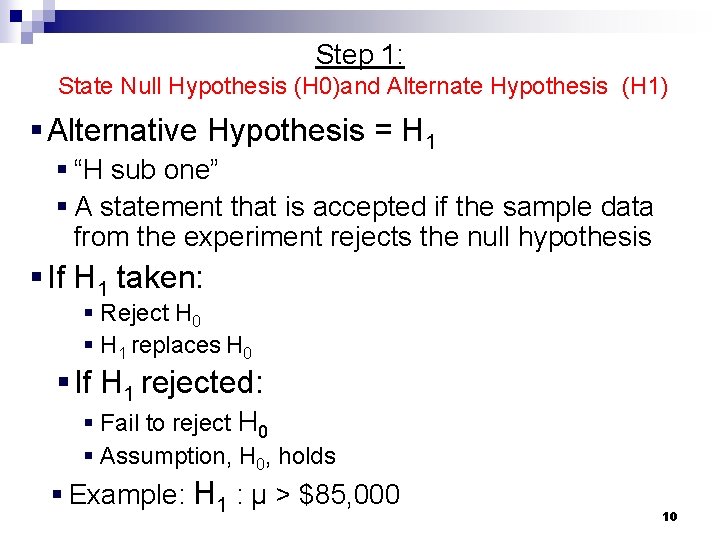
Step 1: State Null Hypothesis (H 0)and Alternate Hypothesis (H 1) § Alternative Hypothesis = H 1 § “H sub one” § A statement that is accepted if the sample data from the experiment rejects the null hypothesis § If H 1 taken: § Reject H 0 § H 1 replaces H 0 § If H 1 rejected: § Fail to reject H 0 § Assumption, H 0, holds § Example: H 1 : μ > $85, 000 10
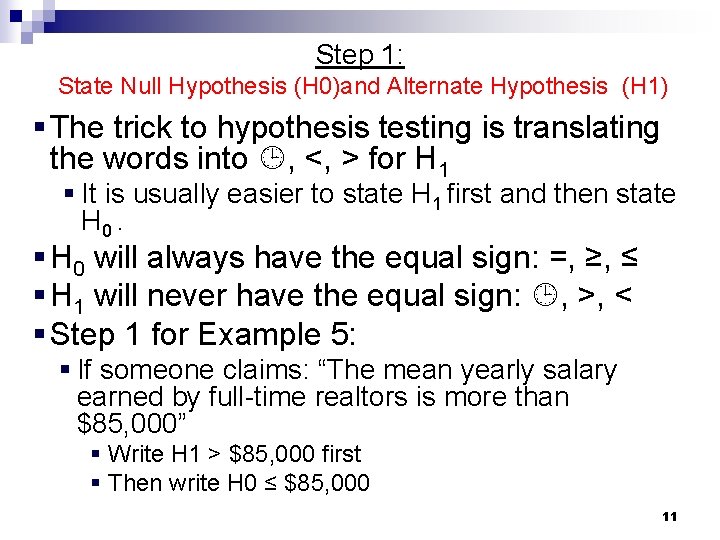
Step 1: State Null Hypothesis (H 0)and Alternate Hypothesis (H 1) § The trick to hypothesis testing is translating the words into , <, > for H 1 § It is usually easier to state H 1 first and then state H 0. § H 0 will always have the equal sign: =, ≥, ≤ § H 1 will never have the equal sign: , >, < § Step 1 for Example 5: § If someone claims: “The mean yearly salary earned by full-time realtors is more than $85, 000” § Write H 1 > $85, 000 first § Then write H 0 ≤ $85, 000 11
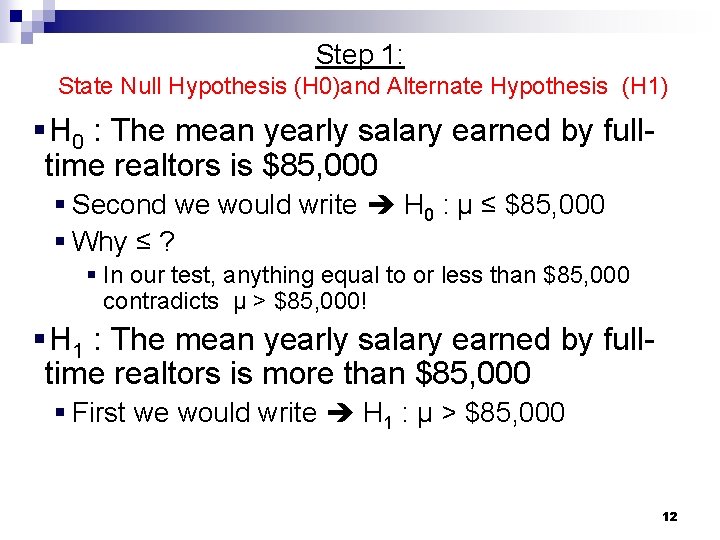
Step 1: State Null Hypothesis (H 0)and Alternate Hypothesis (H 1) § H 0 : The mean yearly salary earned by fulltime realtors is $85, 000 § Second we would write H 0 : µ ≤ $85, 000 § Why ≤ ? § In our test, anything equal to or less than $85, 000 contradicts µ > $85, 000! § H 1 : The mean yearly salary earned by fulltime realtors is more than $85, 000 § First we would write H 1 : µ > $85, 000 12
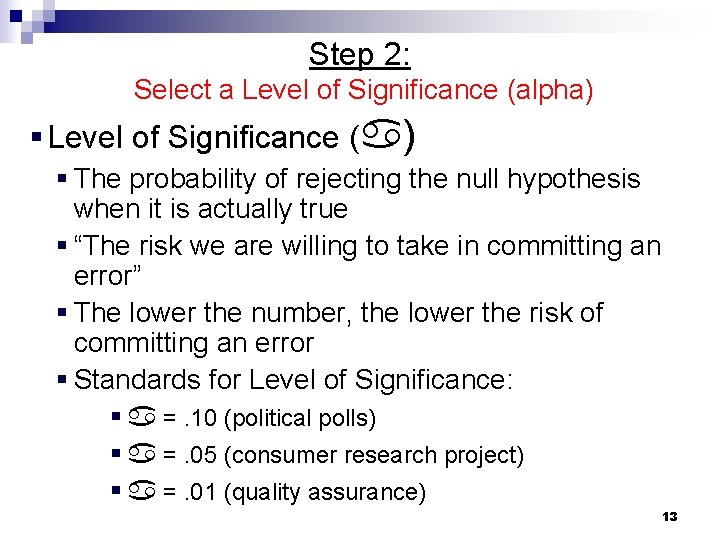
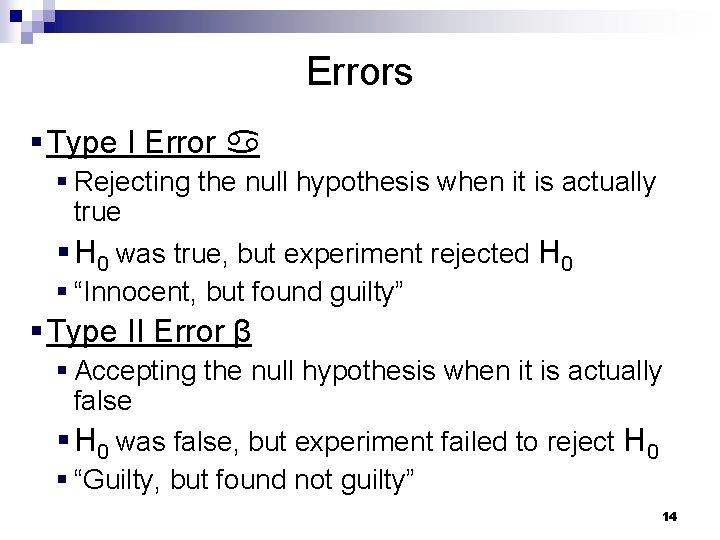
Step 2: Select a Level of Significance (alpha) § Level of Significance ( ) § The probability of rejecting the null hypothesis when it is actually true § “The risk we are willing to take in committing an error” § The lower the number, the lower the risk of committing an error § Standards for Level of Significance: § =. 10 (political polls) § =. 05 (consumer research project) § =. 01 (quality assurance) 13
Errors § Type I Error § Rejecting the null hypothesis when it is actually true § H 0 was true, but experiment rejected H 0 § “Innocent, but found guilty” § Type II Error β § Accepting the null hypothesis when it is actually false § H 0 was false, but experiment failed to reject H 0 § “Guilty, but found not guilty” 14
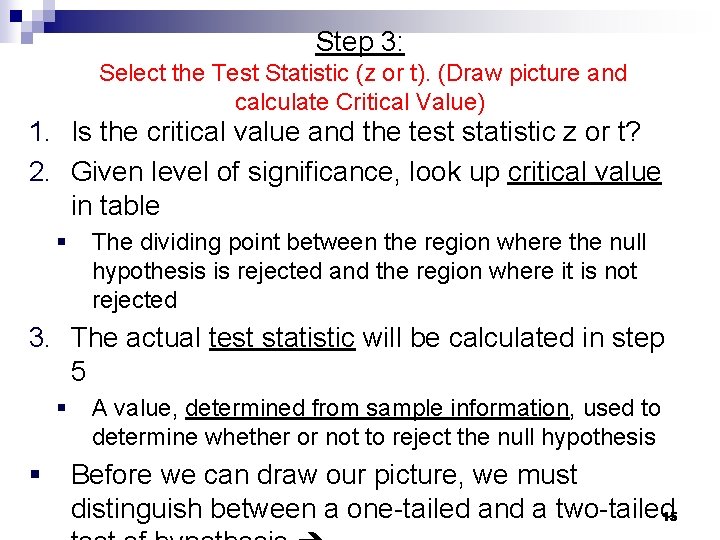
Step 3: Select the Test Statistic (z or t). (Draw picture and calculate Critical Value) 1. Is the critical value and the test statistic z or t? 2. Given level of significance, look up critical value in table § The dividing point between the region where the null hypothesis is rejected and the region where it is not rejected 3. The actual test statistic will be calculated in step 5 § § A value, determined from sample information, used to determine whether or not to reject the null hypothesis Before we can draw our picture, we must distinguish between a one-tailed and a two-tailed 15
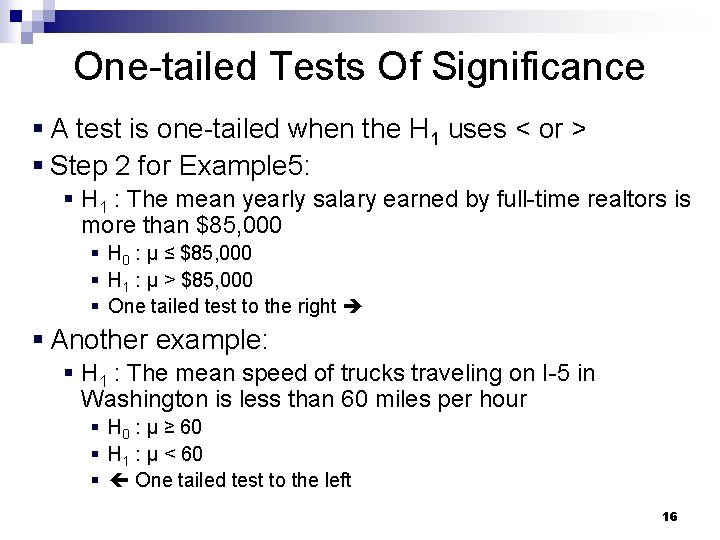
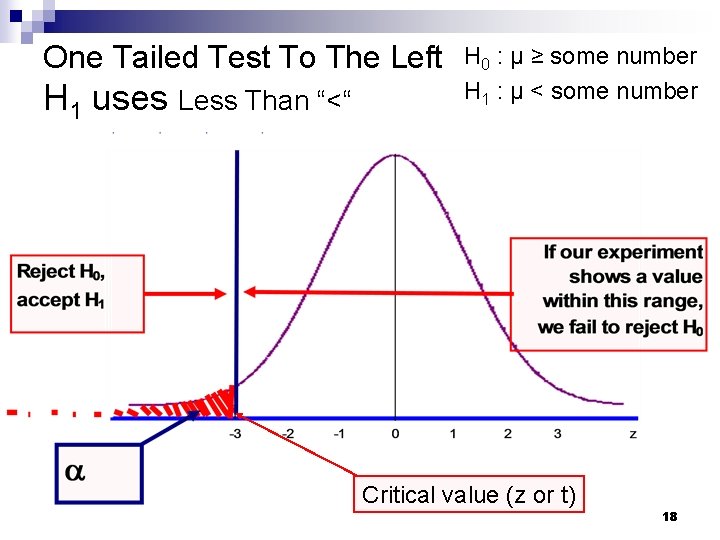
One-tailed Tests Of Significance § A test is one-tailed when the H 1 uses < or > § Step 2 for Example 5: § H 1 : The mean yearly salary earned by full-time realtors is more than $85, 000 § H 0 : µ ≤ $85, 000 § H 1 : µ > $85, 000 § One tailed test to the right § Another example: § H 1 : The mean speed of trucks traveling on I-5 in Washington is less than 60 miles per hour § H 0 : µ ≥ 60 § H 1 : µ < 60 § One tailed test to the left 16
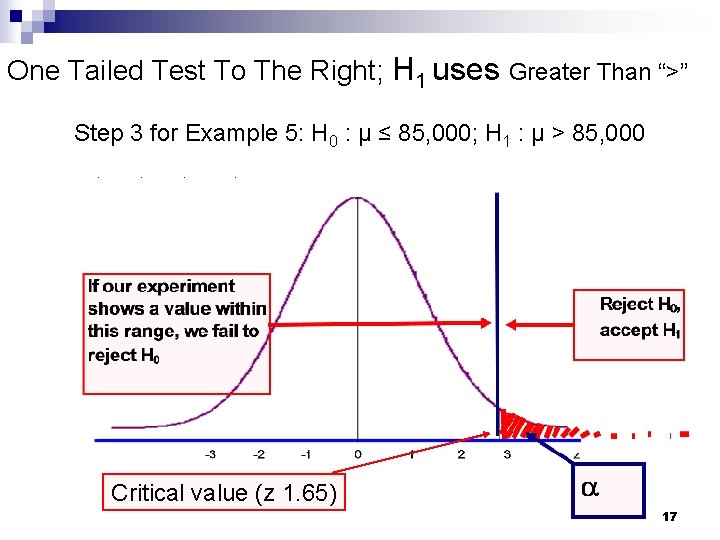
One Tailed Test To The Right; H 1 uses Greater Than “>” Step 3 for Example 5: H 0 : µ ≤ 85, 000; H 1 : µ > 85, 000 Critical value (z 1. 65) 17
One Tailed Test To The Left H 1 uses Less Than “<“ H 0 : µ ≥ some number H 1 : µ < some number Critical value (z or t) 18
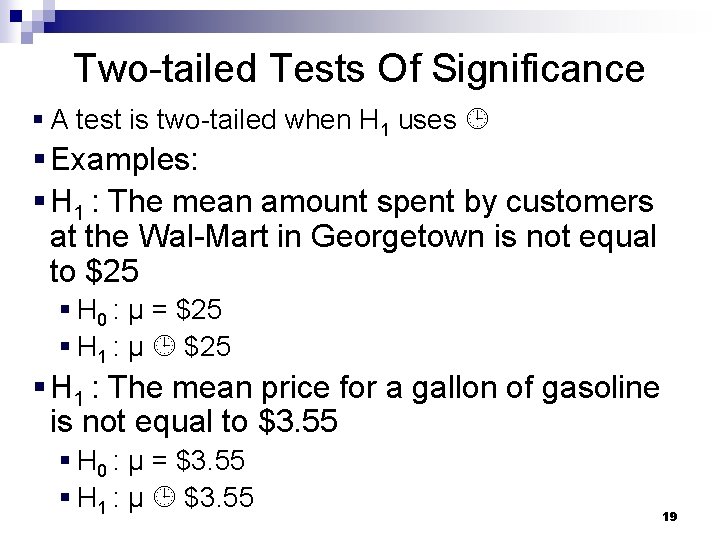
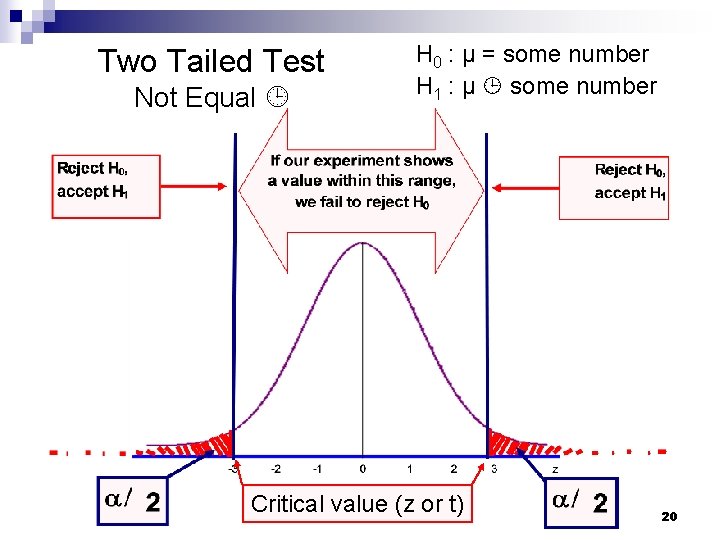
Two-tailed Tests Of Significance § A test is two-tailed when H 1 uses § Examples: § H 1 : The mean amount spent by customers at the Wal-Mart in Georgetown is not equal to $25 § H 0 : µ = $25 § H 1 : µ $25 § H 1 : The mean price for a gallon of gasoline is not equal to $3. 55 § H 0 : µ = $3. 55 § H 1 : µ $3. 55 19
Two Tailed Test Not Equal H 0 : µ = some number H 1 : µ some number Critical value (z or t) 20
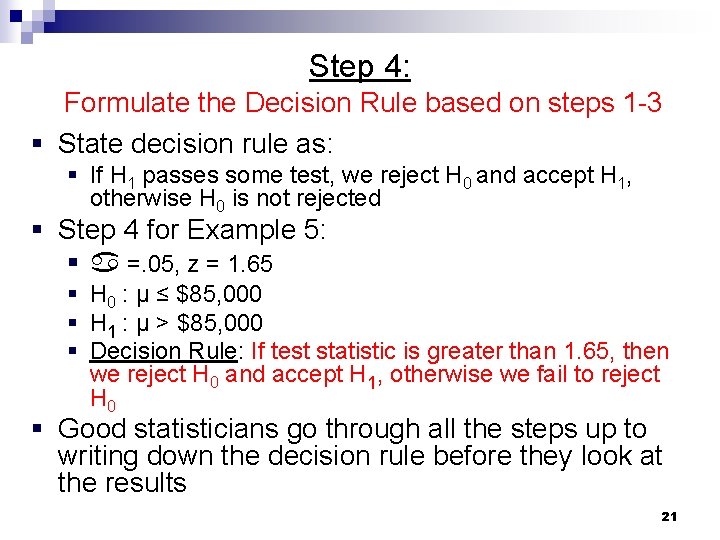
Step 4: Formulate the Decision Rule based on steps 1 -3 § State decision rule as: § If H 1 passes some test, we reject H 0 and accept H 1, otherwise H 0 is not rejected § Step 4 for Example 5: § =. 05, z = 1. 65 § H 0 : µ ≤ $85, 000 § H 1 : µ > $85, 000 § Decision Rule: If test statistic is greater than 1. 65, then we reject H 0 and accept H 1, otherwise we fail to reject H 0 § Good statisticians go through all the steps up to writing down the decision rule before they look at the results 21
Step 5: Make a decision about the Null Hypothesis based on sample information. (Take a random sample, compute the test statistic, compare it to critical value, and make decision to reject or not reject null hypotheses). Interpret the results of the test. § Take sample, calculate mean and standard deviation, then calculate the test statistic and come to a conclusion § The two possible conclusions are: § “Do not reject H 0 or § Reject H 0, accept H 1 § State decision as: § “ The experiment supports the claim that H 1” § “ The experiment does not support the claim that H 1” § “Evidence indicates…” § “Data shows…” 22
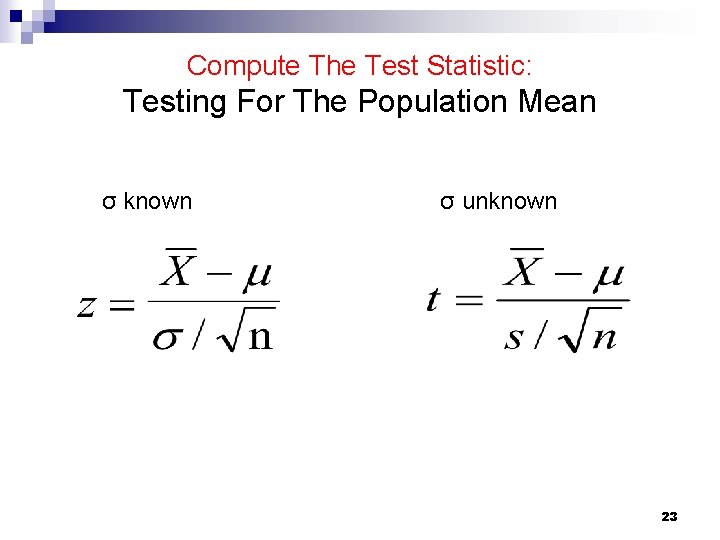
Compute The Test Statistic: Testing For The Population Mean σ known σ unknown 23
Step 5: Make a decision about the Null Hypothesis based on sample information. (Take a random sample, compute the test statistic, compare it to critical value, and make decision to reject or not reject null hypotheses). Interpret the results of the test. § Failing to reject H 0 does not prove H 0, it simply means that we have failed to disprove H 0 § Rejecting H 0 does not prove H 1, it simply means that H 0 is not reasonable 24
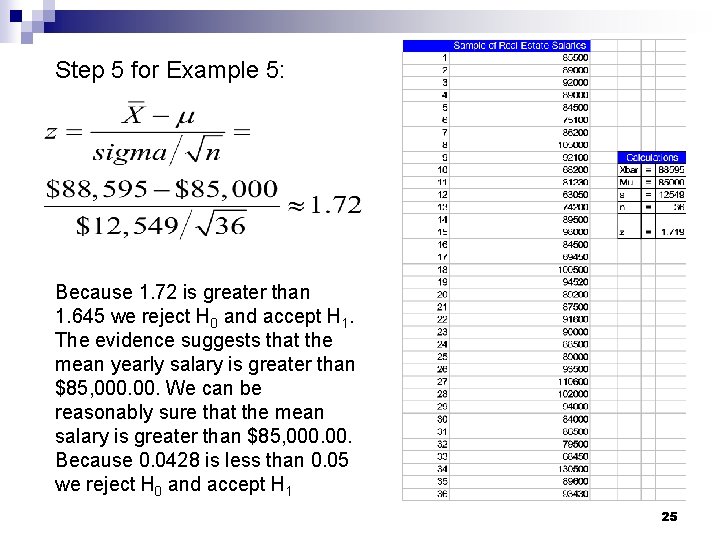
Step 5 for Example 5: Because 1. 72 is greater than 1. 645 we reject H 0 and accept H 1. The evidence suggests that the mean yearly salary is greater than $85, 000. We can be reasonably sure that the mean salary is greater than $85, 000. Because 0. 0428 is less than 0. 05 we reject H 0 and accept H 1 25
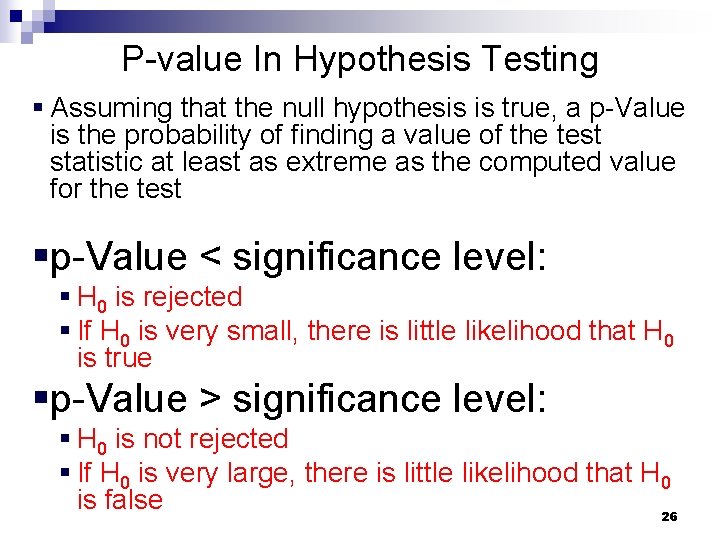
P-value In Hypothesis Testing § Assuming that the null hypothesis is true, a p-Value is the probability of finding a value of the test statistic at least as extreme as the computed value for the test §p-Value < significance level: § H 0 is rejected § If H 0 is very small, there is little likelihood that H 0 is true §p-Value > significance level: § H 0 is not rejected § If H 0 is very large, there is little likelihood that H 0 is false 26
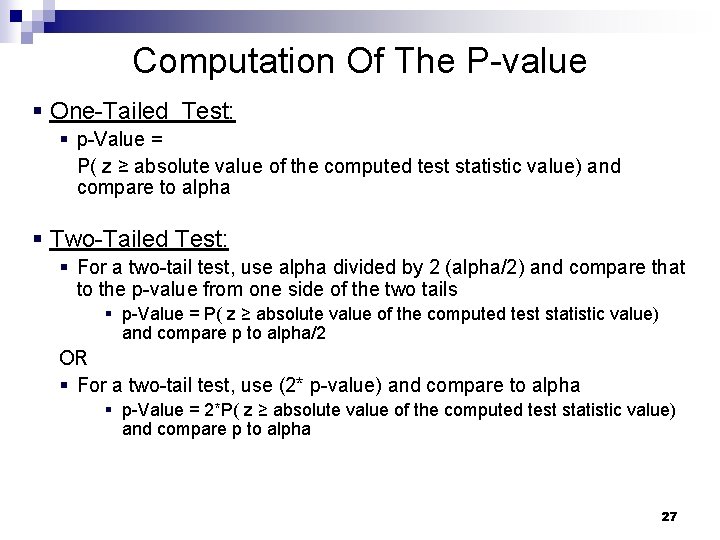
Computation Of The P-value § One-Tailed Test: § p-Value = P( z ≥ absolute value of the computed test statistic value) and compare to alpha § Two-Tailed Test: § For a two-tail test, use alpha divided by 2 (alpha/2) and compare that to the p-value from one side of the two tails § p-Value = P( z ≥ absolute value of the computed test statistic value) and compare p to alpha/2 OR § For a two-tail test, use (2* p-value) and compare to alpha § p-Value = 2*P( z ≥ absolute value of the computed test statistic value) and compare p to alpha 27
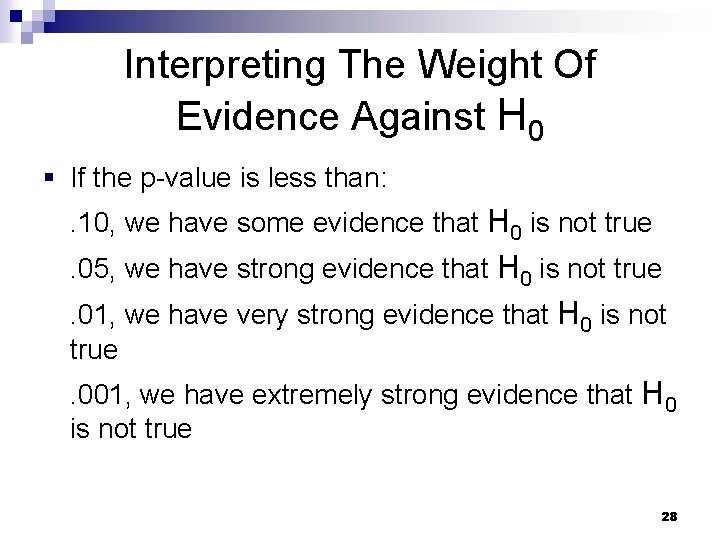
Interpreting The Weight Of Evidence Against H 0 § If the p-value is less than: . 10, we have some evidence that H 0 is not true. 05, we have strong evidence that H 0 is not true. 01, we have very strong evidence that H 0 is not true. 001, we have extremely strong evidence that H 0 is not true 28
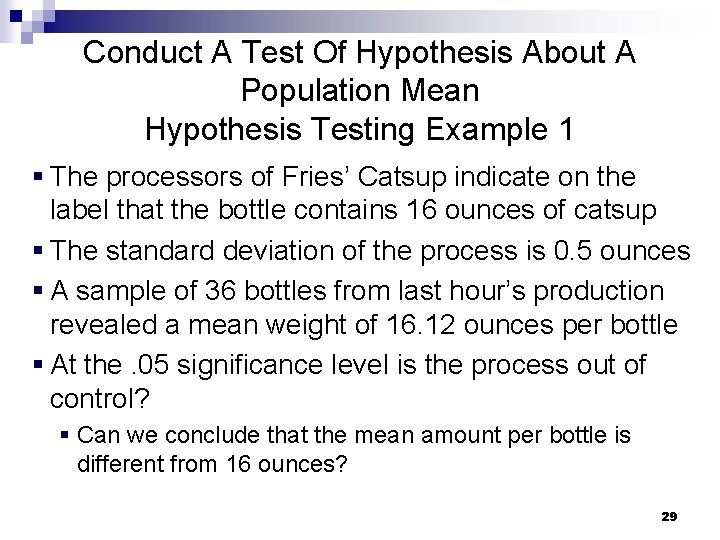
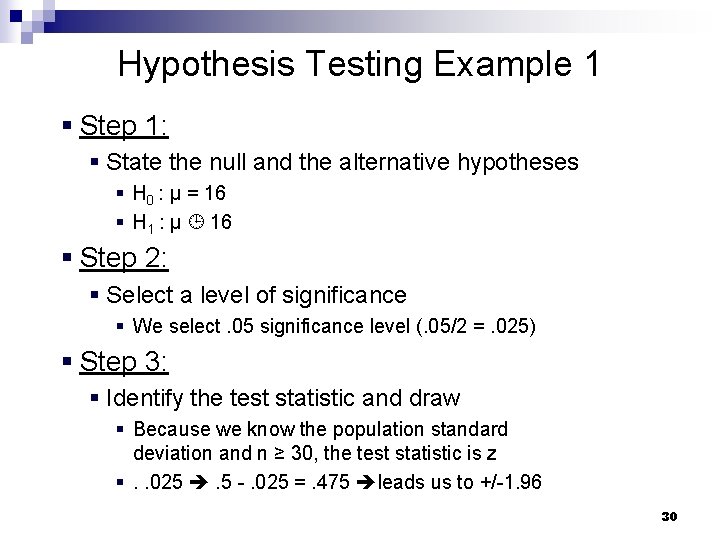
Conduct A Test Of Hypothesis About A Population Mean Hypothesis Testing Example 1 § The processors of Fries’ Catsup indicate on the label that the bottle contains 16 ounces of catsup § The standard deviation of the process is 0. 5 ounces § A sample of 36 bottles from last hour’s production revealed a mean weight of 16. 12 ounces per bottle § At the. 05 significance level is the process out of control? § Can we conclude that the mean amount per bottle is different from 16 ounces? 29
Hypothesis Testing Example 1 § Step 1: § State the null and the alternative hypotheses § H 0 : μ = 16 § H 1 : μ 16 § Step 2: § Select a level of significance § We select. 05 significance level (. 05/2 =. 025) § Step 3: § Identify the test statistic and draw § Because we know the population standard deviation and n ≥ 30, the test statistic is z §. . 025 . 5 -. 025 =. 475 leads us to +/-1. 96 30
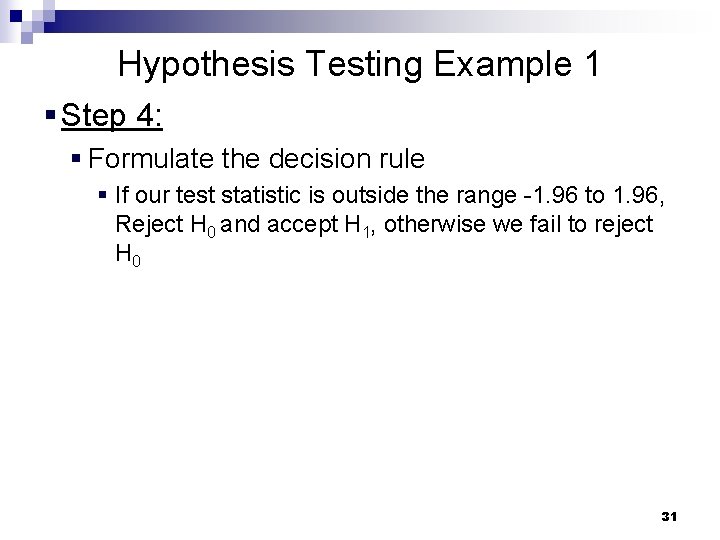
Hypothesis Testing Example 1 § Step 4: § Formulate the decision rule § If our test statistic is outside the range -1. 96 to 1. 96, Reject H 0 and accept H 1, otherwise we fail to reject H 0 31
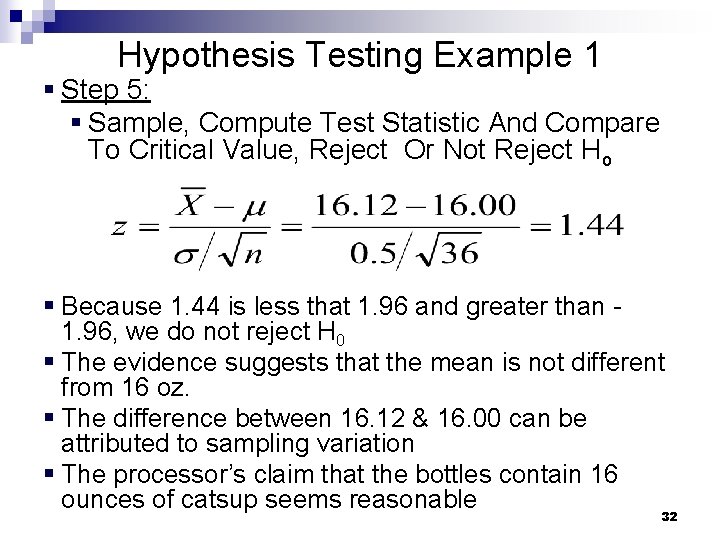
Hypothesis Testing Example 1 § Step 5: § Sample, Compute Test Statistic And Compare To Critical Value, Reject Or Not Reject Ho § Because 1. 44 is less that 1. 96 and greater than 1. 96, we do not reject H 0 § The evidence suggests that the mean is not different from 16 oz. § The difference between 16. 12 & 16. 00 can be attributed to sampling variation § The processor’s claim that the bottles contain 16 ounces of catsup seems reasonable 32
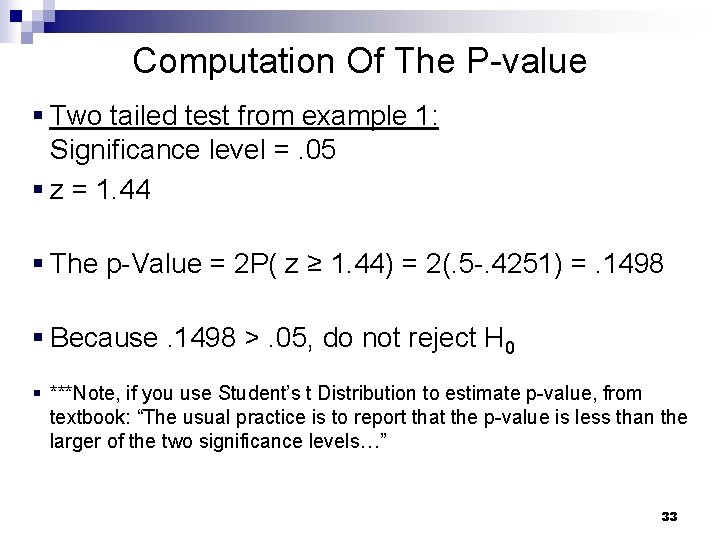
Computation Of The P-value § Two tailed test from example 1: Significance level =. 05 § z = 1. 44 § The p-Value = 2 P( z ≥ 1. 44) = 2(. 5 -. 4251) =. 1498 § Because. 1498 >. 05, do not reject H 0 § ***Note, if you use Student’s t Distribution to estimate p-value, from textbook: “The usual practice is to report that the p-value is less than the larger of the two significance levels…” 33
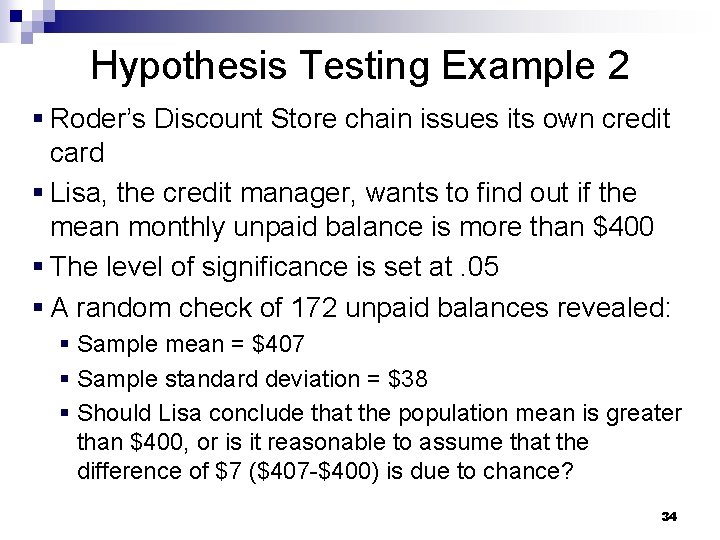
Hypothesis Testing Example 2 § Roder’s Discount Store chain issues its own credit card § Lisa, the credit manager, wants to find out if the mean monthly unpaid balance is more than $400 § The level of significance is set at. 05 § A random check of 172 unpaid balances revealed: § Sample mean = $407 § Sample standard deviation = $38 § Should Lisa conclude that the population mean is greater than $400, or is it reasonable to assume that the difference of $7 ($407 -$400) is due to chance? 34
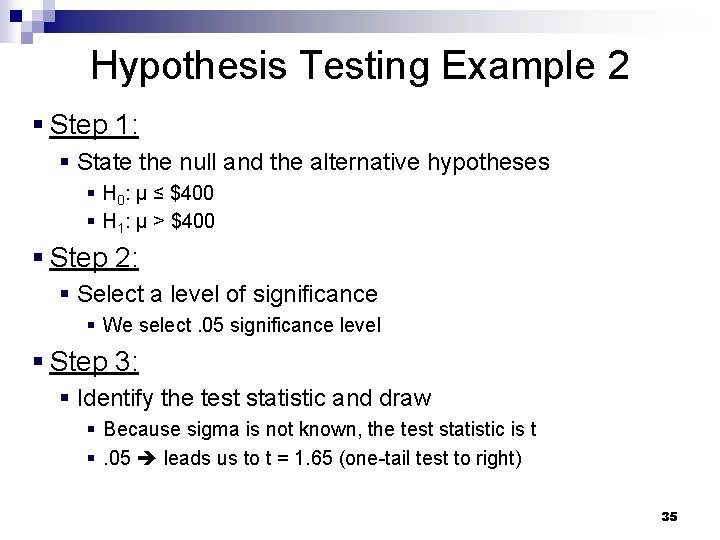
Hypothesis Testing Example 2 § Step 1: § State the null and the alternative hypotheses § H 0: µ ≤ $400 § H 1: µ > $400 § Step 2: § Select a level of significance § We select. 05 significance level § Step 3: § Identify the test statistic and draw § Because sigma is not known, the test statistic is t §. 05 leads us to t = 1. 65 (one-tail test to right) 35
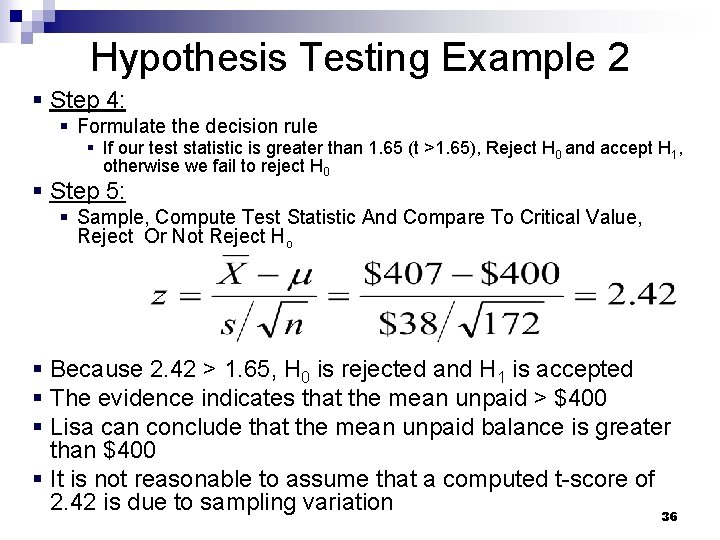
Hypothesis Testing Example 2 § Step 4: § Formulate the decision rule § If our test statistic is greater than 1. 65 (t >1. 65), Reject H 0 and accept H 1, otherwise we fail to reject H 0 § Step 5: § Sample, Compute Test Statistic And Compare To Critical Value, Reject Or Not Reject Ho § Because 2. 42 > 1. 65, H 0 is rejected and H 1 is accepted § The evidence indicates that the mean unpaid > $400 § Lisa can conclude that the mean unpaid balance is greater than $400 § It is not reasonable to assume that a computed t-score of 2. 42 is due to sampling variation 36
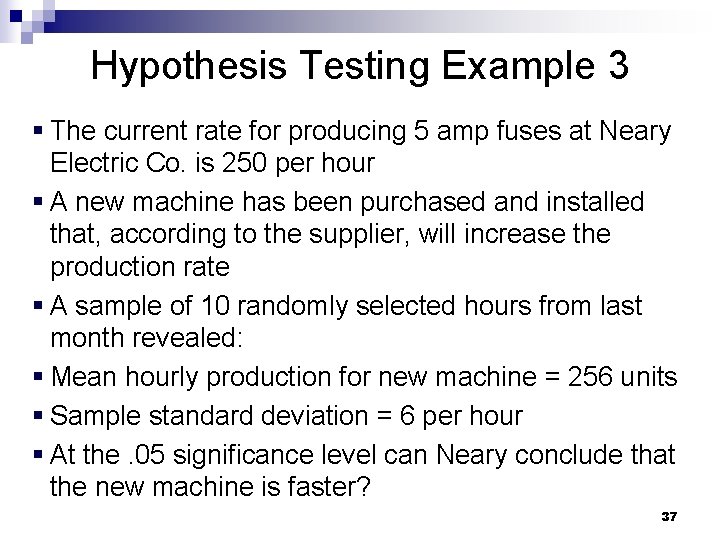
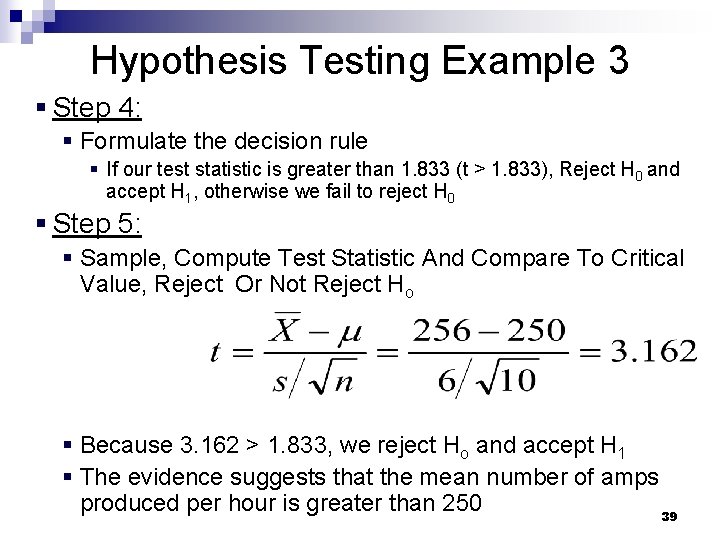
Hypothesis Testing Example 3 § The current rate for producing 5 amp fuses at Neary Electric Co. is 250 per hour § A new machine has been purchased and installed that, according to the supplier, will increase the production rate § A sample of 10 randomly selected hours from last month revealed: § Mean hourly production for new machine = 256 units § Sample standard deviation = 6 per hour § At the. 05 significance level can Neary conclude that the new machine is faster? 37
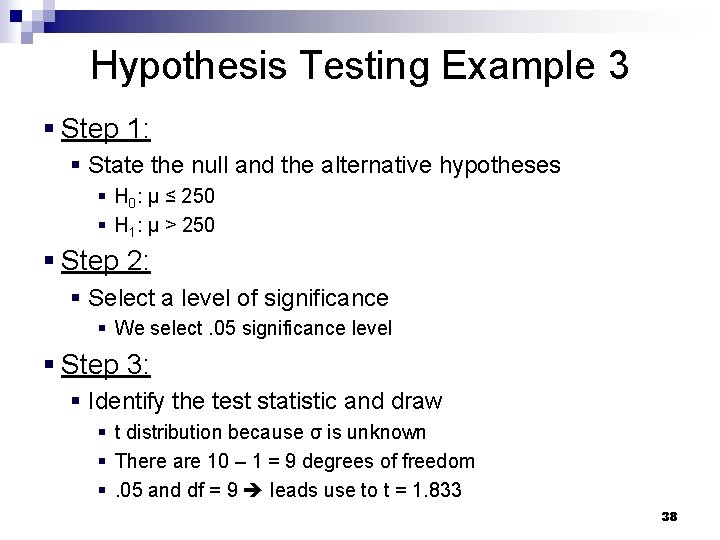
Hypothesis Testing Example 3 § Step 1: § State the null and the alternative hypotheses § H 0: µ ≤ 250 § H 1: µ > 250 § Step 2: § Select a level of significance § We select. 05 significance level § Step 3: § Identify the test statistic and draw § t distribution because σ is unknown § There are 10 – 1 = 9 degrees of freedom §. 05 and df = 9 leads use to t = 1. 833 38
Hypothesis Testing Example 3 § Step 4: § Formulate the decision rule § If our test statistic is greater than 1. 833 (t > 1. 833), Reject H 0 and accept H 1, otherwise we fail to reject H 0 § Step 5: § Sample, Compute Test Statistic And Compare To Critical Value, Reject Or Not Reject Ho § Because 3. 162 > 1. 833, we reject Ho and accept H 1 § The evidence suggests that the mean number of amps produced per hour is greater than 250 39
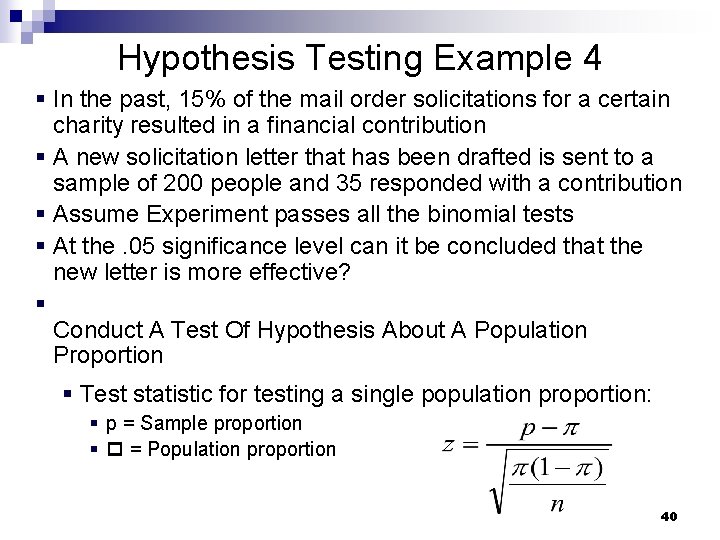
Hypothesis Testing Example 4 § In the past, 15% of the mail order solicitations for a certain charity resulted in a financial contribution § A new solicitation letter that has been drafted is sent to a sample of 200 people and 35 responded with a contribution § Assume Experiment passes all the binomial tests § At the. 05 significance level can it be concluded that the new letter is more effective? § Conduct A Test Of Hypothesis About A Population Proportion § Test statistic for testing a single population proportion: § p = Sample proportion § = Population proportion 40
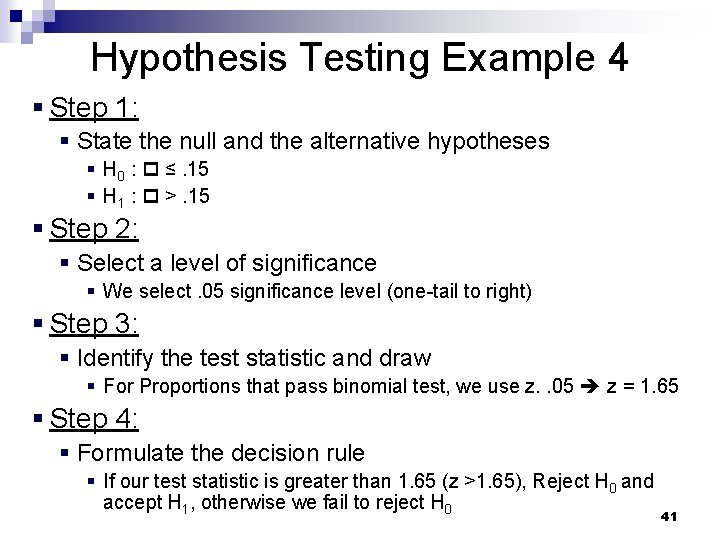
Hypothesis Testing Example 4 § Step 1: § State the null and the alternative hypotheses § H 0 : ≤. 15 § H 1 : >. 15 § Step 2: § Select a level of significance § We select. 05 significance level (one-tail to right) § Step 3: § Identify the test statistic and draw § For Proportions that pass binomial test, we use z. . 05 z = 1. 65 § Step 4: § Formulate the decision rule § If our test statistic is greater than 1. 65 (z >1. 65), Reject H 0 and accept H 1, otherwise we fail to reject H 0 41
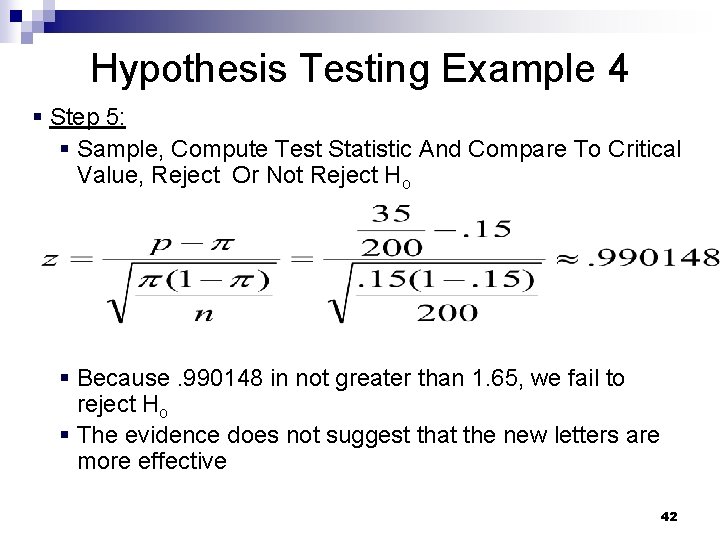
Hypothesis Testing Example 4 § Step 5: § Sample, Compute Test Statistic And Compare To Critical Value, Reject Or Not Reject Ho § Because. 990148 in not greater than 1. 65, we fail to reject Ho § The evidence does not suggest that the new letters are more effective 42