
Chapter 10 Hoods Hoo and Fans Hoods What







- Slides: 69
Chapter 10 • Hoods Hoo and Fans
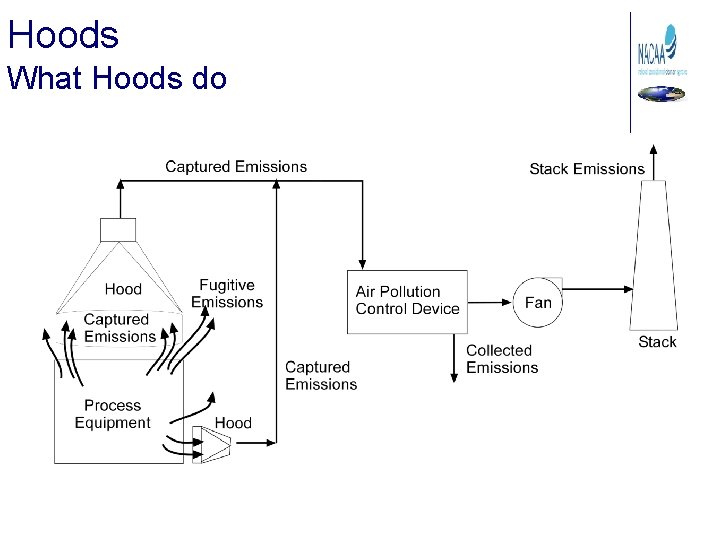
Hoods What Hoods do
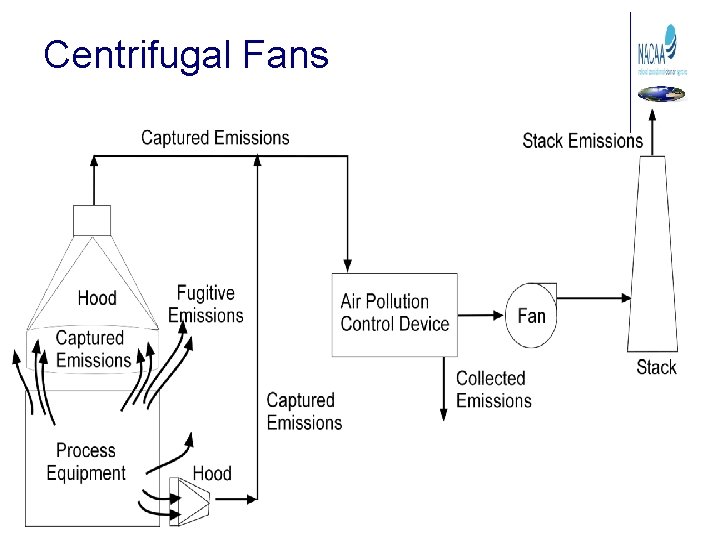
Fugitive Emissions • Escape capture by process equipment exhaust hoods • Are emitted during material transfer • Are emitted to the atmosphere from the source area • Are emitted directly from process equipment Fugitive emissions = Total emissions – Emissions captured by hood
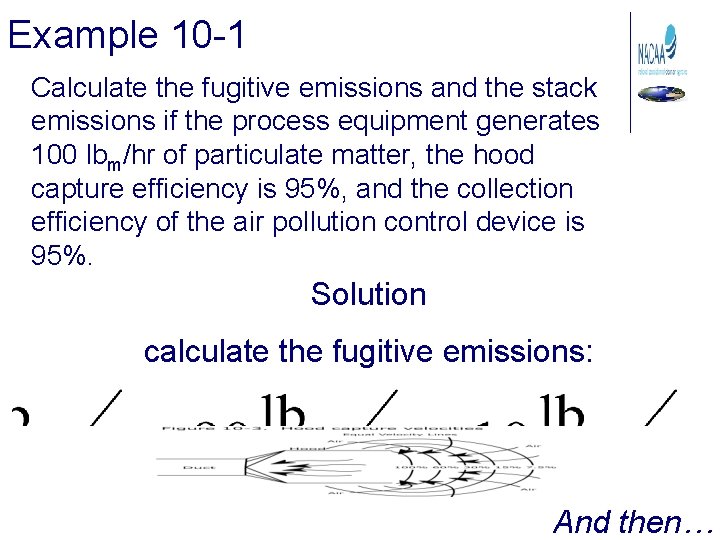
Example 10 -1 Calculate the fugitive emissions and the stack emissions if the process equipment generates 100 lbm/hr of particulate matter, the hood capture efficiency is 95%, and the collection efficiency of the air pollution control device is 95%. Solution calculate the fugitive emissions: And then…
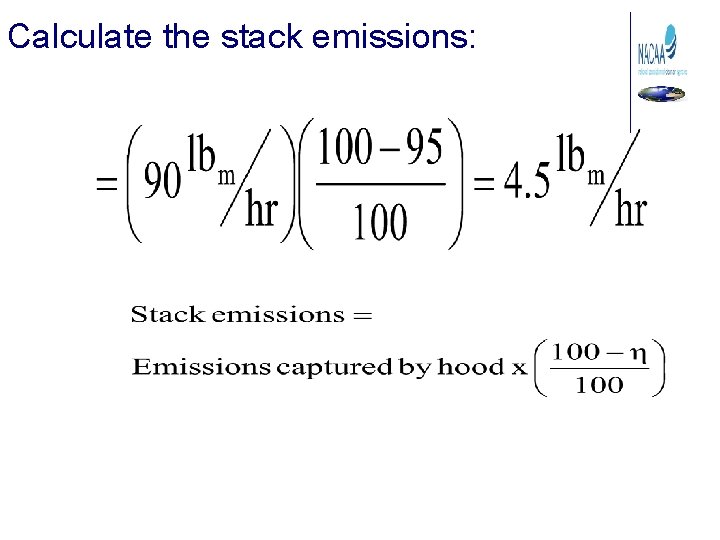
Calculate the stack emissions:
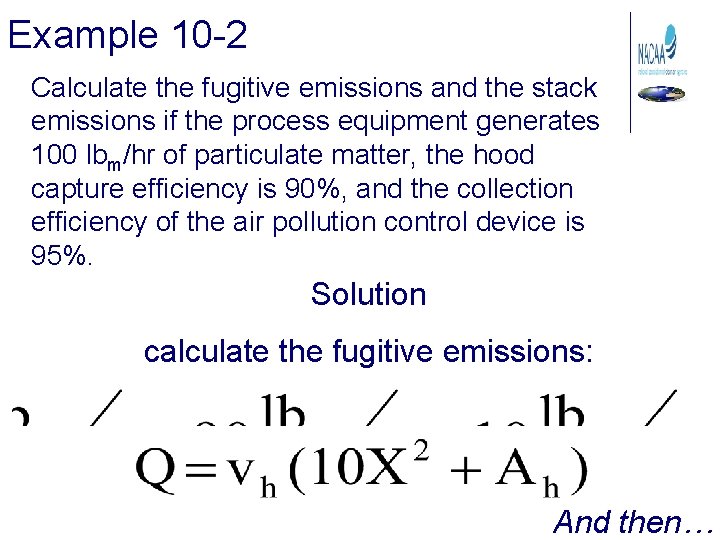
Example 10 -2 Calculate the fugitive emissions and the stack emissions if the process equipment generates 100 lbm/hr of particulate matter, the hood capture efficiency is 90%, and the collection efficiency of the air pollution control device is 95%. Solution calculate the fugitive emissions: And then…
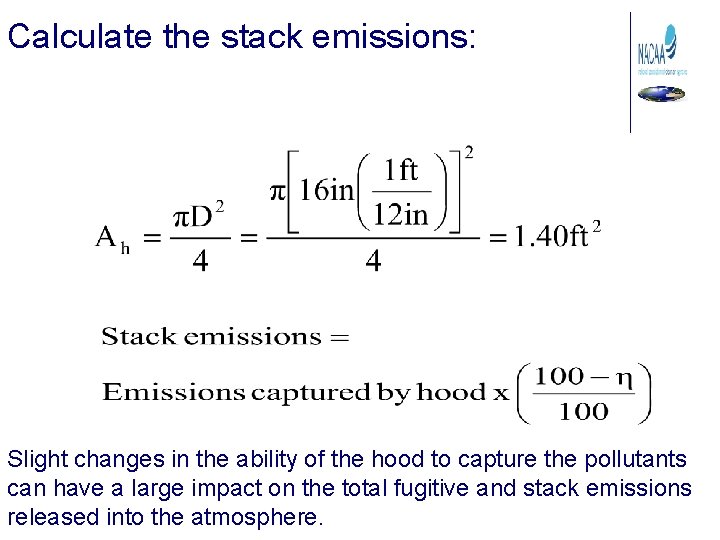
Calculate the stack emissions: Slight changes in the ability of the hood to capture the pollutants can have a large impact on the total fugitive and stack emissions released into the atmosphere.
Can’t Always see them… • If there are many small fugitive sites • If there is one major site that cannot be seen • If the matter is not in the size range that causes light scattering
Hood Operating Principles • Operate under negative pressure • Hood must be close to emission source. • Capture Velocity: the air velocity at any point in front of the hood that will overcome opposing air currents and capture contaminated air.
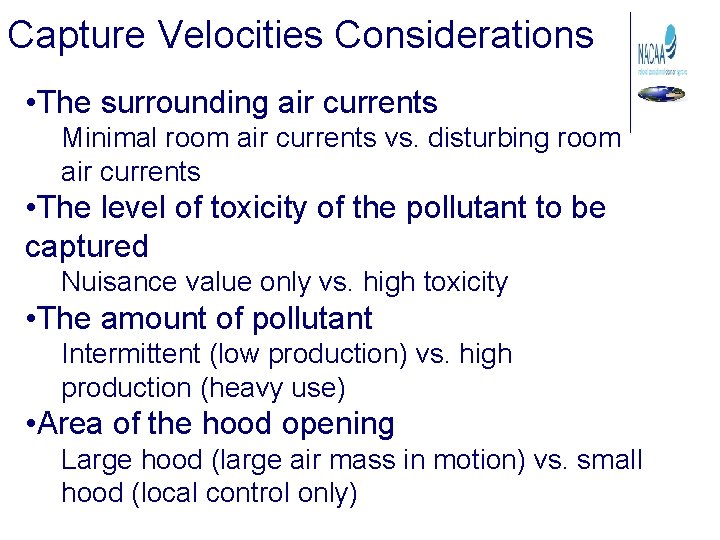
Capture Velocities Considerations • The surrounding air currents Minimal room air currents vs. disturbing room air currents • The level of toxicity of the pollutant to be captured Nuisance value only vs. high toxicity • The amount of pollutant Intermittent (low production) vs. high production (heavy use) • Area of the hood opening Large hood (large air mass in motion) vs. small hood (local control only)
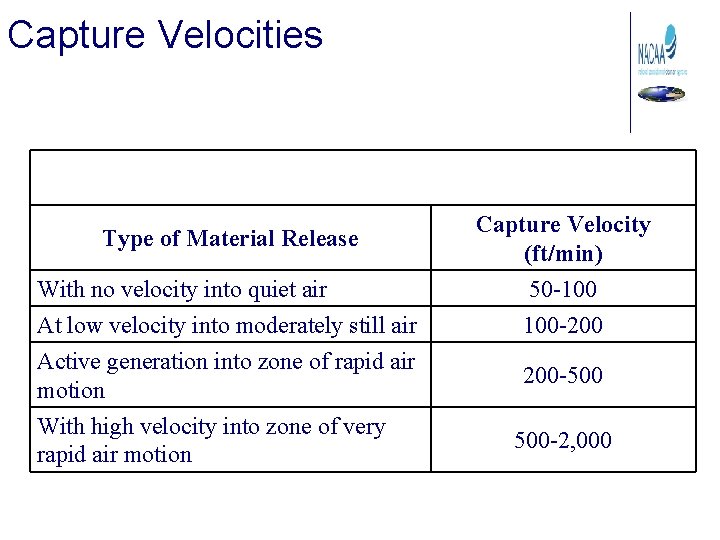
Capture Velocities Type of Material Release With no velocity into quiet air At low velocity into moderately still air Active generation into zone of rapid air motion With high velocity into zone of very rapid air motion Capture Velocity (ft/min) 50 -100 100 -200 200 -500 500 -2, 000
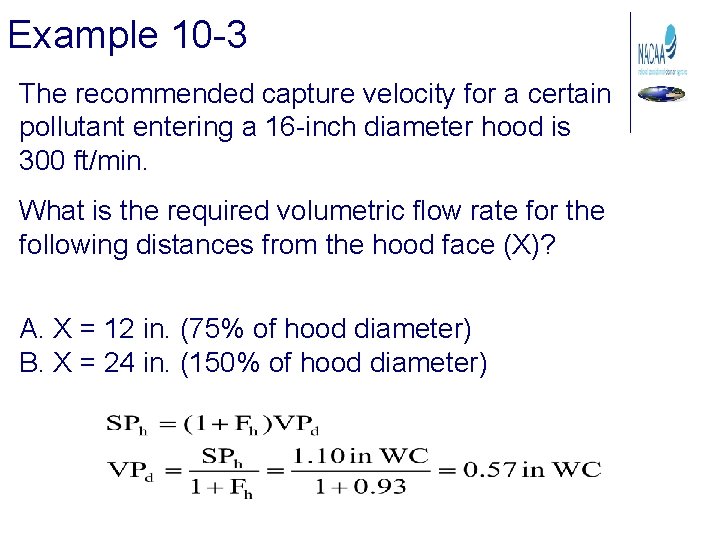
Example 10 -3 The recommended capture velocity for a certain pollutant entering a 16 -inch diameter hood is 300 ft/min. What is the required volumetric flow rate for the following distances from the hood face (X)? A. X = 12 in. (75% of hood diameter) B. X = 24 in. (150% of hood diameter)
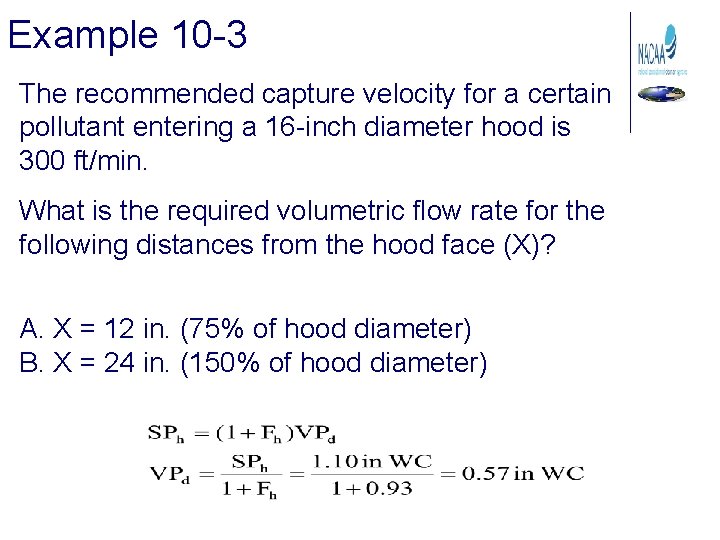
Example 10 -3 The recommended capture velocity for a certain pollutant entering a 16 -inch diameter hood is 300 ft/min. What is the required volumetric flow rate for the following distances from the hood face (X)? A. X = 12 in. (75% of hood diameter) B. X = 24 in. (150% of hood diameter)
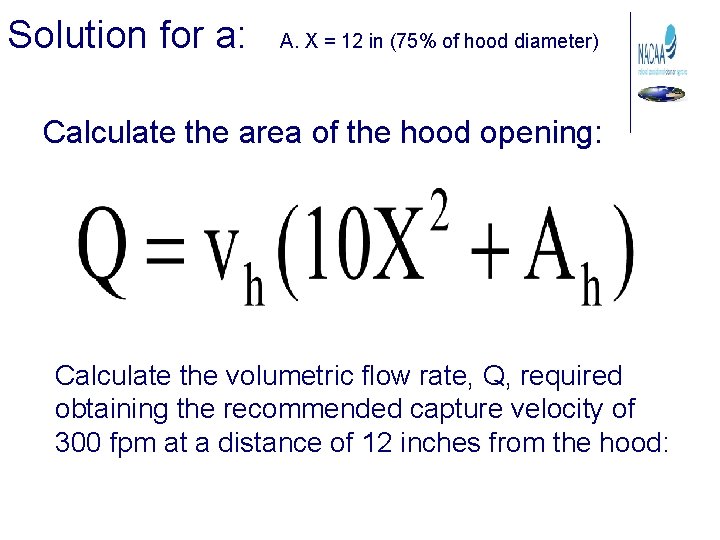
Solution for a: A. X = 12 in (75% of hood diameter) Calculate the area of the hood opening: Calculate the volumetric flow rate, Q, required obtaining the recommended capture velocity of 300 fpm at a distance of 12 inches from the hood:
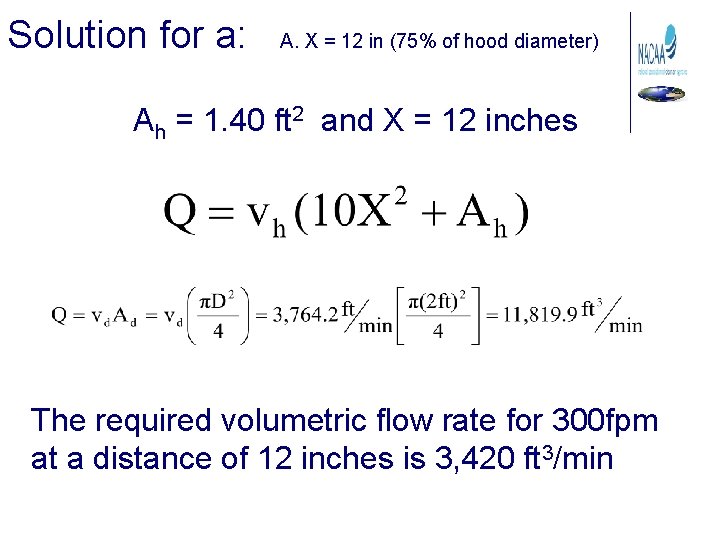
Solution for a: A. X = 12 in (75% of hood diameter) Ah = 1. 40 ft 2 and X = 12 inches The required volumetric flow rate for 300 fpm at a distance of 12 inches is 3, 420 ft 3/min
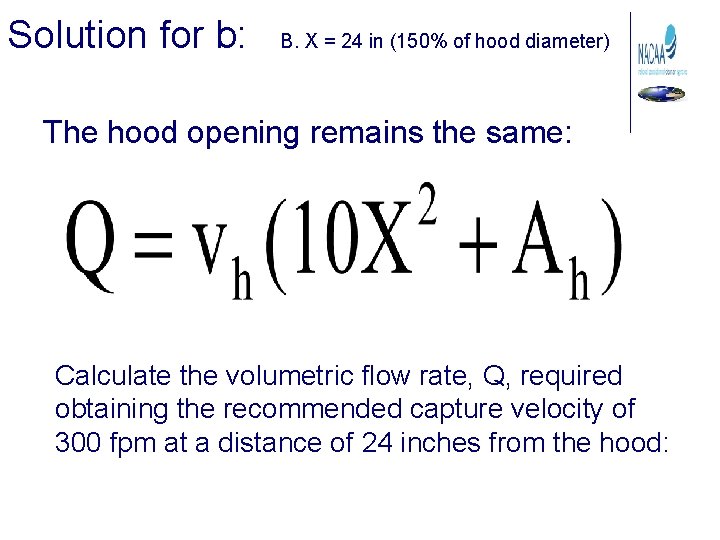
Solution for b: B. X = 24 in (150% of hood diameter) The hood opening remains the same: Calculate the volumetric flow rate, Q, required obtaining the recommended capture velocity of 300 fpm at a distance of 24 inches from the hood:
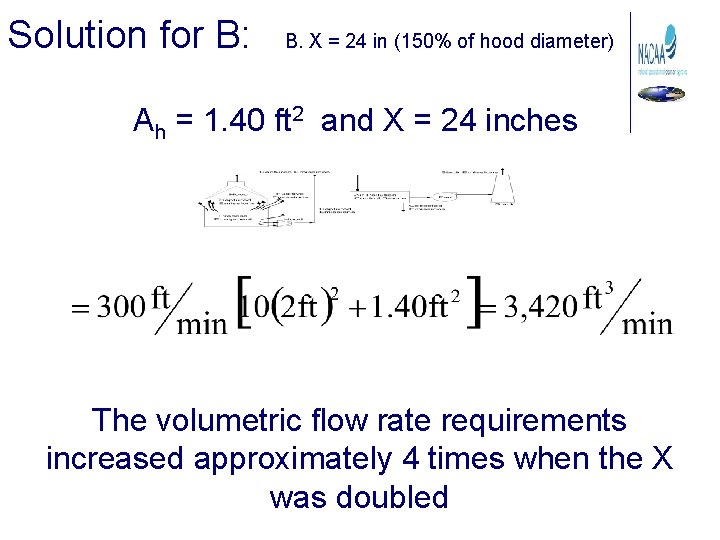
Solution for B: B. X = 24 in (150% of hood diameter) Ah = 1. 40 ft 2 and X = 24 inches The volumetric flow rate requirements increased approximately 4 times when the X was doubled
Hood Designs for Improved Performance • • Considerations for hot gas streams Use of Flanges Use of Side Baffles Other Designs
Added Side Baffles
Push Pull Hoods + good for use in open tanks and where access from the top is necessary. - Where cross drafts could increase quantities vaporized.
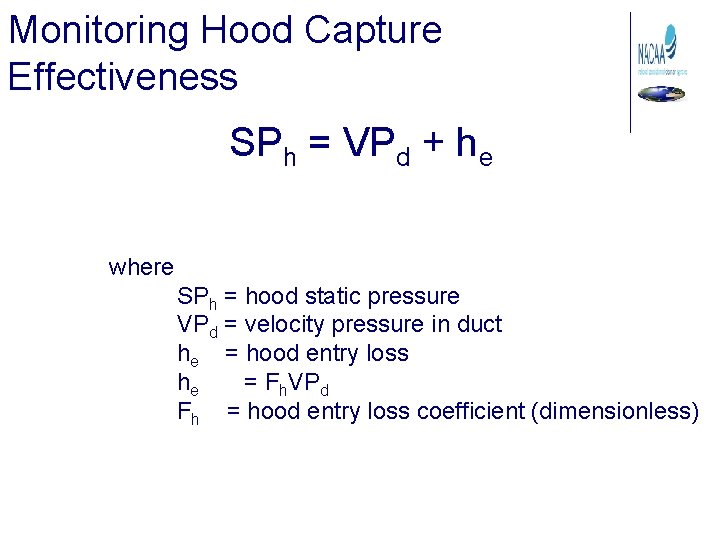
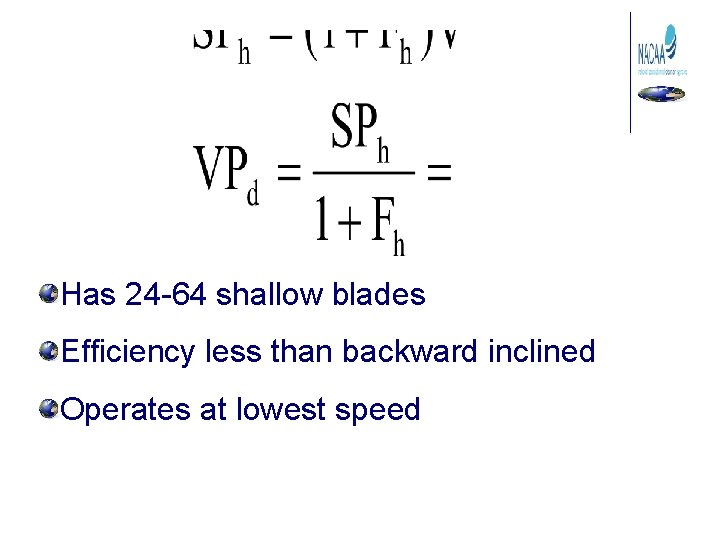
Monitoring Hood Capture Effectiveness SPh = VPd + he where SPh = hood static pressure VPd = velocity pressure in duct he = hood entry loss he = Fh. VPd Fh = hood entry loss coefficient (dimensionless)
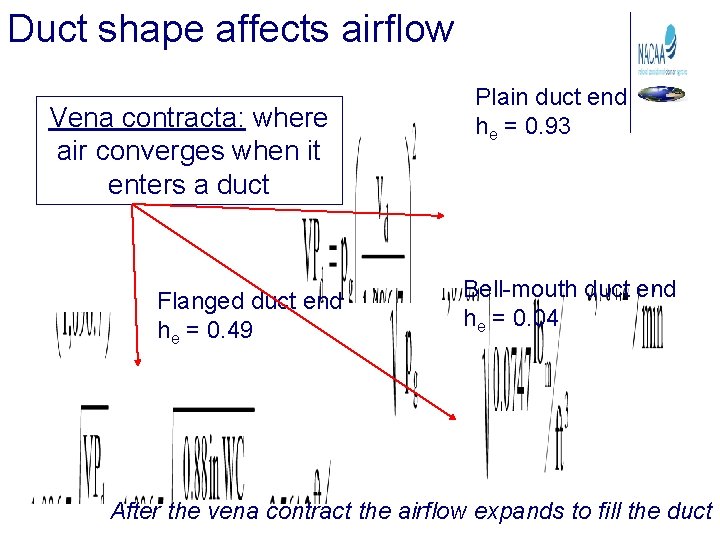
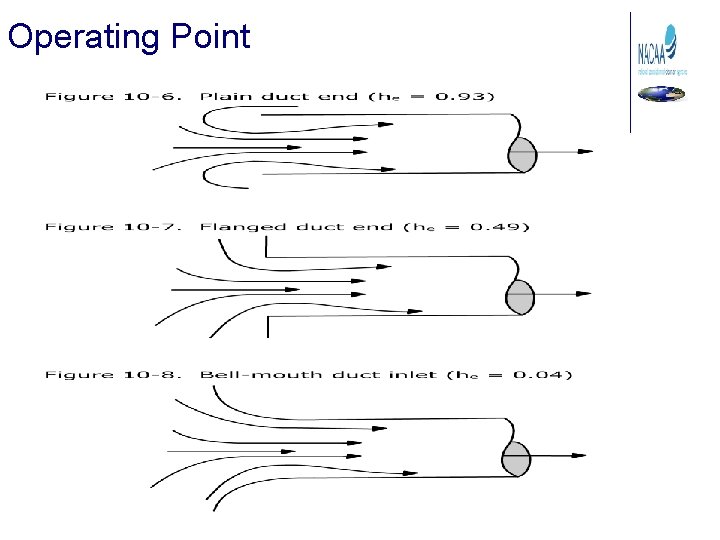
Duct shape affects airflow Vena contracta: where air converges when it enters a duct Flanged duct end he = 0. 49 Plain duct end he = 0. 93 Bell-mouth duct end he = 0. 04 After the vena contract the airflow expands to fill the duct
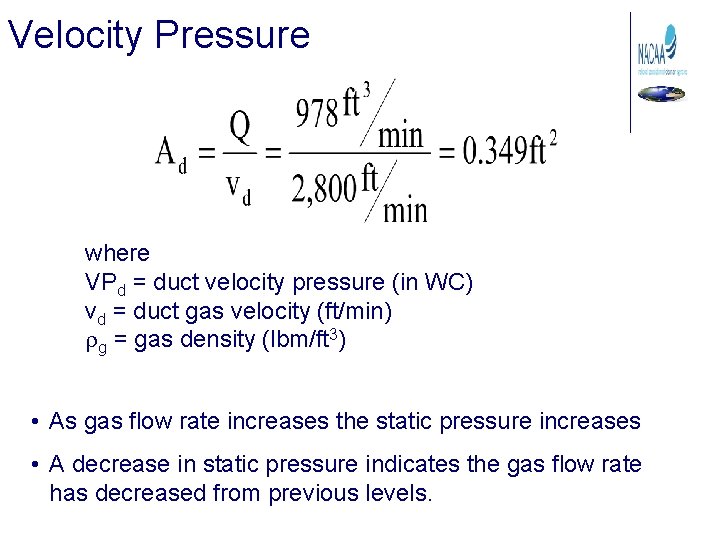
Velocity Pressure where VPd = duct velocity pressure (in WC) vd = duct gas velocity (ft/min) rg = gas density (lbm/ft 3) • As gas flow rate increases the static pressure increases • A decrease in static pressure indicates the gas flow rate has decreased from previous levels.
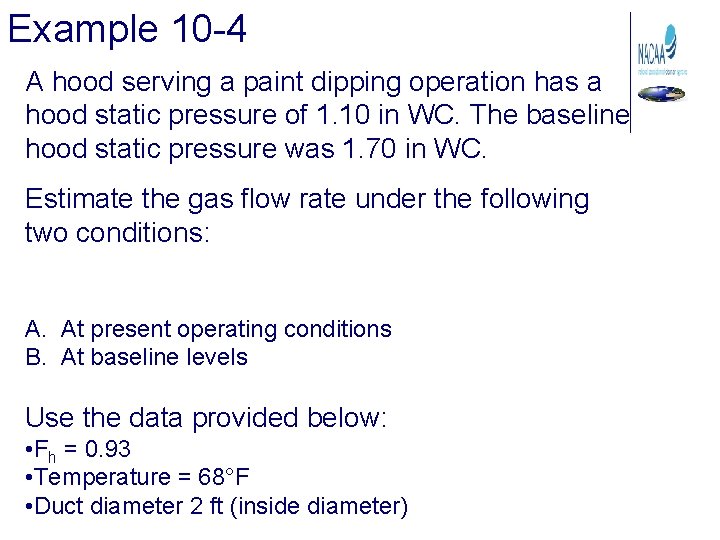
Example 10 -4 A hood serving a paint dipping operation has a hood static pressure of 1. 10 in WC. The baseline hood static pressure was 1. 70 in WC. Estimate the gas flow rate under the following two conditions: A. At present operating conditions B. At baseline levels Use the data provided below: • Fh = 0. 93 • Temperature = 68°F • Duct diameter 2 ft (inside diameter)
Example 10 -4 solution Calculate the velocity pressure in the duct: Fh = 0. 93 Temperature = 68°F Duct diameter 2 ft (inside diameter)
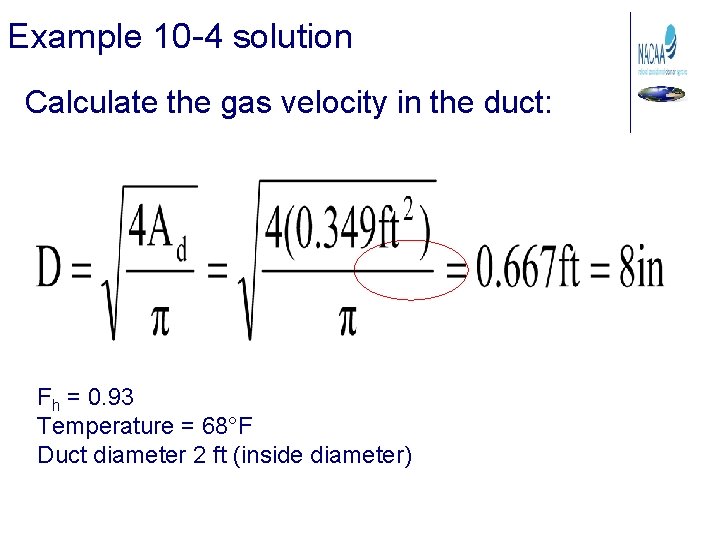
Example 10 -4 solution Calculate the gas velocity in the duct: Fh = 0. 93 Temperature = 68°F Duct diameter 2 ft (inside diameter)
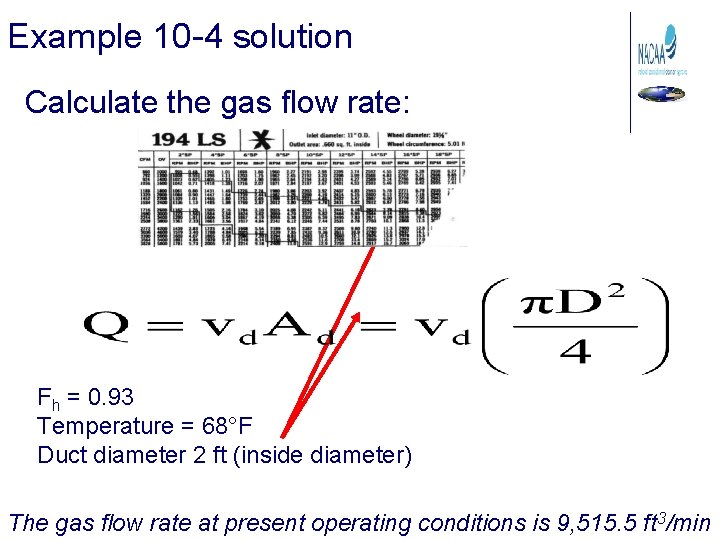
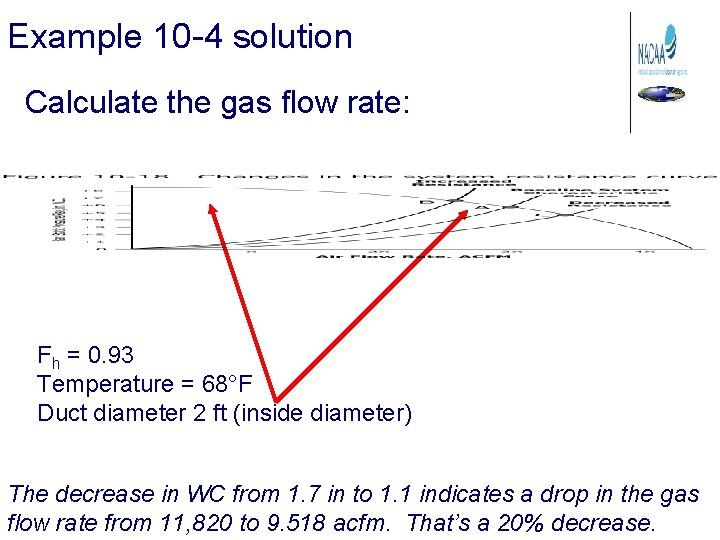
Example 10 -4 solution Calculate the gas flow rate: Fh = 0. 93 Temperature = 68°F Duct diameter 2 ft (inside diameter) The gas flow rate at present operating conditions is 9, 515. 5 ft 3/min
Example 10 -4 A hood serving a paint dipping operation has a hood static pressure of 1. 10 in WC. The baseline hood static pressure was 1. 70 in WC. Estimate the gas flow rate under the following two conditions: A. At present operating conditions B. At baseline levels Use the data provided below: • Fh = 0. 93 • Temperature = 68°F • Duct diameter 2 ft (inside diameter)
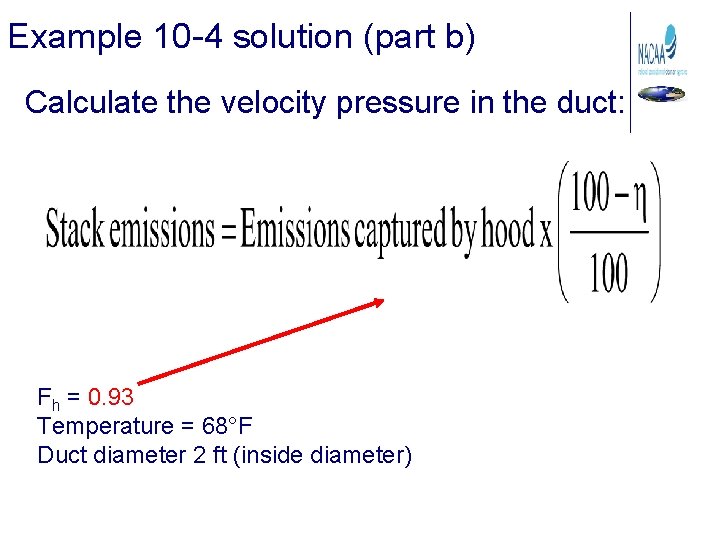
Example 10 -4 solution (part b) Calculate the velocity pressure in the duct: Fh = 0. 93 Temperature = 68°F Duct diameter 2 ft (inside diameter)
Example 10 -4 solution Calculate the gas velocity in the duct: Fh = 0. 93 Temperature = 68°F Duct diameter 2 ft (inside diameter)
Example 10 -4 solution Calculate the gas flow rate: Fh = 0. 93 Temperature = 68°F Duct diameter 2 ft (inside diameter) The decrease in WC from 1. 7 in to 1. 1 indicates a drop in the gas flow rate from 11, 820 to 9. 518 acfm. That’s a 20% decrease.
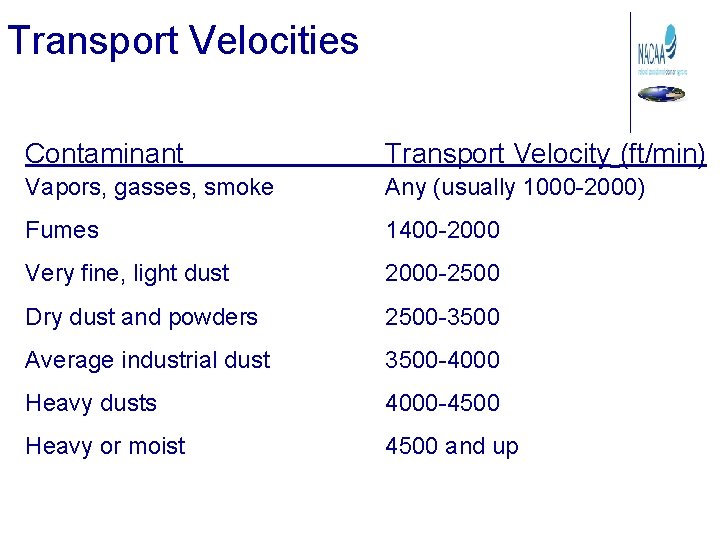
Transport Velocities Contaminant Transport Velocity (ft/min) Vapors, gasses, smoke Any (usually 1000 -2000) Fumes 1400 -2000 Very fine, light dust 2000 -2500 Dry dust and powders 2500 -3500 Average industrial dust 3500 -4000 Heavy dusts 4000 -4500 Heavy or moist 4500 and up
Calculating Duct Diameter A duct system transporting a dry dust requires a minimum transport velocity of 2, 800 ft/min. The volumetric flow rate for the system is 978 acfm. What is the necessary duct diameter in inches for this section of ductwork to maintain the minimum transport velocity?
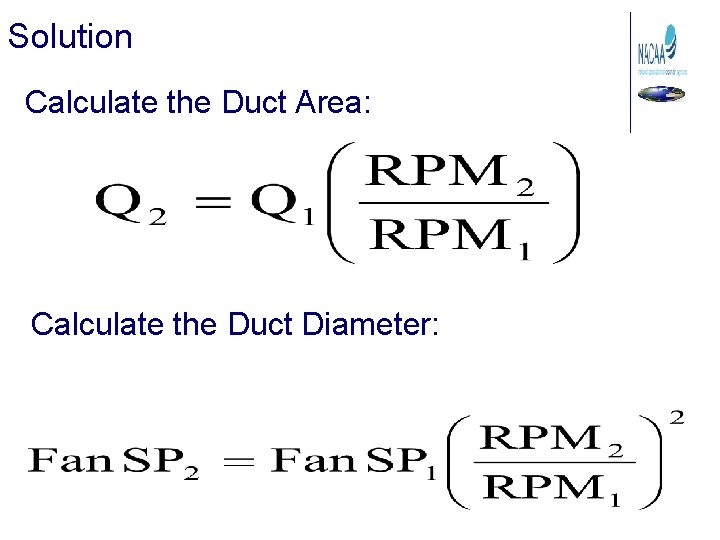
Solution Calculate the Duct Area: Calculate the Duct Diameter:
Fans
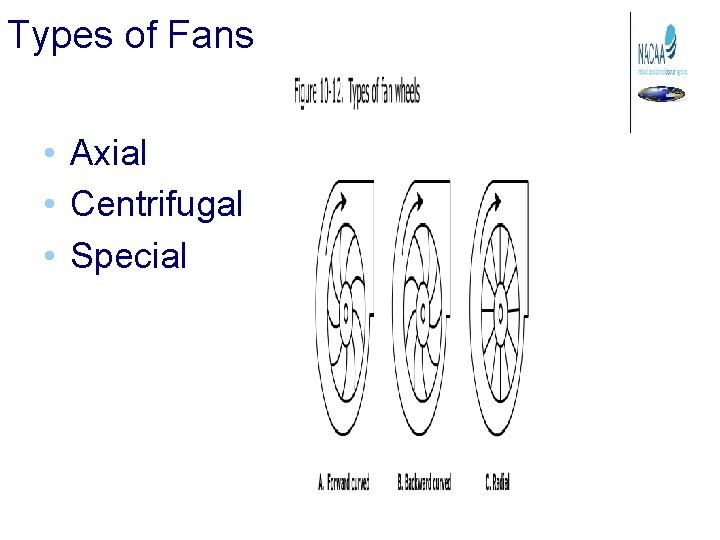
Types of Fans • Axial • Centrifugal • Special
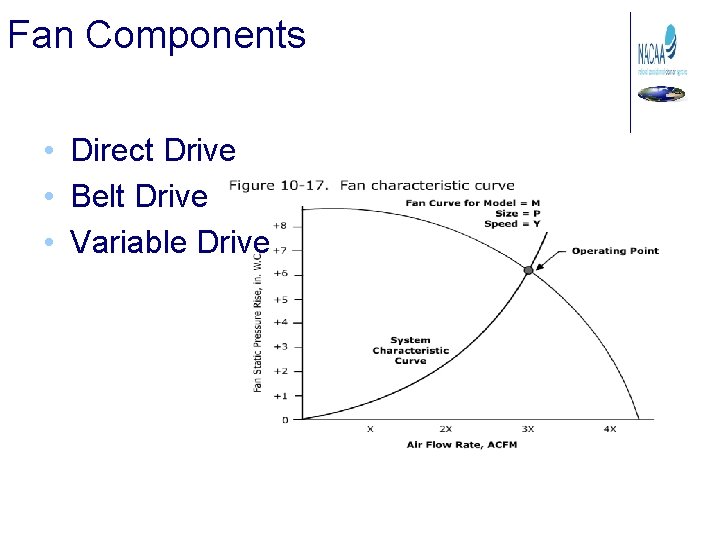
Fan Components • Direct Drive • Belt Drive • Variable Drive
Centrifugal Fan Wheels • Forward curved • Radial • Backward curved Standard blade Airfoil blade
Has 24 -64 shallow blades Efficiency less than backward inclined Operates at lowest speed
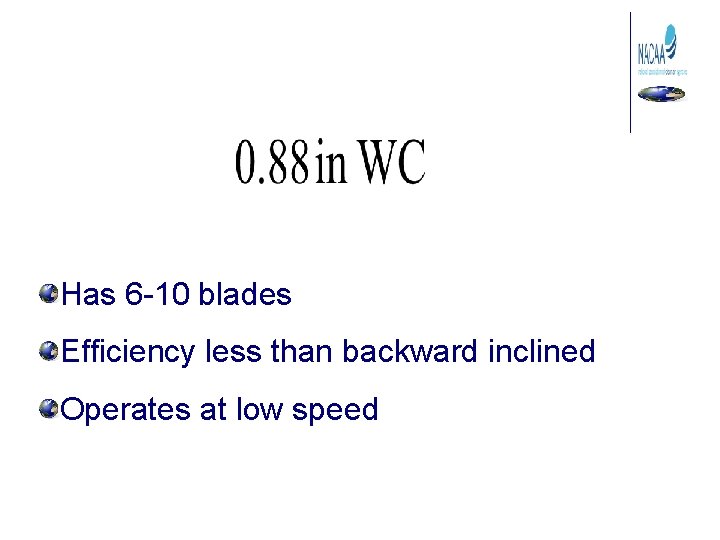
Has 6 -10 blades Efficiency less than backward inclined Operates at low speed
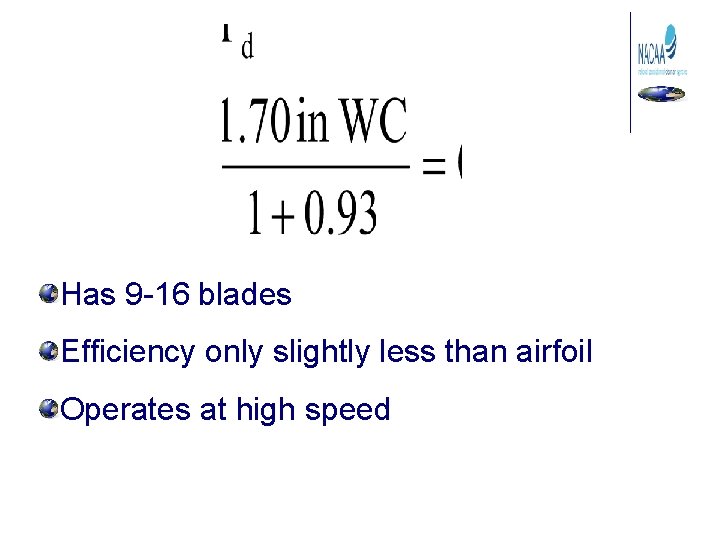
Has 9 -16 blades Efficiency only slightly less than airfoil Operates at high speed
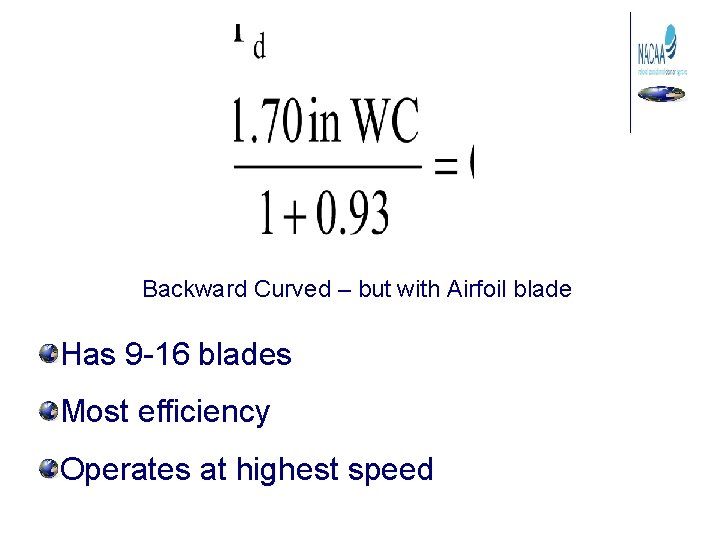
Backward Curved – but with Airfoil blade Has 9 -16 blades Most efficiency Operates at highest speed
Centrifugal Fans
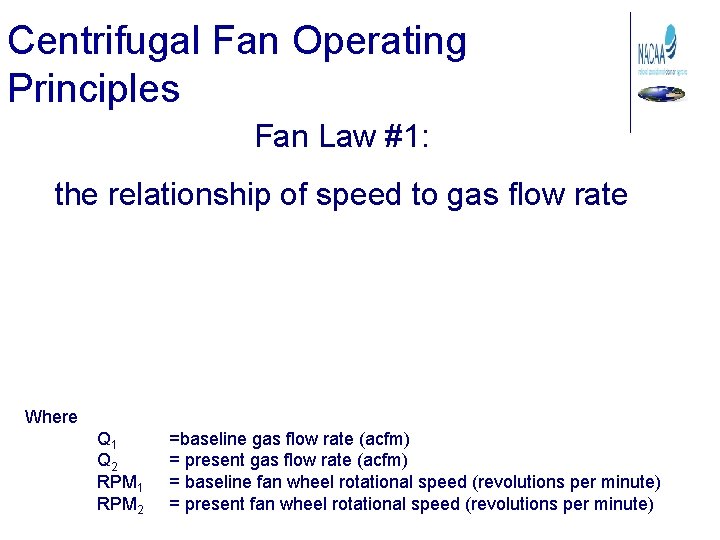
Centrifugal Fan Operating Principles Fan Law #1: the relationship of speed to gas flow rate Where Q 1 Q 2 RPM 1 RPM 2 =baseline gas flow rate (acfm) = present gas flow rate (acfm) = baseline fan wheel rotational speed (revolutions per minute) = present fan wheel rotational speed (revolutions per minute)
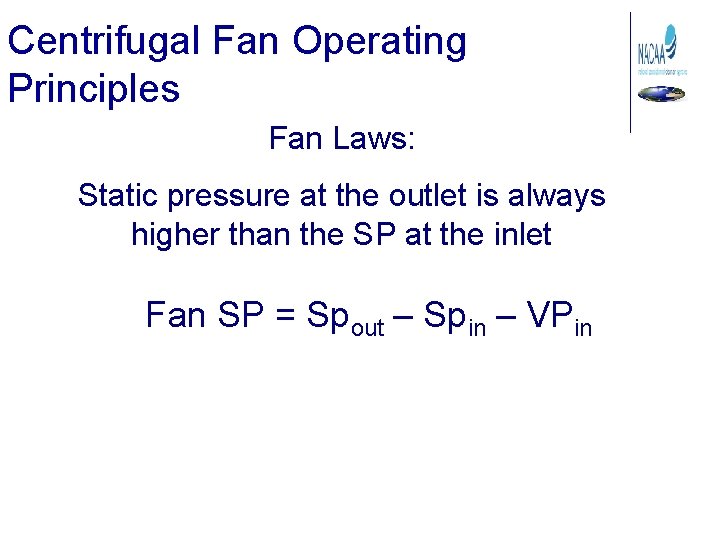
Centrifugal Fan Operating Principles Fan Laws: Static pressure at the outlet is always higher than the SP at the inlet Fan SP = Spout – Spin – VPin
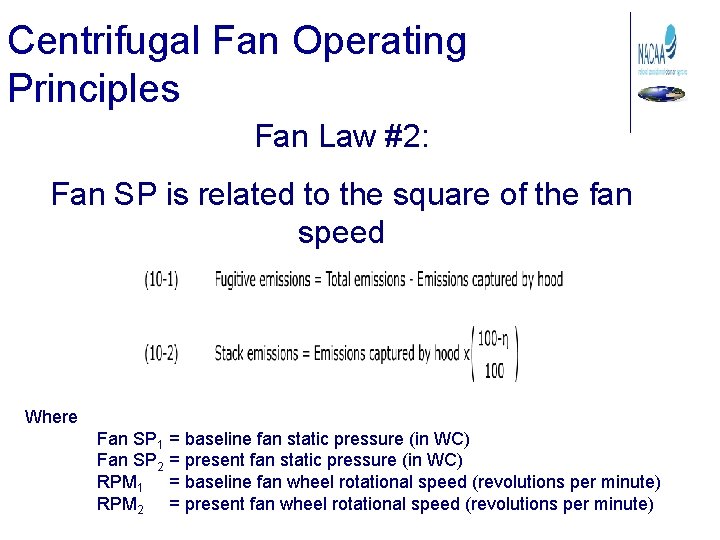
Centrifugal Fan Operating Principles Fan Law #2: Fan SP is related to the square of the fan speed Where Fan SP 1 = baseline fan static pressure (in WC) Fan SP 2 = present fan static pressure (in WC) RPM 1 = baseline fan wheel rotational speed (revolutions per minute) RPM 2 = present fan wheel rotational speed (revolutions per minute)
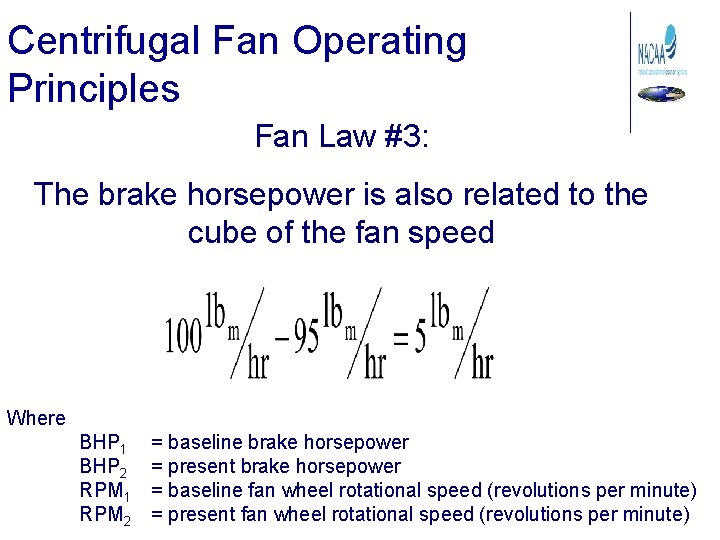
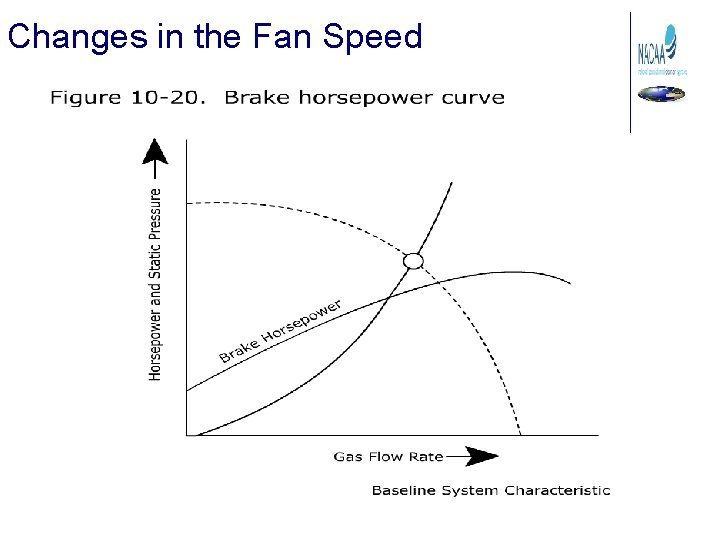
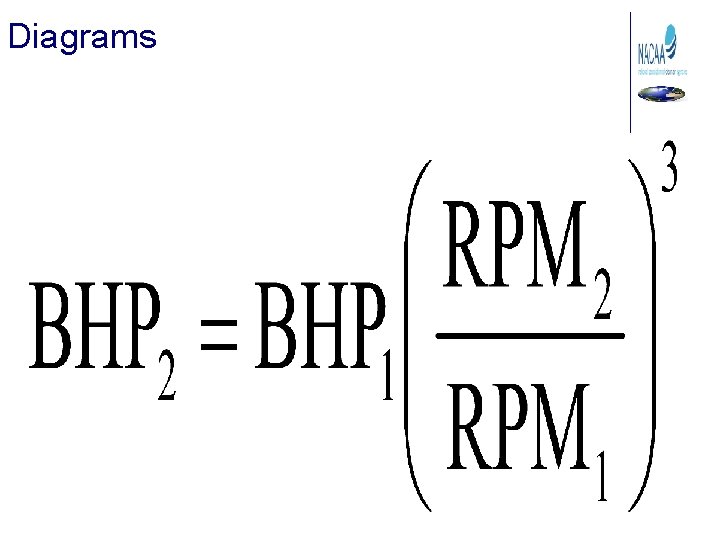
Centrifugal Fan Operating Principles Fan Law #3: The brake horsepower is also related to the cube of the fan speed Where BHP 1 BHP 2 RPM 1 RPM 2 = baseline brake horsepower = present brake horsepower = baseline fan wheel rotational speed (revolutions per minute) = present fan wheel rotational speed (revolutions per minute)
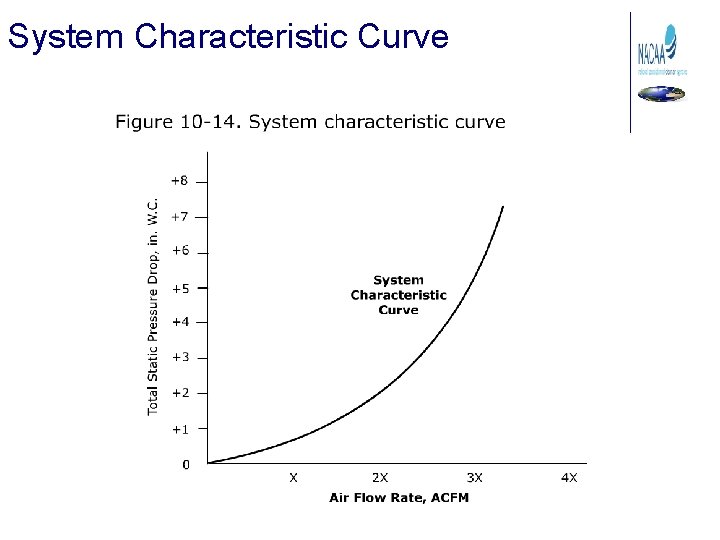
System Characteristic Curve
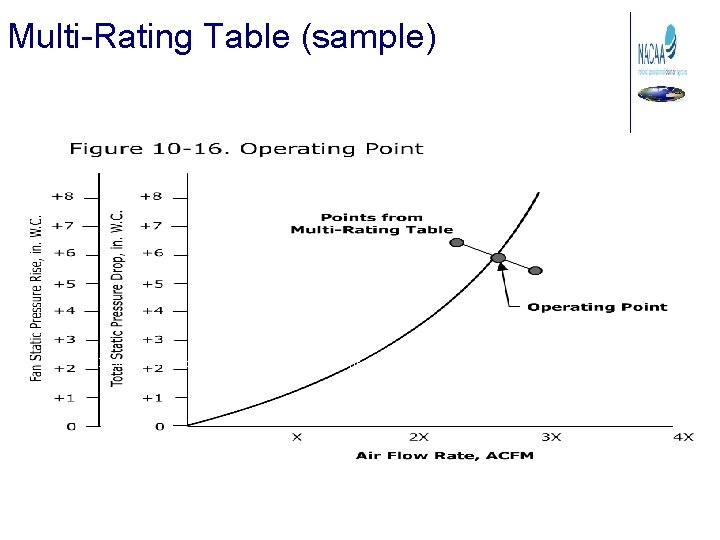
Multi-Rating Table (sample) Figure 10 -15. Portion of a typical multi-rating table (reprinted courtesy of The New York Blower Company)
Operating Point
Fan Curve
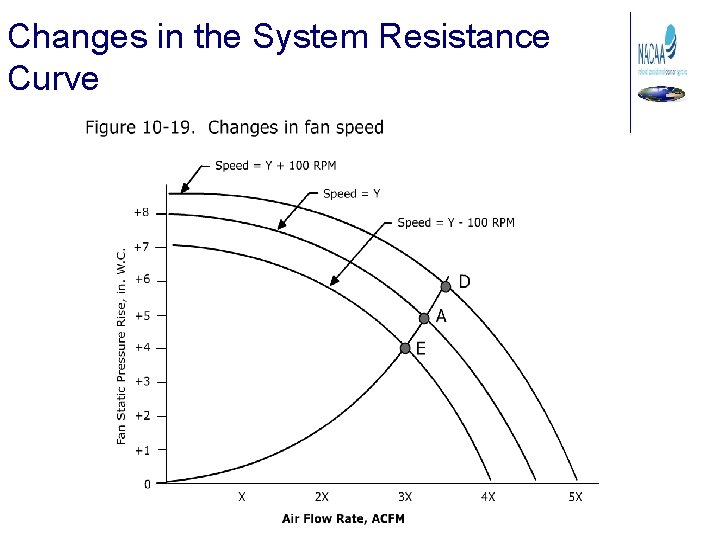
Changes in the System Resistance Curve
Changes in the Fan Speed
Brake Horsepower Curve
Evaluating the Entire Industrial Process Why evaluate the whole process? • Changes in the process equipment can have a major impact on the efficiency of the control device. • Changes in the air pollution control device can affect the ability of the process hoods to capture the pollutants at the point of generation. • The operating data from one unit in the system can be valuable in evaluating the operating conditions in another unit in the system. • Hoods and fans can influence the efficiency of the air pollution control equipment and the release of fugitive emissions from the process equipment.
Flowcharts How are Flowcharts Useful? • Evaluating process operating changes that are affecting control device performance • Identifying instruments that are not working properly • Identifying health and safety problems • Communicating effectively
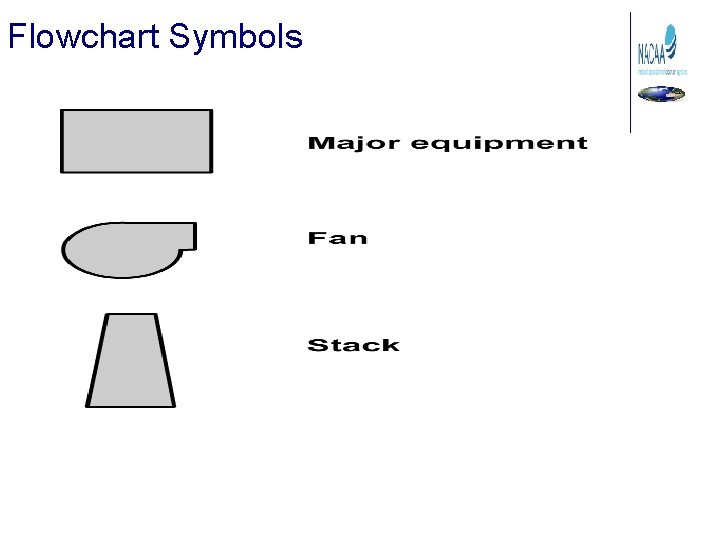
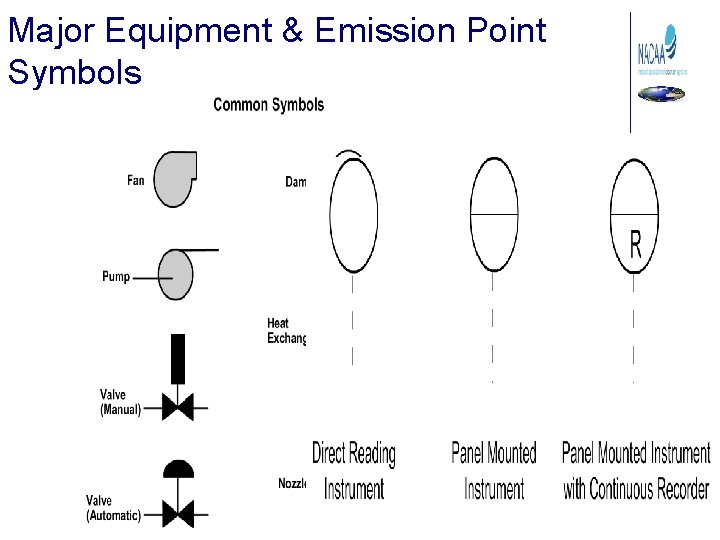
Flowchart Symbols
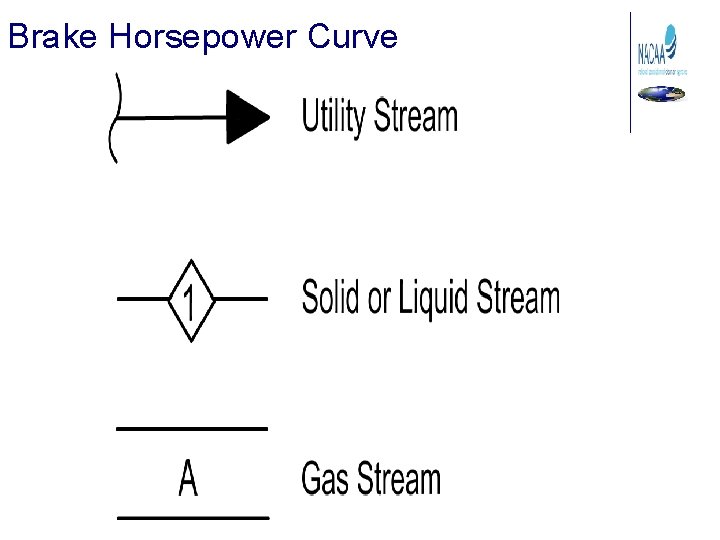
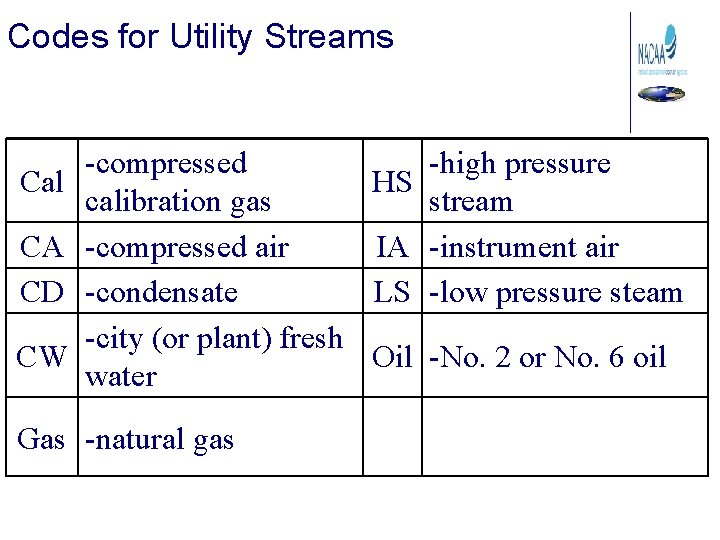
Codes for Utility Streams Cal CA CD CW -compressed -high pressure HS calibration gas stream -compressed air IA -instrument air -condensate LS -low pressure steam -city (or plant) fresh Oil -No. 2 or No. 6 oil water Gas -natural gas
Major Equipment & Emission Point Symbols
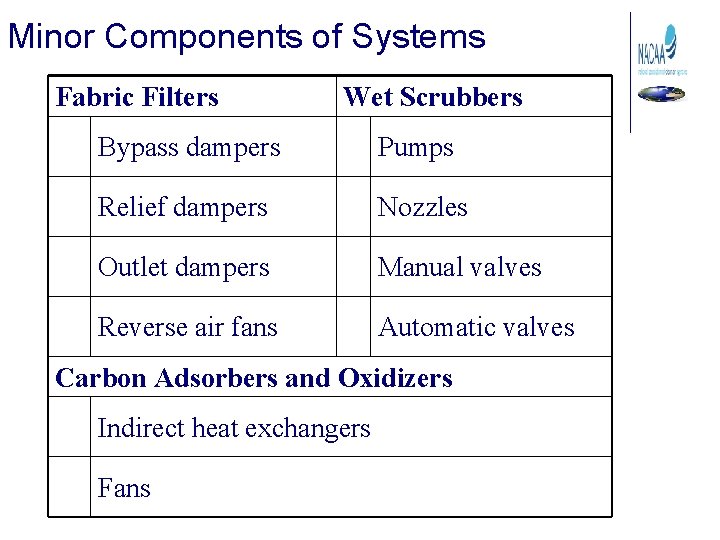
Minor Components of Systems Fabric Filters Wet Scrubbers Bypass dampers Pumps Relief dampers Nozzles Outlet dampers Manual valves Reverse air fans Automatic valves Carbon Adsorbers and Oxidizers Indirect heat exchangers Fans
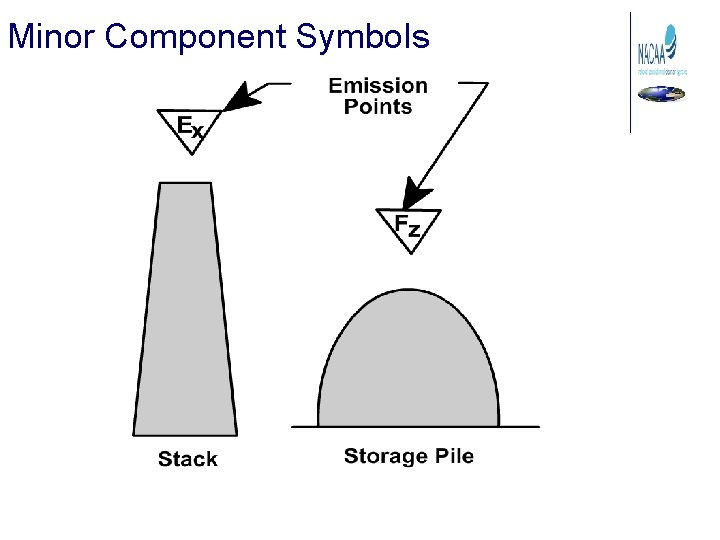
Minor Component Symbols
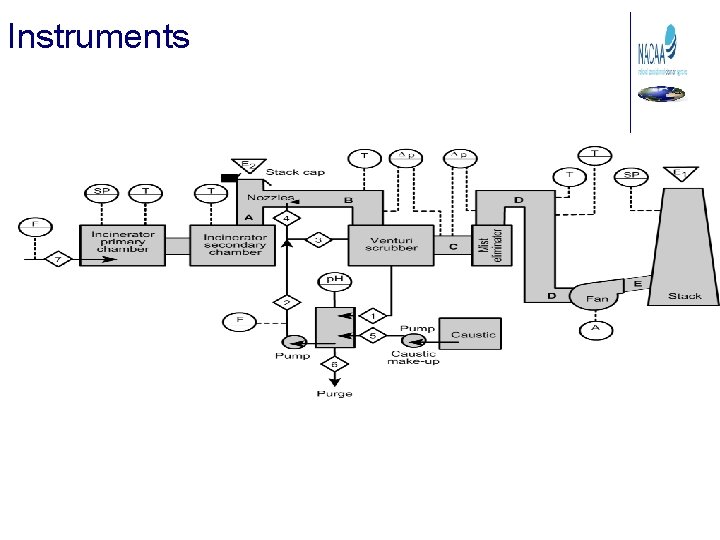
Instruments
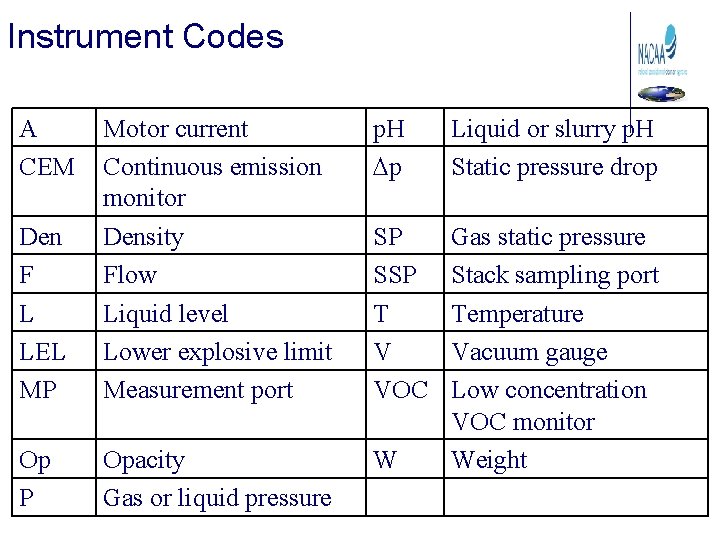
Instrument Codes A CEM p. H Dp Liquid or slurry p. H Static pressure drop Den F L LEL MP Motor current Continuous emission monitor Density Flow Liquid level Lower explosive limit Measurement port SP SSP T V VOC Op P Opacity Gas or liquid pressure W Gas static pressure Stack sampling port Temperature Vacuum gauge Low concentration VOC monitor Weight
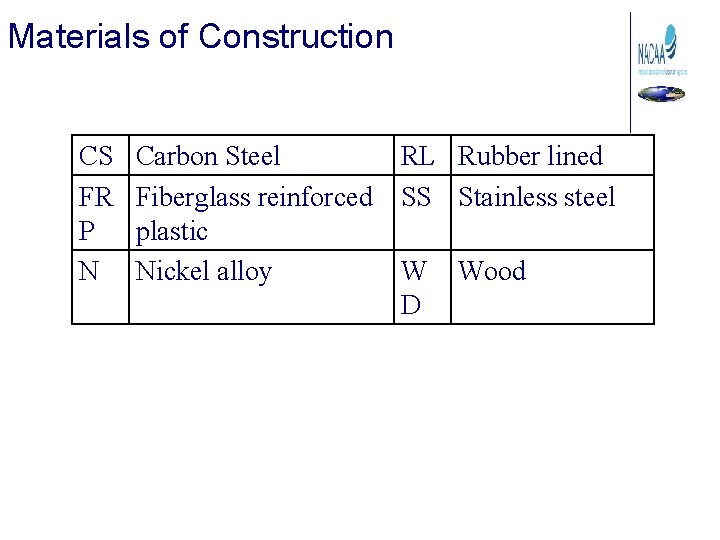
Materials of Construction CS FR P N Carbon Steel Fiberglass reinforced plastic Nickel alloy RL Rubber lined SS Stainless steel W D Wood
Diagrams
How diagrams help 1. Determine whether or not the operating data is consistent and logical. 2. Compare current data against sitespecific baseline data. 3. Determine specific areas that may need emphasis during the inspection. 4. Determine potential health and safety problems that may be encountered during the inspection.
Examples 10 -8 and 10 -9 Please review in your text
Flowcharts Summary • Identify changes in control device performance due to process changes • Identify instruments that are not consistent with other similar instruments in the system • Communicate effectively with other personnel • Avoid potential health and safety hazards