Chapter 10 Correlation and Regression Introduction Is there


 – horizontal axis • The one that can be controlled or")


- Slides: 21
Chapter 10: Correlation and Regression
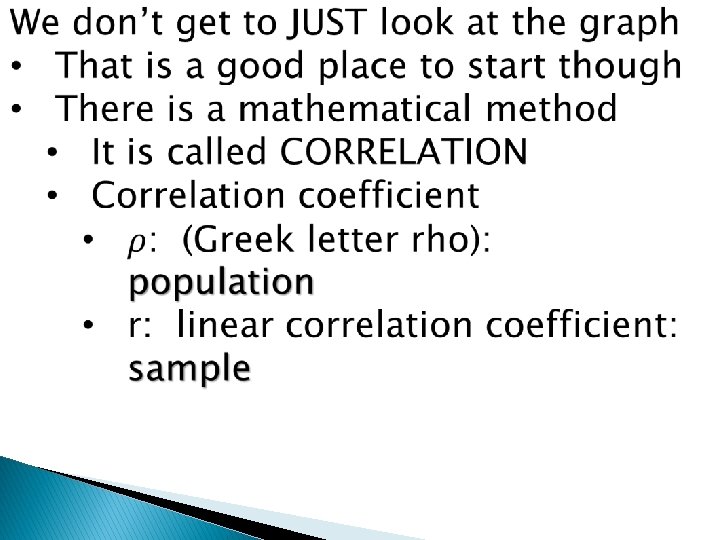
Introduction • Is there a RELATIONSHIP between two variables • You don’t just get to give your opinion • There is a mathematical method to determine • Ex’s: does crime rate increase when temp increases OR if you do more HW is your test grade better
To help determine IF they are related… • We look for linearity (do they form a straight line, or close to one) • OR…some other graphical relationship-parabolic, cubic, inverse, etc Once we determine if there is a relationship, we can make PREDICTIONS from that
10 -1: Scatter Plots and Correlation • Scatter plots – just a fancy name for a graph
Independent variable (x) – horizontal axis • The one that can be controlled or manipulated Dependent variable (y) – vertical axis • The one that varies because of what you (or someone/something else) did Student Number of absences x Final grade y (%) A 6 82 B 2 86 C 15 43 D 9 74 E 12 58 F 5 90 G 8 78
Let’s graph it… In this example, there APPEARS to be a negative linear relationship between the number of absences and the final grade, as a percentage, of the students.
Linear relationship – forms a line • Positive linear: slopes up to the right • Negative linear: slopes down to the right • Could be NO linear relationship (like c in the graphs above) • No relationship at all (like d in the graphs above)
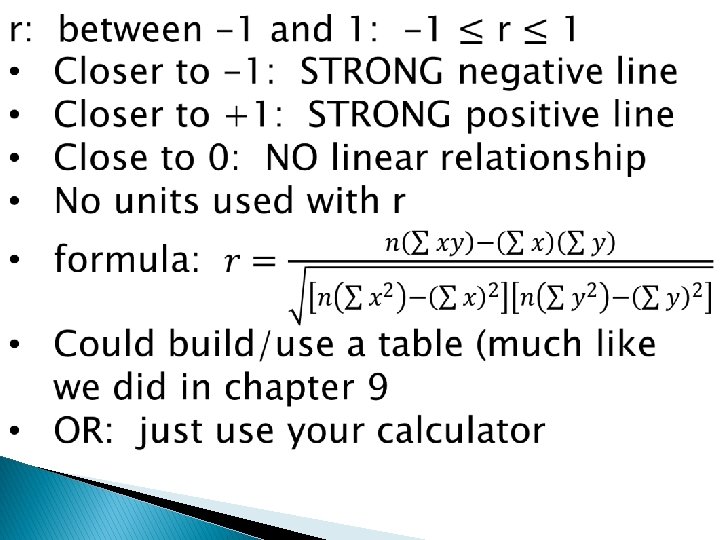
Let’s try one. (Use the data from earlier about number of absences and final grades. ) You may have to ‘turn on’ your diagnostic option in your catalog • L 1: x values • L 2: y values • If you would happen to flip them around, r would still be the same • r = -0. 944 • The value of r SUGGESTS a strong linear relationship. Now we need to check on that
Significance of the Correlation Coefficient • You and I would call this…just test it against a critical value (find it in a table) • Table I • Degrees of freedom: n-2 • I r I > CV: IS a significant linear correlation (SLC) • Could turn this in to a null, alternative, etc, but we are just going to keep it simple • What is the CV for our example?
IS a SLC, what are the possible relationships? • Direct cause-and-effect • Reverse cause-and-effect • May be a 3 rd variable that connects them that wasn’t considered • May be a complex relationship that exists • Relationship may be coincidental • For more on this…see p. 560
As 1. 2. 3. you start a problem… GRAPH IT – use appropriate #’s and labels Plot the points Use calculator to find r value:
10 -2: Regression • IF there is a SLC, then you find the equation of the line that connects the data • It is called the regression line or line of regression or least squares regression line: y’ • Values of y will be predicted from this equation • Equation is HUGE so instead we will use our calculators
Same screen…Lin. Reg: it is the a and b values that come up with the r and r 2 • Let’s put it all together with some new data • • School Number of Teachers Pupils per District (in thousands) Teacher 1 7 13. 4 2 34 10. 3 3 9 14. 3 4 8 15. 2 5 22 10. 3 6 15 12. 1 7 6 13. 3 8 14 12. 4 9 32 10 10 18. 4 Find r Find CV Is there an SLC? Find y’ = ax + b and make calc draw graph • Do you need some steps written down
Zoom. STAT – helps adjust your screen Use your line of regression to predict… • If x = 12, what is y’? • 13. 7 students/teacher • Works BEST if we predict within the range of data values • FUTURE values can work or can be off • Depends on what changes – oil running out in 2003? ?
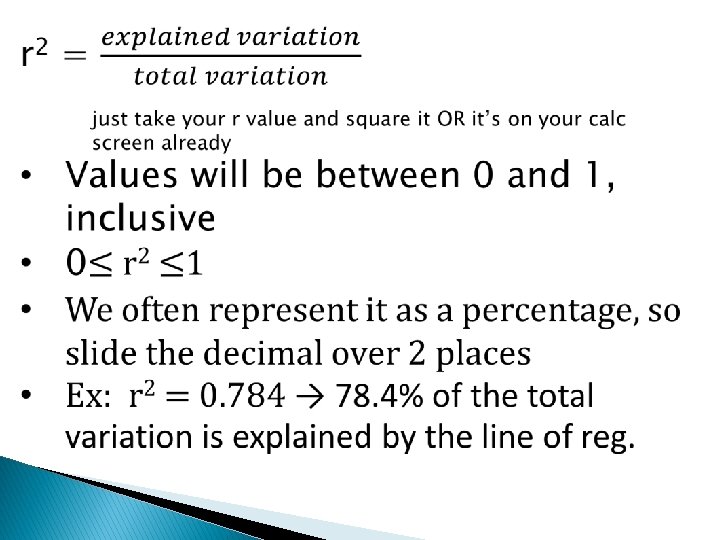
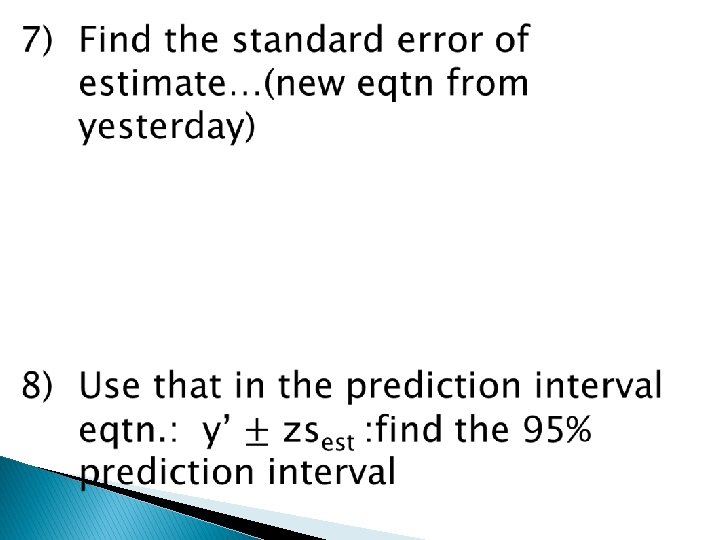
10 -3: Coefficient of Determination and Standard Error of the Estimate • Coefficient of determination: a measure of the variation of the dependent variable that is explained by the line of regression and the independent variable. • It is a ratio of the explained variation to the total variation. • All of that is a fancy way of saying it is equal to r 2.
Let’s try one from start to finish together… Ex: A researcher wishes to determine whether a person’s age is related to the number of hours he or she jogs per week. The data is as follows… AGE, X 34 22 48 56 62 Hours, Y 5. 5 7 3. 5 3 1 1) Find r 2) Determine CV 3) Is there SLC, yes or no? 4) If no…done, If yes then find y’ 5) Predict y’ when someone’s age is 52. 6) Find the percent of total variation, r 2.