CHAPTER 10 13 Correlation and Regression Regression The


 b) c) d) If the regression line is y=5+3 x, then")

- Slides: 15
CHAPTER 10 & 13 Correlation and Regression
Regression
The purpose of the regression line: 1. To determine the relationship between variables if it is positive or negative. 2. To make prediction on the basis of data.
q If the value of the correlation coefficient is significant, the next step is to determine the equation of the regression line which is the data’s line of best fit.
q Best fit means that the sum of the squares of the vertical distance from each point to the line is at a minimum.
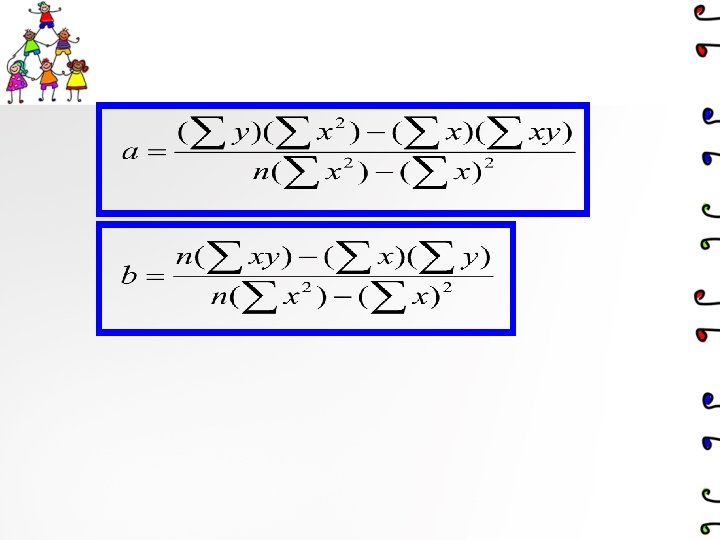
Regression Line Equation Dependent Var. Y intercept slope Independent Var.
: Example 10 -9 Find the equation of the regression line for the data in Example 10 – 4, and graph the line on the scatter plot. Σx = 153. 8, Σy 2 = 80. 67, Solution : Σy = 18. 7, n=6 Σxy = 682. 77, Σx 2 = 5859. 26,
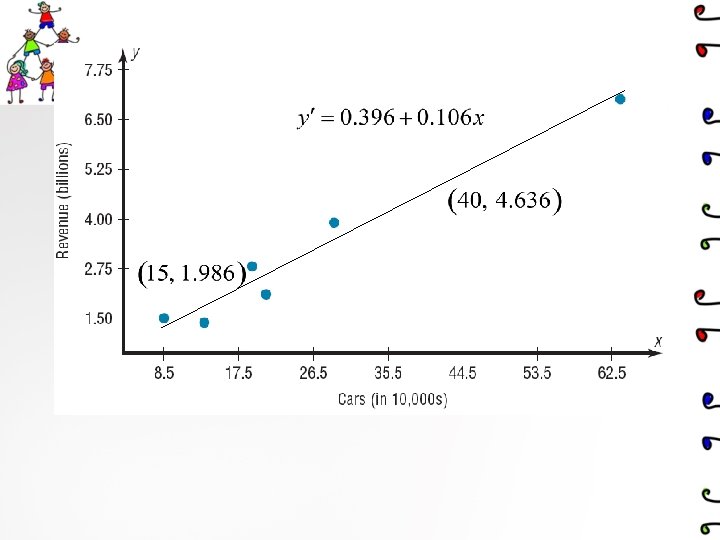
q Find two points to sketch the graph of the regression line. Use any x values between 10 and 60. For example, let x equal 15 and 40. Substitute in the equation and find the corresponding y value. Plot (15, 1. 986) and (40, 4. 636), and sketch the resulting line.
Example 10 -10: Find the equation of the regression line for the data in Example 10– 5, and graph the line on the scatter plot. Σx = 57, Σy = 511, Solution : Σxy = 3745, Σx 2 = 579, n=7
Example 10 -11: Use the equation of the regression line to predict the income of a car rental agency that has 200, 000 automobiles x = 20 corresponds to 200, 000 automobiles. Hence, when a rental agency has 200, 000 automobiles, its revenue will be approximately $2. 516 billion.
Correlation and Regression v. The sign of the correlation coefficient and the sign of the slope of the regression line will always be the same. Correlation Regression If r is positive b will be psitive If r is negative b will be negative
Exercises: • a) b) c) d) If the regression line is y=5+3 x, then the correlation coefficient ( r ) is …………… Positive Negative Zero None of the above ANS. A • a) b) c) d) If the equation of the regression line is y=102. 49 -3. 62 x. When x=2 then y is : -95. 25 102. 48 0. 94 ANS. B
• The equation of the regression line between the age of a car in years(x) and its price (y); is given by: Y=65. 3 -9. 25 x The correct statement to represent this equation is : a) When the age of the car increases by one year the price of it decreases by (65. 3) Riyals on average. b) When the price of the car increases by one Riyals the age of the car decreases by (9. 25) years on average. c) When the age of the car increases by one year the price of it decreases by (9. 25). d) When the price of the car increases by one Riyals the age of the car decreases by (65. 3) on average ANS. C