Chapter 1 Why Study Statistics What is Statistics


 What is your aim? Identify/define a problem & describe")
 Collect Data: Sampling In finance, business, economics or any other area of concern")


 Parameter v. s. Sample Statistics Parameter = It is a specific characteristic of")

 Consider the population of Massachusetts in 2010, which")
 Analyze and Interpret the data: Descriptive & Inferential Statistics Descriptive Statistics: Describe and")
Classification of Variables: *Categorical/Numerical *Measurement Levels 2)")
Classification of Variables: *Categorical/Numerical Characteristic of Data Set: Variable: A characteristic that can take")
 • • Measurement is the process of assigning a number value to")
 Variable may be scaled as “interval” or “ratio” Example 1: Interval")


 : It is")


- Slides: 26
Chapter 1: Why Study Statistics? What is Statistics Science? : *The set of methodologies for (Collecting + Presenting+ Processing + Analyzing + Interpreting) of DATA related to your problem *Decision Making in an Uncertain Environment ----------------------------------------------------Data: A data set is a collection of facts assembled for a particular purpose. Examples: Data sets are available everywhere ! On TV, newspaper, online… *Financial section of daily newspaper contains price for securities, commodities or currencies (Exchange rates) Go “financial times” websites: www. ft. com and click on “Market Data” *Economic report shows inflation rates for different countries Go “European Central Bank website to see long term interest rates for EU countries: http: //www. ecb. int/stats/money/long/html/index. en. html *Your phone booklet is a data set that contains names, addresses and tel. nos What else can be example for data set?
Source: Strategy Development Headship, Ministry of Finance Turkey. Friday, September 16, 2011 GÜNLÜK PİYASA BİLGİLERİ (DAILY MARKET INFORMATION) 2002 2010 31 Dec 2002 31 Dec 2009 2010 İMKB: İMKB 100 Endeksi - Kapanış İMKB İşlem Hacmi (Milyon TL) KURLAR: DOLAR/TL (Serbest Piyasa Alış, Kapanış) EURO/TL (Serbest Piyasa Alış, Kapanış) Parite (Euro/Dolar) Döviz Sepeti (1$ + 0. 77€) İKİNCİL PİYASALARDA DİBS FAİZİ (Yıllık, bileşik, %) Gösterge Tahvil Faiz Oranı* HAM PETROL, ALTIN: Ham Petrol Fiyatı (Ipe Brent 1 varil=dolar) 1 Ons Altın Fiyatı (Dolar) HALKBA NK PETKİM THY TELEKO M TÜPRAŞ Piyasa Değerleri (Bin TL) (Bin Dolar) Cuma 9 Sep 2011 Perşembe 15 Sep 2011 Cuma 16 Sep 2011 Değişim % 20022010 20092010 Yıllık Haftalık Günlük 10, 370 52, 825 66, 004 55, 903 57, 116 57, 897 536. 5 24. 9 -14. 2 3. 6 1. 4 193 2, 614 2, 223 2, 029 1, 957 1, 785 1053. 9 -14. 9 -10. 0 -12. 0 -8. 8 1. 6345 1. 4970 1. 5420 1. 7870 1. 7810 1. 7780 -5. 7 3. 0 14. 8 -0. 5 -0. 2 1. 7035 2. 1480 2. 0610 2. 4560 2. 4640 2. 4580 21. 0 -4. 1 17. 7 0. 1 -0. 2 1. 0422 1. 4349 1. 3366 1. 3744 1. 3835 1. 3825 28. 2 -6. 9 2. 5 0. 6 -0. 1 2. 9462 3. 1510 3. 1290 3. 6781 3. 6783 3. 6707 6. 2 -0. 7 16. 3 -0. 2 62. 70 8. 87 7. 08 7. 86 8. 18 8. 09 -20. 2 12. 6 2. 9 -1. 1 28. 70 78. 00 92. 50 112. 05 115. 08 113. 66 222. 3 18. 6 21. 2 1. 4 -1. 2 1, 096. 35 1, 413. 94 1, 844. 99 1, 776. 70 1, 793. 34 307. 8 29. 0 28. 3 -2. 8 0. 9 160. 813 115. 375 171. 875 125. 938 171. 375 126. 375 169. 688 125. 000 169. 563 125. 250 6. 9 9. 2 -1. 1 -0. 8 -1. 1 -0. 9 -0. 1 0. 2 346. 70 EUROBOND'LAR: 2030 vadeli Global Tahvil (TRGLB 30) 2034 vadeli Global Tahvil (TRGLB 34) Şirketler 2009 -88. 7 13, 437, 500 7, 749, 423 - 11. 90 13. 10 11. 05 11. 75 11. 85 10. 1 -13. 7 7. 2 0. 9 450, 450 479, 500 259, 775 276, 528 - 7. 30 5. 70 2. 38 5. 40 2. 25 2. 62 2. 30 2. 77 2. 34 2. 80 -67. 4 -5. 3 -2. 9 -48. 0 4. 0 6. 9 1. 7 1. 1 24, 150, 000 13, 927, 336 - 4. 56 6. 50 8. 12 8. 18 8. 14 42. 5 27. 1 0. 2 -0. 5 8, 639, 462 4, 982, 389 - 29. 75 38. 60 34. 50 34. 80 35. 80 29. 7 -11. 9 3. 8 2. 9
What do you do when you have very well processed analyzed data? You make decisions depending on information and knowledge obtained from data! Examples: • Portfolio Choice: Make investment on specific security or specific government bond • Other examples of “decision making” ? For manufacturing company or for daily life…? (before you buy a new laptop, what do you do ? ) All of your decisions would be right, if there would not be any ……………. . UNCERTAINTY! Uncertainty = Risk Examples: *Financial Market: Long Term Capital Investment- 1998 Russian Crises; Mortgage Crisis-2008: continues Long-Term Capital Management (LTCM) was a hedge fund founded in 1994 by John Meriwether (the former vice-chairman and head of bond trading at Salomon Brothers). On its board of directors were Myron Scholes and Robert C. Merton, who shared the 1997 Nobel Memorial Prize in Economics. Initially enormously successful with annualized returns of over 40% in its first years, in 1998 it lost $4. 6 billion in less than four months and became the most prominent example of the risk potential in the hedge fund industry. The fund folded in early 2000. (source http: //en. wikipedia. org) *Daily life: Score of Besiktas vs Ankaragucu football game.
Steps in Statistical Analysis: 1) What is your aim? Identify/define a problem & describe the population related to your question & decide on data that you should collect. Population = The complete set of all items about which information is desired. N= Population size, can be very large or even infinite Example 1: Question: What are the effects of age on the amount of food expenditures in Turkey? Population: All Turkish citizens Data Needed (characteristics of concern): All Turkish citizens’ age and their expenditures on food Example 2: Question: What is the average price of stocks traded on New York Stock Exchange(or IMKB)? Population: All stocks traded on New York Stock Exchange (on IMKB). Data Needed (characteristics of concern): Price of all stocks traded on New York Stock Exchange (on IMKB) Example 3: ? ? Question: Population: Data Needed (characteristics of concern):
2) Collect Data: Sampling In finance, business, economics or any other area of concern it is usually impossible to access entire population data, mainly because of money and time restrictions. Sample = It is an observed SUBSET of POPULATION. n= Sample size such that n< N Random Sampling = The procedure to select “n” objects from the population “N” with equal chance (probability) of selection for each member of the population. Random Sample = The sample chosen by random sampling. Illustration of Idea of Sampling: A biologist to analyze the cholesterol, the level of vitamins and diagnosis of some illness uses only 1 drop of blood. This one drop includes all information about your entire body. This is the idea of sampling!! When to access the entire population is impossible we take an representative (sample) of it and make inferences about all population depending on this sample.
• Here’s a basic example of how to get a simple random sample: put 100 numbered bingo balls into a bowl (this is the population N). Select 10 balls from the bowl without looking (this is your sample n). Note that it’s important not to look as you could (unknowingly) bias the sample. While the “lottery bowl” method can work fine for smaller populations, in reality you’ll be dealing with much larger populations. http: //www. statisticshowto. com/simple-random-sample/
Examples of sample • We wish to estimate the percentage of defective parts produced in a factory during a given week (5 days) by examining 20 parts produced per day. • The parts will be examined each day at randomly chosen times. • In this case “all parts produced during the week” is the population and the (100) selected parts for 5 days constitutes a sample.
• Other common examples of sample and population are: • Political polls: The population will be all voters, whereas the sample will be the subset of voters we poll. • Laboratory experiment: The population will be all the data we could have collected if we were to repeat the experiment a large number of times (infinite number of times) under the same conditions, whereas the sample will be the data actually collected by the one experiment.
3) Parameter v. s. Sample Statistics Parameter = It is a specific characteristic of population like mean, variance, standard deviation (Chap. 3) Sample Statistics = It is a specific characteristic of sample Example 1 a: Question: What is the average price of stocks traded on New York Stock Exchange? Population: All stocks traded on New York Stock Exchange. Data Needed: Price of all stocks traded on New York Stock Exchange Population Parameter: mean of all stock prices Sample: 500 stocks traded Data Collected: Price for 500 stocks Sample Statistics: S&P 500 (weighted average of 500 stocks, sample mean), see web site: http: //www. streetauthority. com/terms/index/sp 500. asp for definition of S&P 500. or Nasdaq 100 weighted average of 100 stocks Example 1 b: Sample Statistics: İMKB national 100 index. http: //finans. milliyet. com. tr/
Example 2: Question: What is the average of registered voters in Turkey? ** Lets assume there are 8 registered voters (for illustration purpose ); and government provided budget for survey which is only enough to interview with 4 of them. POPULATION Population Units Population Unit: A registered voter in Turkey (8 people) Sample Unit: A registered voter in Turkey (4 people) chosen by random sampling Data Age, in years Numerical Characteristi c of Interest (Information) Population Parameter: Population mean Sample Statistic: Sample Mean Note: Different samples may result different sample means. Some element of uncertainty will always remain around sample mean, however, population mean is constant and definite. Voters No Name Age 1 Ayşe 35 2 Mehmet 56 3 Ahmet 19 4 Kuzey 65 5 Güney 48 6 Fatma 25 7 Selen 43 8 Cansu 45 Population Mean 42 SAMPLE 1 SAMPLE 2 Voters Name Age 3 Ahmet 19 2 Mehmet 56 5 Güney 48 8 Cansu 45 7 Selen 43 4 Kuzey 65 1 Ayşe 35 6 Fatma 25 Sample mean 1 36. 25 Sample mean 2 47. 75
Example 3 (the Framingham Heart Study) Consider the population of Massachusetts in 2010, which consisted of 6, 547, 629 persons. One characteristic (or variable) of potential interest might be the diastolic blood pressure of the population. We will focus on the mean diastolic blood pressure of all people living in Massachusetts. It is obviously not feasible to measure and record blood pressures for of all the residents, but one could take samples of the population in order estimate the population's mean diastolic blood pressure. Question: ? Population: ? Data Needed: ? the Framingham Heart Study Population Parameter: ? Population Size: ? ? ? Sample: ? Data Collected: ? Sample Statistics : ? Sample Size: ? ? ?
4) Analyze and Interpret the data: Descriptive & Inferential Statistics Descriptive Statistics: Describe and summarize data by graphical (Chap. 2) and numerical (Chap. 3) procedures to achieve information from data. Inferential Statistics: Go beyond sample data! Make inferences (ANLAM ÇIKARTMA) about the population. Inferential statistics is a process which may include: estimation of a populatin parameter / hypothesis testing/ analysis of relationship/ forecasting By statistical inference we transform information into knowledge! 5) Make decision under Uncertainty Environment depending on the Information and Knowledge that obtained through statistical analysis. Uncertainty = Risk Statistics involves probability of occurrence for each events. Even the extreme events, very good or bad ones, may occur even with low probability of occurrence.
Chapter 2 Describing Data: Graphical Methods Outline: 1)Classification of Variables: *Categorical/Numerical *Measurement Levels 2) Graphs to Describe Categorical Variables 3) Graphs to Describe Time-Series Data
1)Classification of Variables: *Categorical/Numerical Characteristic of Data Set: Variable: A characteristic that can take different possible outcomes is called as “variable”. Variables in Table : ? Case name class 1 Ayşe Can 1 st year Categorical (=Qualitative) Variable: If the outcomes are nonnumerical qualities or attributes. Categorical Variables in Table : ? 2 Numerical (= Quantitative) Variable: The variable whose outcomes are numbers. -Discrete -Continous Numerical Variables in Table : ? 4 3 5 gender Age (? ) Height (? )
Measurement Levels(=Scales) • • Measurement is the process of assigning a number value to a variable. Categorical (=Qualitative) Variable may be scaled as “nominal” or “ordinal” Example 1: Nominal Data Gender = Female/ Male Lets code answers as following: 1=Female & 2= Male or code as 7= Female & 5= Male These number does not mean anything, just arbitrarily chosen. There is no measurable meaning to the “difference” in numbers Example 2: Ordinal Data University Class = (1: Freshman , 2: Sophomore, 3: Junior , 4: Senior ) Satisfaction rating for canteen food (1: very dissatisfied, 2: moderate, 3: no opinion, 4: satisfied, 5: very satisfied) Unlikely nominal data, ordinal data indicates “the rank of ordering of items”. Similarly nominal data, there is no measurable meaning to the “difference” in numbers. Other examples?
Numerical (= Quantitative) Variable may be scaled as “interval” or “ratio” Example 1: Interval Data: Wheather Boston, Chicago, IL Difference Ratio MA Fahrenheit 37° F 44° F 7 F 1. 19 Celsius 3° C 7° C 4 C 2. 33 Source: www. msn. com for Jan 11 “difference” in numbers is meaningful, but the ratio between them does not have any meaning. We cannot say that Chicago is twice warmer than Boston. (see in Fahrenheit units the temperatures are very close to each others and the ratio is almost equal to 1) ( Note: 1 C*9/5 +32 = 33. 8 F) Example 2: Ratio Data: • Height Ahmet Orhan Difference Ratio • Meters 170 cm 180 cm 10 1. 0588 • Feet 5. 58 5. 91 0. 33 1. 0588 • Explanation: Since 1 Feet= 30. 48 cm, 10 cm= 0. 33 feet Both “difference & ratio” between numbers are meaningful and comparable!
Graphs to Describe Categorical Variables Table 1 Kentucky Region Alabama 4, 138 Alaska 97 Arizona 567 Arkansas 2 Colorado 2, 226 Example: Table 1. Average Number of Employees in Coal Mine Source: Official Energy Statistics from The US government http: //www. eia. doe. gov/cneaf/coal/page/acr/table 18. html Illinois 3, 817 Indiana 2, 683 Kansas 25 *Bar Charts & Pie Charts Kentucky Total *Frequency Distribution Table: What is Frequency? Frequency: Number of observations for each class. 16, 990
Graphical Presentation
Graphs to Describe Categorical Variables *Bar Charts & Pie Charts
Right handside is an example of cluster bar chart. The decomposition of debt, as percentage of GDP, into bank loans, portfolio investment & foreign direct investment (FDI) is graphed for a group of developing countries during 1978 -81, 1982 -89 and 1990 -1995 subperiods. (source: IMF, 2001) As % of GDP Period 1 1978 -81 Period 2 1982 -89 Period 3 1990 -1995 FDI 11 16 20 Portfolio (Equity-Debt) 9 29 44 Loans 80 55 36
Graphs to Time Series Data Line Chart ( Time Series Plot) : It is a series of data plotted at various time intervals. Example 1: Consumer Price Index for US, Brazil, Chile and Argentina for period [1987, 2005] Source: IFS- International Financial Statistics provided by IMF
Example 2: Employment Level Agriculture& Related industry Source: U. S. Department of Labor Bureau of Labor Statistics http: //data. bls. gov/PDQ/servlet/Survey. Output. Se rvlet Year Employment 1996 3443 1997 3399 1998 3378 1999 3281 2000 2464 2001 2299 2002 2311 2003 2275 2004 2232 2005 2197 2006 2206
Share & Percentage Lets consider following example: The formal name of garbage is “municipal solid waste”. Below, there is a breakdown for municipal solid waste in US in 2000 Share = ( frequency of concerned variable) / (total frequency of all variables) Percentage = Share * 100 Material Weight(in tons) share % of total Food scraps 25. 9 0. 111686 11. 20% glass 12. 8 0. 055196 5. 50% metals 18 0. 07762 7. 80% paper 86. 7 0. 373868 37. 40% plastic 24. 7 0. 106511 10. 70% rubber 15. 8 0. 068133 5. 50% others 48 0. 206986 21% Total (=SUM) 231. 9 1 100% For example: * share of “glass” is found by dividing frequency of “glass” to “total frequency of all variables” = 12. 8 / 231. 9 = 0. 055196 * Percentage of “glass” = 100* share= 5. 5 share= material weight/ total weight percentage= Share * 100
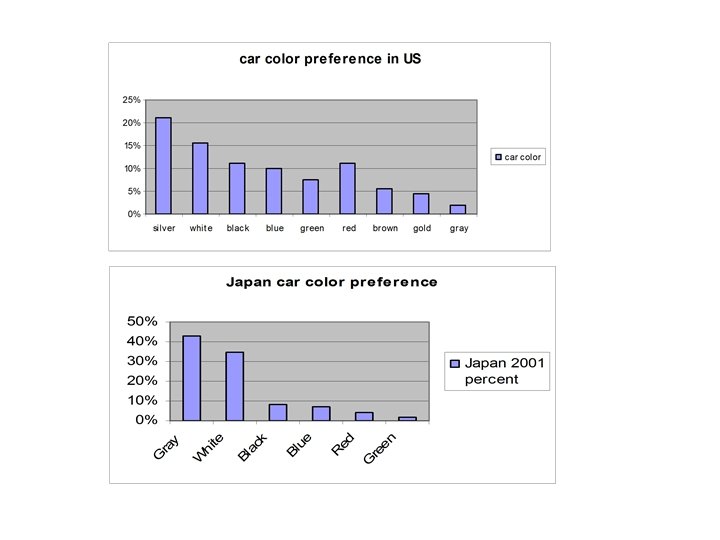
Class Exercise • • • The color of the car. Here is a breakdown of the most popular colors for vehicles in North America during the 2001 model year: Car colors in Japan. Data for 2001 model year vehicles made in Japan: What percent of North America vehicles have other colors? (21%+15. 6%+… 2% = 88. 6 %) sum (silver %+brown%+gold%) = 31. 1 % • • Make a bar graph of the both data set? What are the most important differences between choice of vehicle color in Japan and North America? Nort America 2001 color Percent color red Percent silver 21% 11. 20% white 15. 60% brown 5. 60% black 11. 20% gold 4. 50% blue 9. 90% gray 2% green 7. 60% Japan 2001 color percent Gray 43% White 35% Black 8% Blue 7% Red 4% Green 2%
Chapter 2, Section 2. 4 - 2. 5 Outline • Graphs to describe Numerical Variables • Tables and Graphs to Describe Relationship between Variables