CHAPTER 1 WHAT IS CHEMISTRY WHAT IS CHEMISTRY


 n Examples of science: – – – n What")

 n Step 4: Collect, record analyze data - Example: 6 of")
 n Theories – Are never completely certain – May change as")
 §")


- Slides: 14
CHAPTER 1 WHAT IS CHEMISTRY?
WHAT IS CHEMISTRY? n Chemistry: study of matter, it’s composition, structure and changes. n Scientific research: logical search for knowledge
IMPORTANCE OF CHEMISTRY n Chemistry is all around you. – Air you breathe – Food you digest – Clothes you wear – Textbook you read n Chemistry science. is often said to be the central
SCIENCE V. S. TECHNOLOGY n How is science different from technology? n Science: – Experimental investigation and exploration of natural phenomena – Pursues knowledge for its own sake – Does not cause change in itself n Technology -Using knowledge to make and use products to improve quality of life
SCIENCE V. S. TECHNOLOGY (Cont) n Examples of science: – – – n What causes the flu? How are atoms put together? How is genetic information stored and transmitted? Examples of technology – – – Flu vaccine Atomic bomb Genetic engineering
SCIENTIFIC METHOD n Step 1: State the problem – Example: I am sick with a stomachache. n Step 2: Form a Hypothesis – Example: I am sick due to the spoiled food I ate for lunch. n Step 3: Conduct a controlled experiment – Example: Ask others who ate the same food for lunch if they got sick.
SCIENTIFIC METHOD (Cont) n Step 4: Collect, record analyze data - Example: 6 of 6 people who ate the same lunch felt sick - Example: The expiration date on the chicken was 2 weeks ago. n Step 5: Draw conclusions. – Example: People became sick after eating lunch yesterday because of the outdated chicken.
SCIENTIFIC METHOD (Cont) n Theories – Are never completely certain – May change as more experiments are performed. – A model is a physical picture or mathematical expression of a theory. § Example: Model of the atom n The scientific method must be free of bias.
Terms to know Hypothesis- testable prediction Variable- factor being tested § Independent (manipulated) § Dependent (responding) Control- standard of comparison Constant- factors that remain the same during trials.
Terms to know Data- information gathered during an experiment. Observation- fact perceived by the senses Inference- conclusions based on observations. Model- representation of something small or large Theory- explanation of an event, supported by a large amount of evidence (can be changed) Law-”rule of nature” , can be repeated over time (never changes)
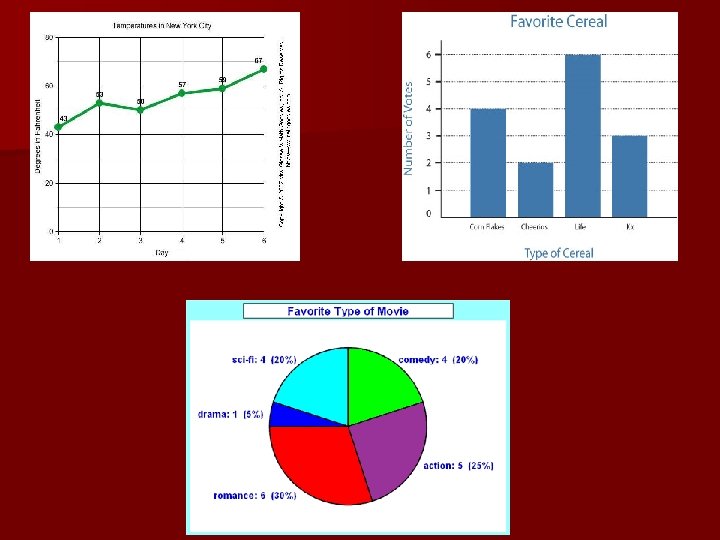
Graphing Data n Graphs: used to represent data – Three types § Line-shows continuous data and trends § Bar- used to compare a set of measurements, amounts or changes § Circle-shows how a part of something is related to the whole
Proper way to make a graph Graphs must have a descriptive title n Label both axes with quantities and units n – X-axis- independent variable (experimenter changes) – Y-axis- dependent variable (measured change) n Graph should take up whole page! n Make the best fit line through the points.
Determining relationships in graphs n Direct relationship – As one factor increases, so does the other. – Straight line. n Inverse relationship – As one factor increases, the other decreases – Downward curve