
Chapter 1 Signals and Amplifiers from Microelectronic Circuits


- Slides: 71
Chapter #1: Signals and Amplifiers from Microelectronic Circuits Text by Sedra and Smith Oxford Publishing Oxford University Publishing Microelectronic Circuits by Adel S. Sedra and Kenneth C. Smith (0195323033)
Introduction § IN THIS CHAPTER YOU WILL LEARN… § That electronic circuits process signals, and thus understanding electrical signals is essential to appreciating the material in this book. § Thevenin and Norton representations of signal sources. § The representation of a signal as sum of sine waves. § The analog and digital representations of a signal. Oxford University Publishing Microelectronic Circuits by Adel S. Sedra and Kenneth C. Smith (0195323033)
Introduction § IN THIS CHAPTER YOU WILL LEARN… § The most basic and pervasive signal-processing function: signal amplification, and correspondingly, the signal amplifier. § How amplifiers are characterized (modeled) as circuit building blocks independent of their internal circuitry. § How the frequency response of an amplifier is measured, and how it is calculated, especially in the simple but common case of a single-time-constant (STC) type response. Oxford University Publishing Microelectronic Circuits by Adel S. Sedra and Kenneth C. Smith (0195323033)
1. 1. Signals § signal – contains information § e. g. voice of radio announcer reading the news § process – an operation which allows an observer to understand this information from a signal § generally done electrically § transducer – device which converts signal from nonelectrical to electrical form § e. g. microphone (sound to electrical) Oxford University Publishing Microelectronic Circuits by Adel S. Sedra and Kenneth C. Smith (0195323033)
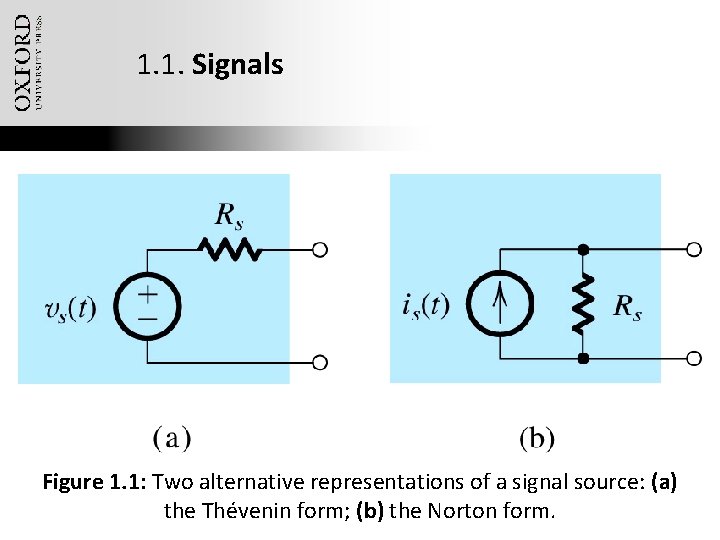
1. 1: Signals § Q: How are signals represented? § A: thevenin form – voltage source vs(t) with series resistance RS § preferable when RS is low § A: norton form – current source is(t) with parallel resistance RS § preferable when RS is high Oxford University Publishing Microelectronic Circuits by Adel S. Sedra and Kenneth C. Smith (0195323033)
1. 1. Signals Figure 1. 1: Two alternative representations of a signal source: (a) Oxford University Publishing Thévenin form; (b) the Norton form. Microelectronic Circuits by Adel the S. Sedra and Kenneth C. Smith (0195323033)
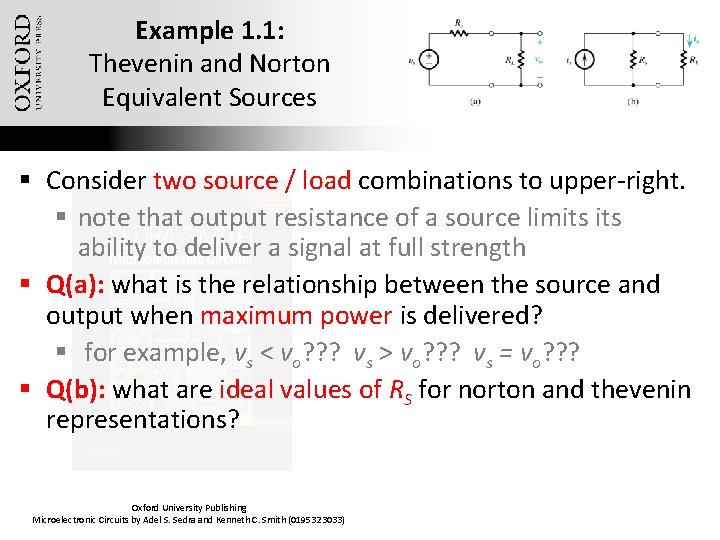
Example 1. 1: Thevenin and Norton Equivalent Sources § Consider two source / load combinations to upper-right. § note that output resistance of a source limits ability to deliver a signal at full strength § Q(a): what is the relationship between the source and output when maximum power is delivered? § for example, vs < vo? ? ? vs > vo? ? ? vs = vo? ? ? § Q(b): what are ideal values of RS for norton and thevenin representations? Oxford University Publishing Microelectronic Circuits by Adel S. Sedra and Kenneth C. Smith (0195323033)
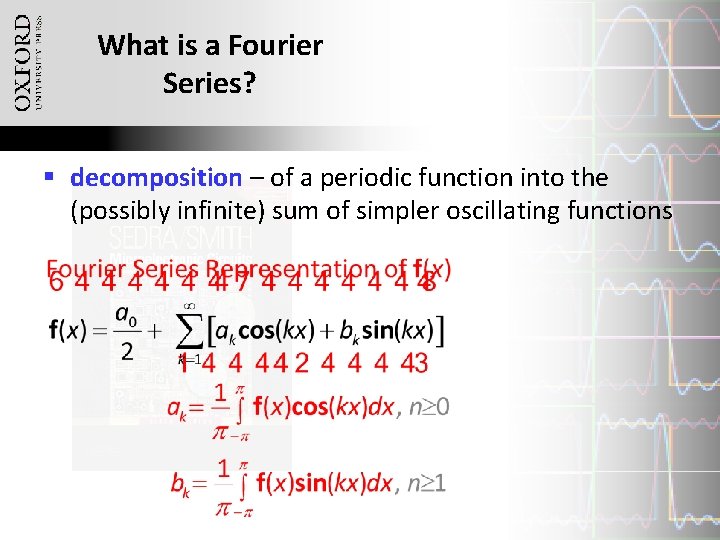
1. 2. Frequency Spectrum of Signals § frequency spectrum – defines the a time-domain signal in terms of the strength of harmonic components § Q: What is a Fourier Series? § A: An expression of a periodic function as the sum of an infinite number of sinusoids whose frequencies are harmonically related Oxford University Publishing Microelectronic Circuits by Adel S. Sedra and Kenneth C. Smith (0195323033)
What is a Fourier Series? § decomposition – of a periodic function into the (possibly infinite) sum of simpler oscillating functions Oxford University Publishing Microelectronic Circuits by Adel S. Sedra and Kenneth C. Smith (0195323033)
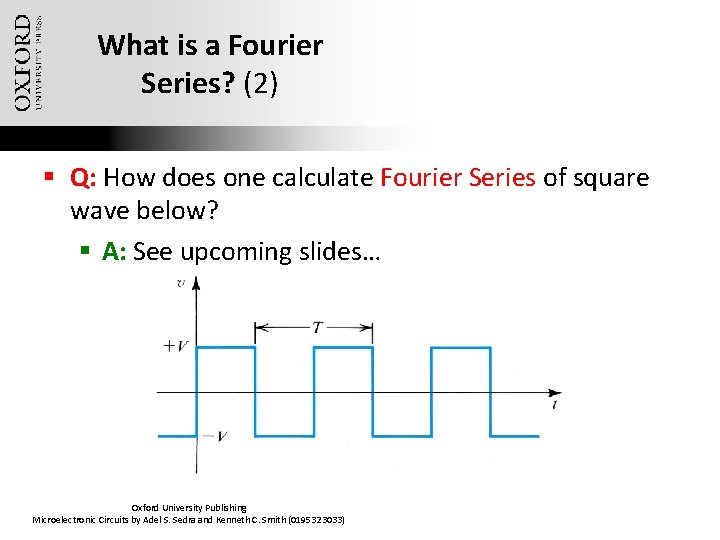
What is a Fourier Series? (2) § Q: How does one calculate Fourier Series of square wave below? § A: See upcoming slides… Oxford University Publishing Microelectronic Circuits by Adel S. Sedra and Kenneth C. Smith (0195323033)
Fourier Series Example Oxford University Publishing Microelectronic Circuits by Adel S. Sedra and Kenneth C. Smith (0195323033)
Fourier Series Example Oxford University Publishing Microelectronic Circuits by Adel S. Sedra and Kenneth C. Smith (0195323033)
Fourier Series Example this series may be truncated because the magnitude of each terms decreases with k… Oxford University Publishing Microelectronic Circuits by Adel S. Sedra and Kenneth C. Smith (0195323033)
Fourier Series Example Figure 1. 6: The frequency spectrum (also known as the line. Oxford spectrum) University Publishingof the periodic square wave of Fig. 1. 5. Microelectronic Circuits by Adel S. Sedra and Kenneth C. Smith (0195323033)
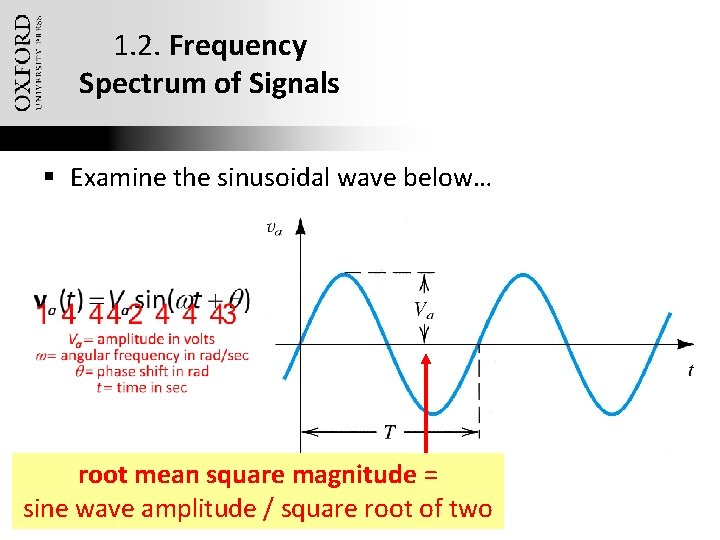
1. 2. Frequency Spectrum of Signals § Examine the sinusoidal wave below… root mean square magnitude = sine wave amplitude / square root of two Oxford University Publishing Microelectronic Circuits by Adel S. Sedra and Kenneth C. Smith (0195323033)
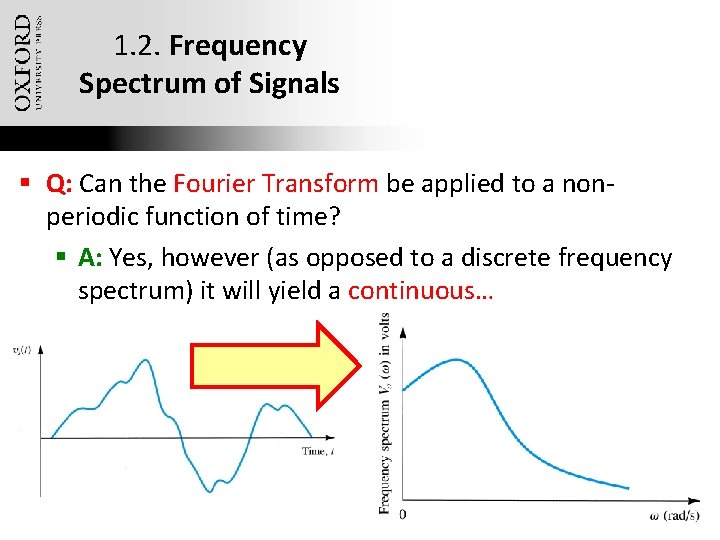
1. 2. Frequency Spectrum of Signals § Q: Can the Fourier Transform be applied to a nonperiodic function of time? § A: Yes, however (as opposed to a discrete frequency spectrum) it will yield a continuous… Oxford University Publishing Microelectronic Circuits by Adel S. Sedra and Kenneth C. Smith (0195323033)
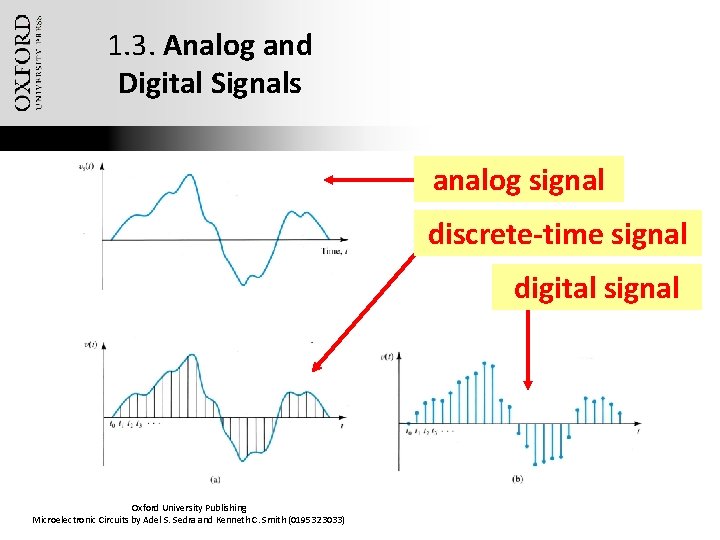
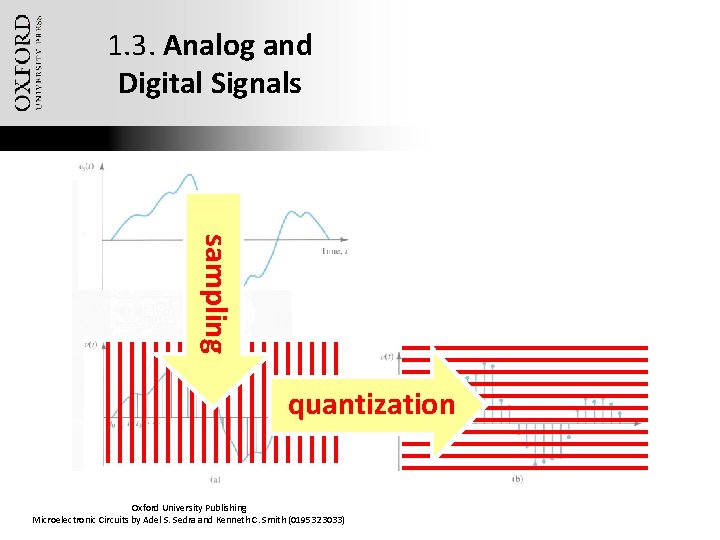
1. 3. Analog and Digital Signals § analog signal – is continuous with respect to both value and time § discrete-time signal – is continuous with respect to value but sampled at discrete points in time § digital signal – is quantized (applied to values) as well as sampled at discrete points in time Oxford University Publishing Microelectronic Circuits by Adel S. Sedra and Kenneth C. Smith (0195323033)
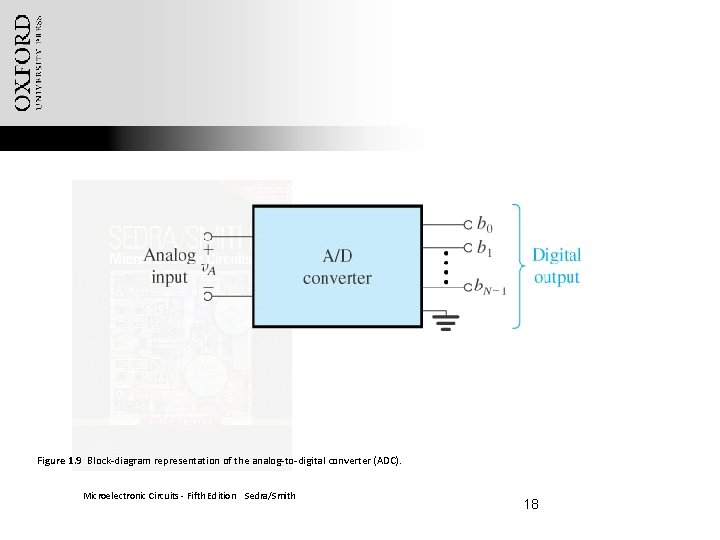
Figure 1. 9 Block-diagram representation of the analog-to-digital converter (ADC). Microelectronic Circuits - Fifth Edition Sedra/Smith 18
1. 3. Analog and Digital Signals analog signal discrete-time signal digital signal Oxford University Publishing Microelectronic Circuits by Adel S. Sedra and Kenneth C. Smith (0195323033)
1. 3. Analog and Digital Signals sampling quantization Oxford University Publishing Microelectronic Circuits by Adel S. Sedra and Kenneth C. Smith (0195323033)
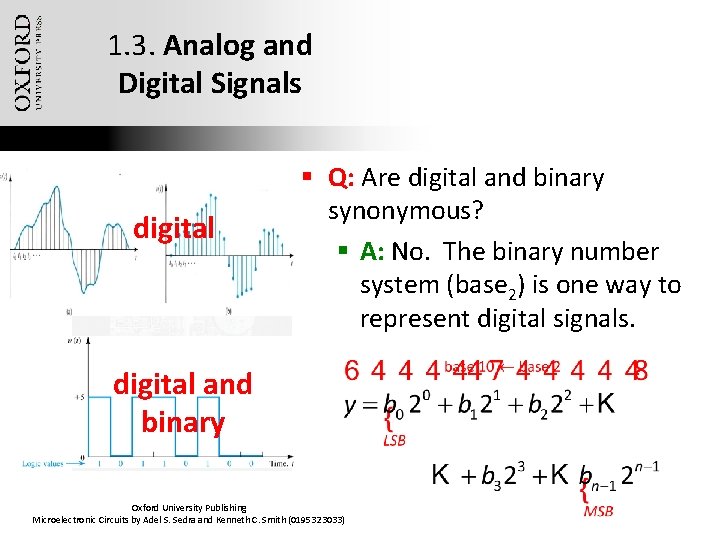
1. 3. Analog and Digital Signals digital § Q: Are digital and binary synonymous? § A: No. The binary number system (base 2) is one way to represent digital signals. digital and binary Oxford University Publishing Microelectronic Circuits by Adel S. Sedra and Kenneth C. Smith (0195323033)
1. 4. Amplifiers § Q: Why is signal amplification needed? § A: Because many transducers yield output at low power levels (m. W) § linearity – is property of an amplifier which ensures a signal is not “altered” from amplification § distortion – is any unintended change in output Oxford University Publishing Microelectronic Circuits by Adel S. Sedra and Kenneth C. Smith (0195323033)
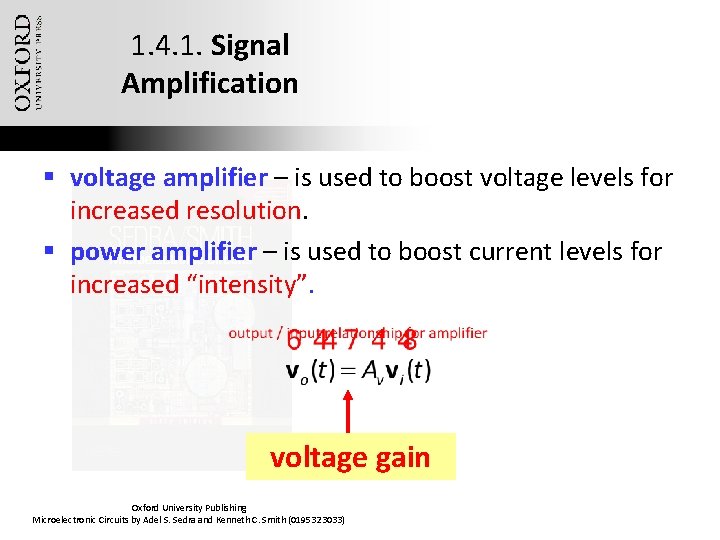
1. 4. 1. Signal Amplification § voltage amplifier – is used to boost voltage levels for increased resolution. § power amplifier – is used to boost current levels for increased “intensity”. voltage gain Oxford University Publishing Microelectronic Circuits by Adel S. Sedra and Kenneth C. Smith (0195323033)
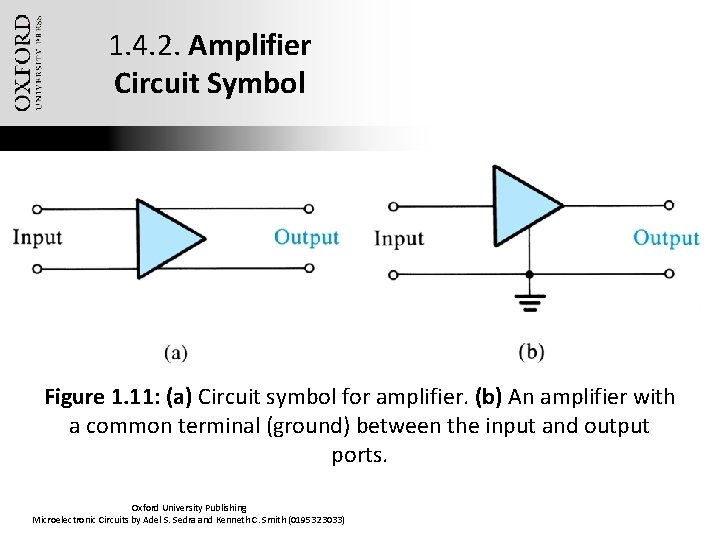
1. 4. 2. Amplifier Circuit Symbol Figure 1. 11: (a) Circuit symbol for amplifier. (b) An amplifier with a common terminal (ground) between the input and output ports. Oxford University Publishing Microelectronic Circuits by Adel S. Sedra and Kenneth C. Smith (0195323033)
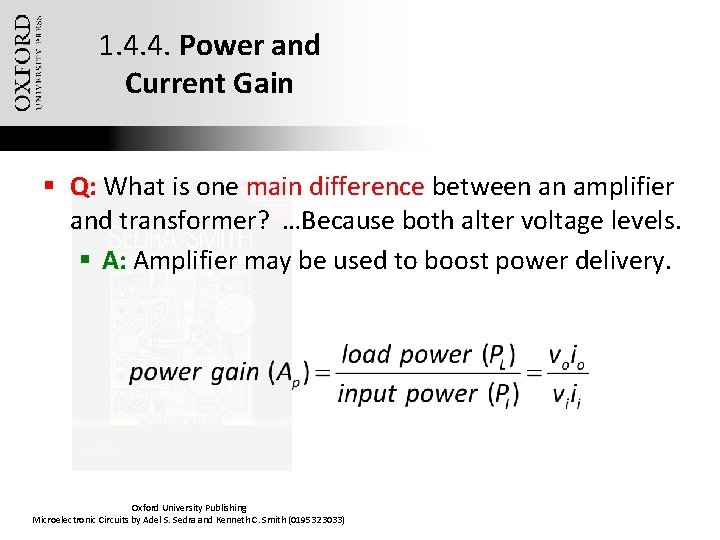
1. 4. 4. Power and Current Gain § Q: What is one main difference between an amplifier and transformer? …Because both alter voltage levels. § A: Amplifier may be used to boost power delivery. Oxford University Publishing Microelectronic Circuits by Adel S. Sedra and Kenneth C. Smith (0195323033)
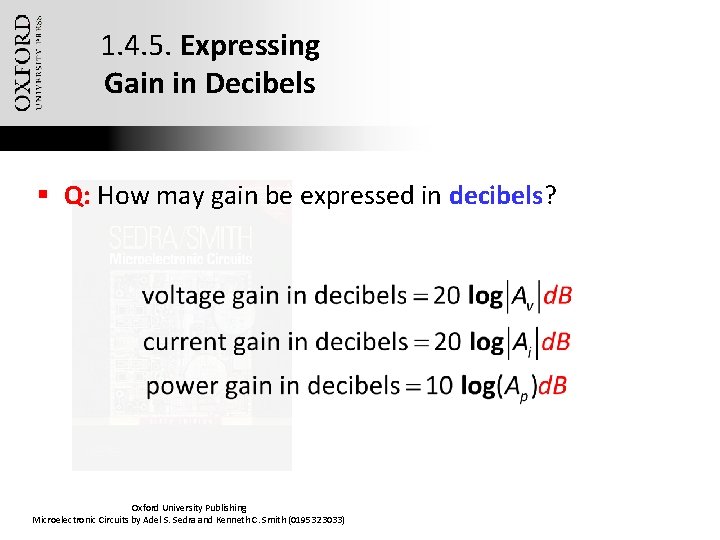
1. 4. 5. Expressing Gain in Decibels § Q: How may gain be expressed in decibels? Oxford University Publishing Microelectronic Circuits by Adel S. Sedra and Kenneth C. Smith (0195323033)
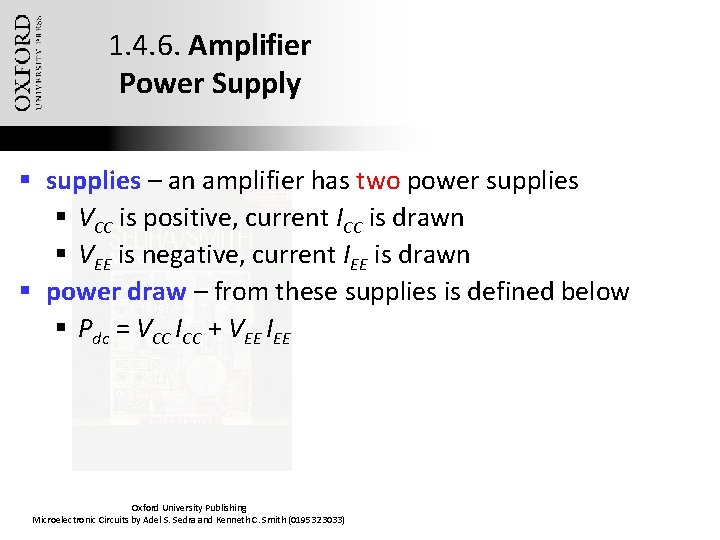
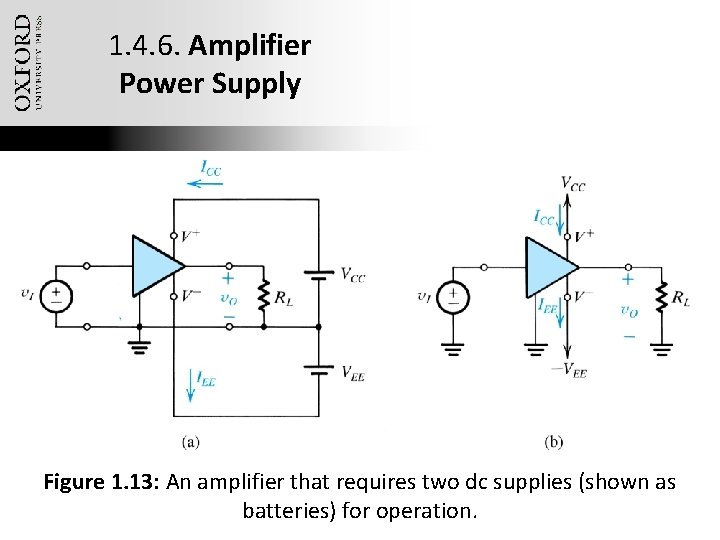
1. 4. 6. Amplifier Power Supply § supplies – an amplifier has two power supplies § VCC is positive, current ICC is drawn § VEE is negative, current IEE is drawn § power draw – from these supplies is defined below § Pdc = VCC ICC + VEE IEE Oxford University Publishing Microelectronic Circuits by Adel S. Sedra and Kenneth C. Smith (0195323033)
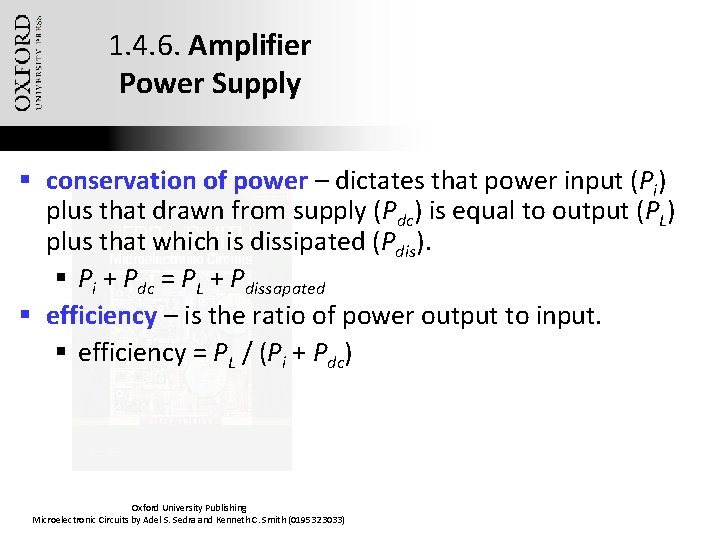
1. 4. 6. Amplifier Power Supply § conservation of power – dictates that power input (Pi) plus that drawn from supply (Pdc) is equal to output (PL) plus that which is dissipated (Pdis). § Pi + Pdc = PL + Pdissapated § efficiency – is the ratio of power output to input. § efficiency = PL / (Pi + Pdc) Oxford University Publishing Microelectronic Circuits by Adel S. Sedra and Kenneth C. Smith (0195323033)
1. 4. 6. Amplifier Power Supply Figure 1. 13: An amplifier that requires two dc supplies (shown as Oxford University Publishing batteries) Microelectronic Circuits by Adel S. Sedra and Kenneth C. Smith (0195323033)for operation.
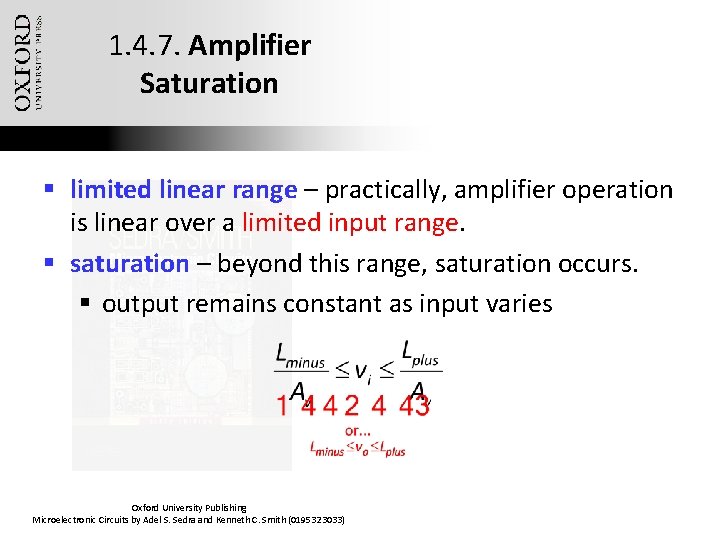
1. 4. 7. Amplifier Saturation § limited linear range – practically, amplifier operation is linear over a limited input range. § saturation – beyond this range, saturation occurs. § output remains constant as input varies Oxford University Publishing Microelectronic Circuits by Adel S. Sedra and Kenneth C. Smith (0195323033)
1. 5. Circuit Models for Amplifiers § model – is the description of component’s (e. g. amplifier) terminal behavior § neglecting internal operation / transistor design Oxford University Publishing Microelectronic Circuits by Adel S. Sedra and Kenneth C. Smith (0195323033)
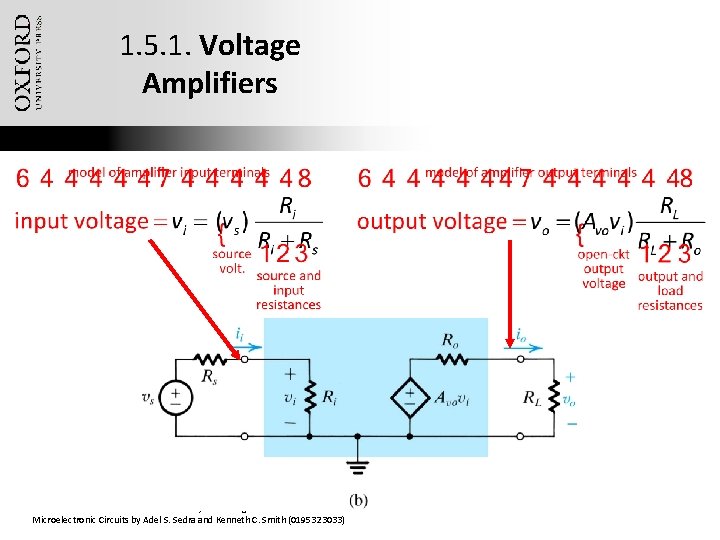
1. 5. 1. Voltage Amplifiers Oxford University Publishing Microelectronic Circuits by Adel S. Sedra and Kenneth C. Smith (0195323033)
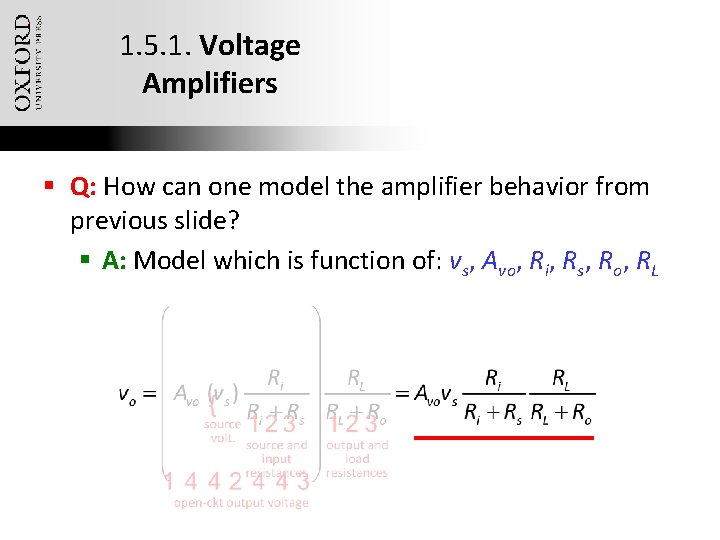
1. 5. 1. Voltage Amplifiers § Q: How can one model the amplifier behavior from previous slide? § A: Model which is function of: vs, Avo, Ri, Rs, Ro, RL Oxford University Publishing Microelectronic Circuits by Adel S. Sedra and Kenneth C. Smith (0195323033)
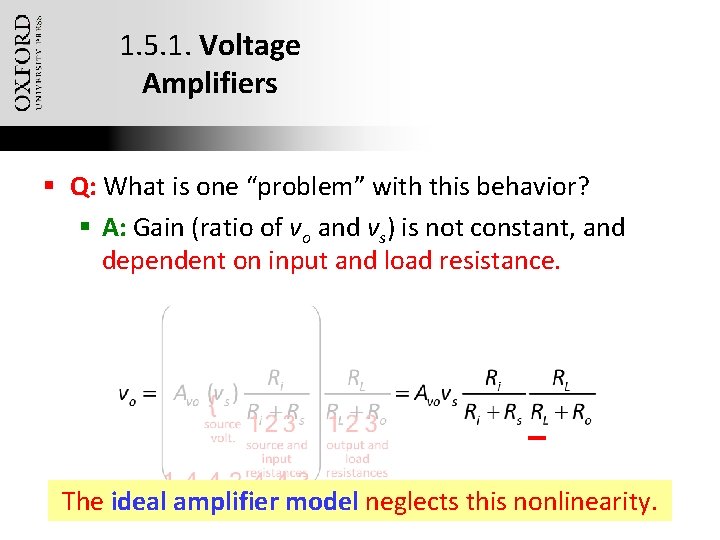
1. 5. 1. Voltage Amplifiers § Q: What is one “problem” with this behavior? § A: Gain (ratio of vo and vs) is not constant, and dependent on input and load resistance. The ideal amplifier model neglects this nonlinearity. Oxford University Publishing Microelectronic Circuits by Adel S. Sedra and Kenneth C. Smith (0195323033)
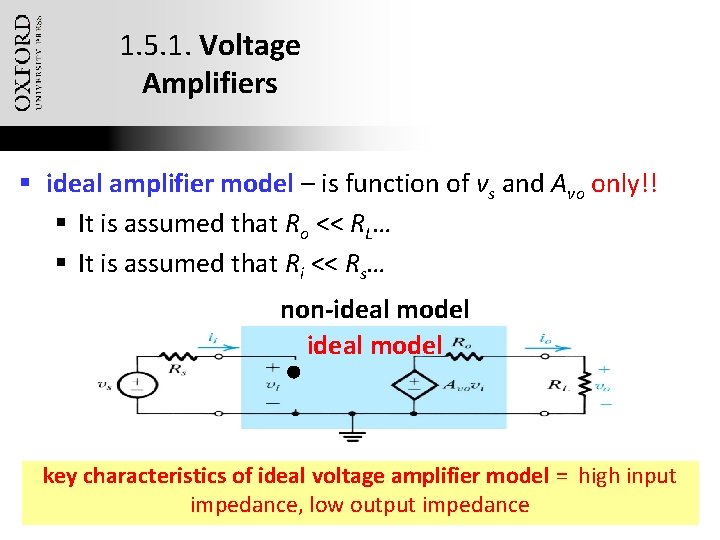
1. 5. 1. Voltage Amplifiers § ideal amplifier model – is function of vs and Avo only!! § It is assumed that Ro << RL… § It is assumed that Ri << Rs… non-ideal model key characteristics of ideal voltage amplifier model = high input Oxford University Publishing impedance, low output impedance Microelectronic Circuits by Adel S. Sedra and Kenneth C. Smith (0195323033)
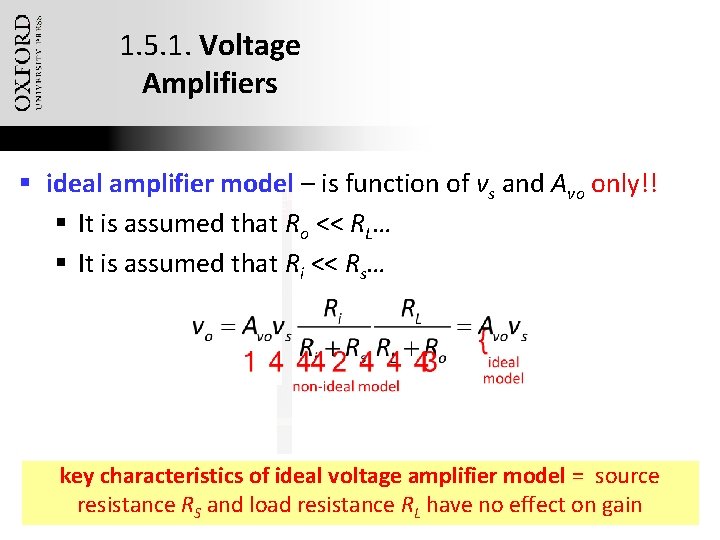
1. 5. 1. Voltage Amplifiers § ideal amplifier model – is function of vs and Avo only!! § It is assumed that Ro << RL… § It is assumed that Ri << Rs… key characteristics of ideal voltage amplifier model = source Oxford University resistance R Publishing and load resistance RL have no effect on gain Microelectronic Circuits by Adel S. Sedra. Sand Kenneth C. Smith (0195323033)
1. 5. 2. Cascaded Amplifiers § In real life, an amplifier is not ideal and will not have infinite input impedance or zero output impedance. § Cascading of amplifiers, however, may be used to emphasize desirable characteristics. § first amplifier – high Ri, medium Ro § last amplifier – medium Ri, low Ro § aggregate – high Ri, low Ro Oxford University Publishing Microelectronic Circuits by Adel S. Sedra and Kenneth C. Smith (0195323033)
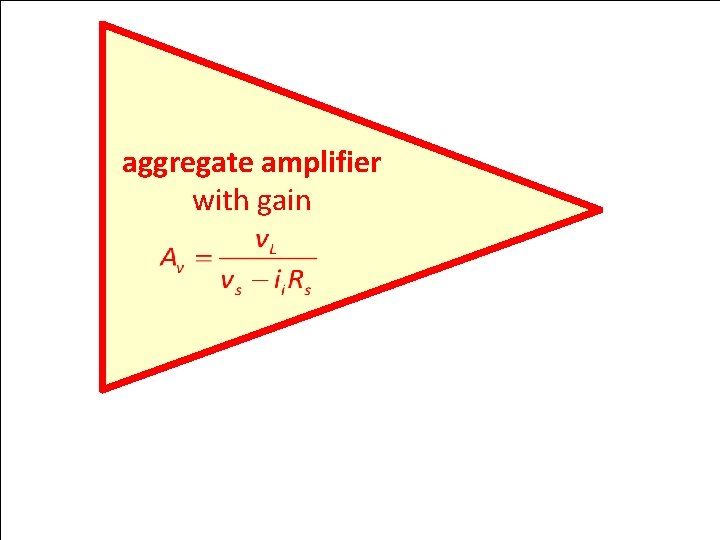
Example 1. 3: Cascaded Amplifier Configurations § § Examine system of cascaded amplifiers on next slide. Q(a): What is overall voltage gain? Q(b): What is overall current gain? Q(c): What is overall power gain? Oxford University Publishing Microelectronic Circuits by Adel S. Sedra and Kenneth C. Smith (0195323033)
Example 1. 3: Cascaded Amplifier Configurations aggregate amplifier with gain Figure 1. 17: Three-stage amplifier for Example 1. 3. Oxford University Publishing Microelectronic Circuits by Adel S. Sedra and Kenneth C. Smith (0195323033)
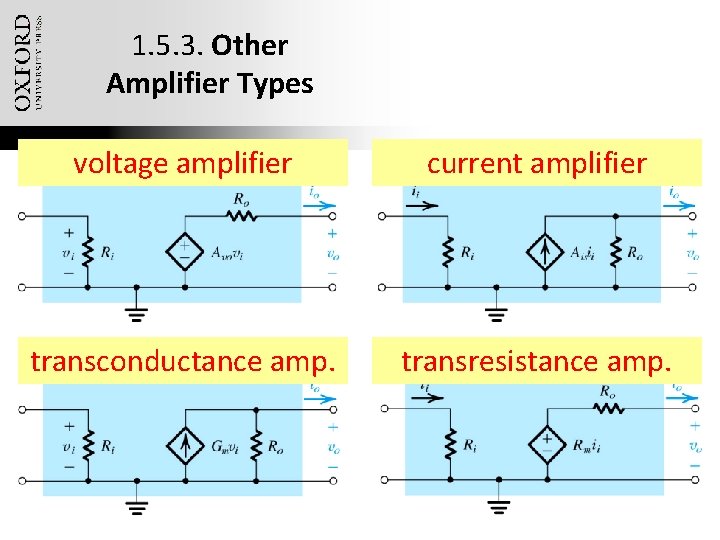
1. 5. 3. Other Amplifier Types voltage amplifier current amplifier transconductance amp. transresistance amp. Oxford University Publishing Microelectronic Circuits by Adel S. Sedra and Kenneth C. Smith (0195323033)
1. 5. 3. Other Amplifier Types voltage amplifier transconductance amplifier Oxford University Publishing Microelectronic Circuits by Adel S. Sedra and Kenneth C. Smith (0195323033) current amplifier transresistance amplifier
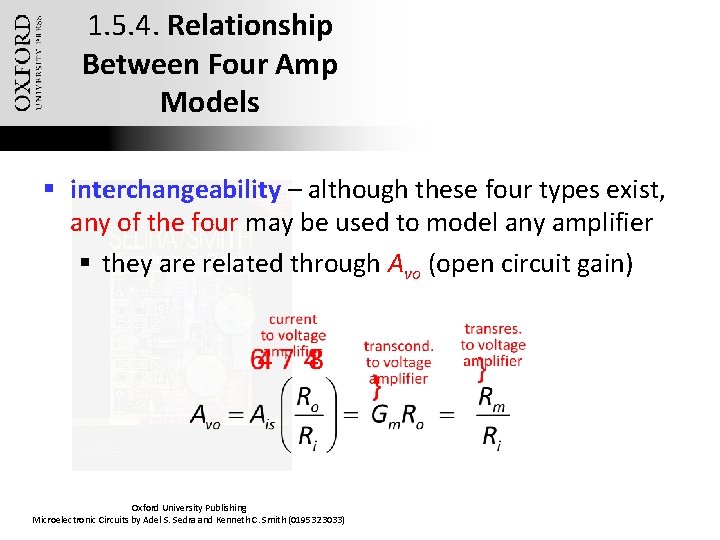
1. 5. 4. Relationship Between Four Amp Models § interchangeability – although these four types exist, any of the four may be used to model any amplifier § they are related through Avo (open circuit gain) Oxford University Publishing Microelectronic Circuits by Adel S. Sedra and Kenneth C. Smith (0195323033)
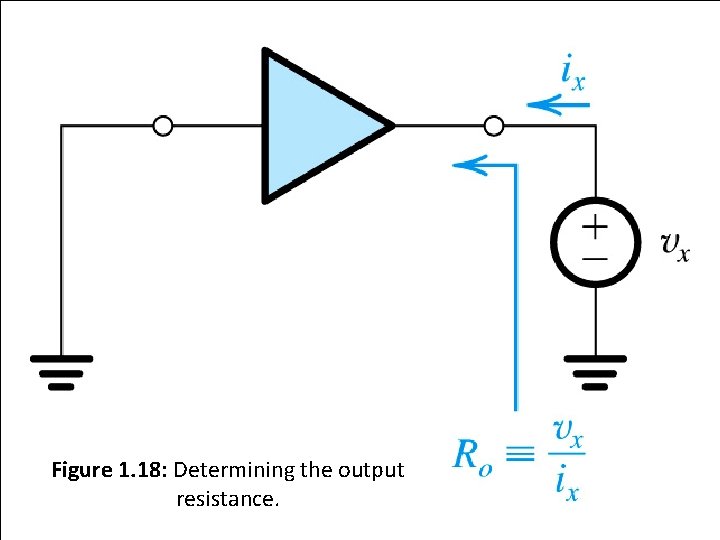
1. 5. 5. Determining Ri and Ro § Q: How can one calculate input resistance from terminal behavior? § A: Observe vi and ii, calculate via Ri = vi / ii § Q: How can one calculate output resistance from terminal behavior? § A: § Remove source voltage (such that vi = ii = 0) § Apply voltage to output (vx) § Measure negative output current (-io) § Calculate via Ro = -vx / io Oxford University Publishing Microelectronic Circuits by Adel S. Sedra and Kenneth C. Smith (0195323033)
Section 1. 5. 5: Determining Ri and Ro § question: how can we calculate input resistance from terminal behavior? § answer: observe vi and ii, calculate via Ri = vi / ii § question: how can we calculate output resistance from terminal behavior? § answer: § § remove source voltage (such that vi = ii = 0) apply voltage to output (vx) measure negative output current (-io) calculate via Ro = -vx / io Figure 1. 18: Determining the output resistance. Oxford University Publishing Microelectronic Circuits by Adel S. Sedra and Kenneth C. Smith (0195323033)
1. 5. 6. Unilateral Models § unilateral model – is one in which signal flows only from input to output (not reverse) § However, most practical amplifiers will exhibit some reverse transmission… Oxford University Publishing Microelectronic Circuits by Adel S. Sedra and Kenneth C. Smith (0195323033)
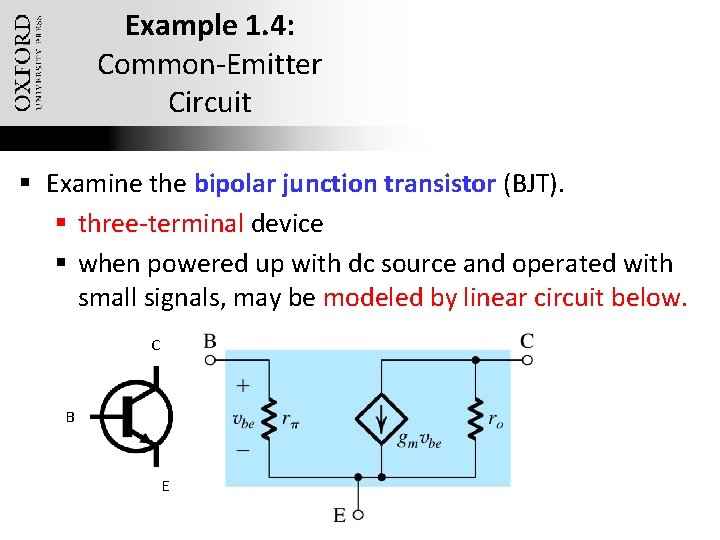
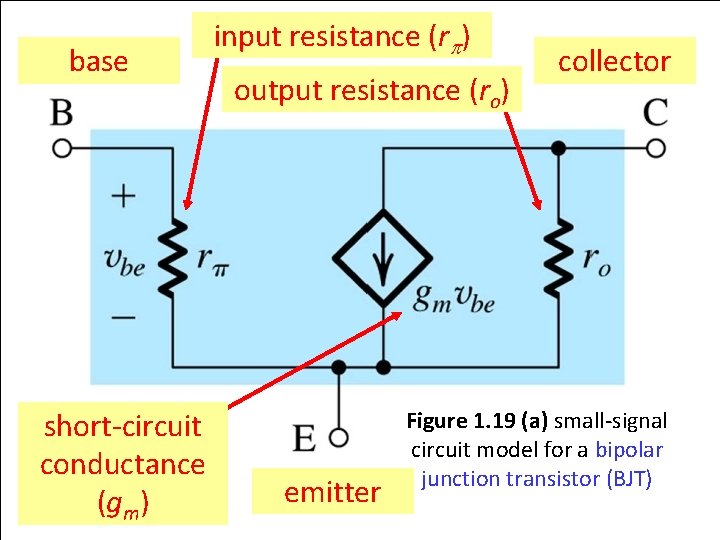
Example 1. 4: Common-Emitter Circuit § Examine the bipolar junction transistor (BJT). § three-terminal device § when powered up with dc source and operated with small signals, may be modeled by linear circuit below. C B E Oxford University Publishing Microelectronic Circuits by Adel S. Sedra and Kenneth C. Smith (0195323033)
input resistance (rp) base Example 1. 4. output resistance (ro) collector § examine: § bipolar junction transistor (BJT): § three-terminal device § when powered up with dc source and operated with small signals, may be modeled by linear circuit below. short-circuit conductance (gm) emitter Oxford University Publishing Microelectronic Circuits by Adel S. Sedra and Kenneth C. Smith (0195323033) Figure 1. 19 (a) small-signal circuit model for a bipolar junction transistor (BJT)
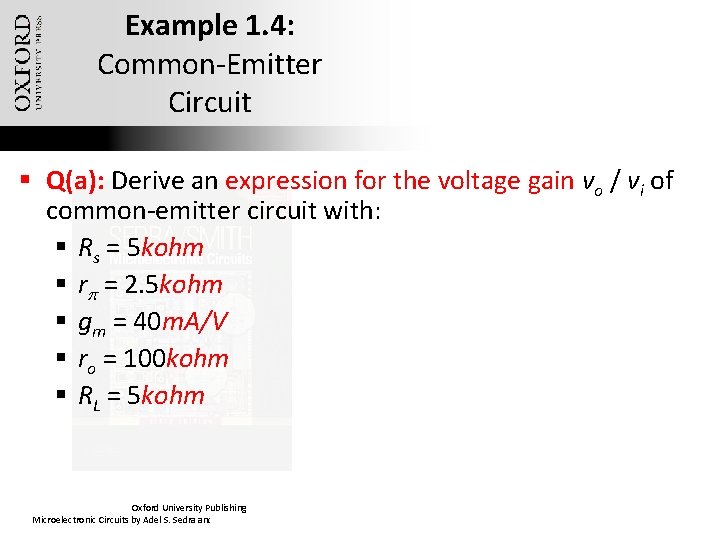
Example 1. 4: Common-Emitter Circuit § Q(a): Derive an expression for the voltage gain vo / vi of common-emitter circuit with: § Rs = 5 kohm § rp = 2. 5 kohm § gm = 40 m. A/V § ro = 100 kohm § RL = 5 kohm Oxford University Publishing Microelectronic Circuits by Adel S. Sedra and Kenneth C. Smith (0195323033)
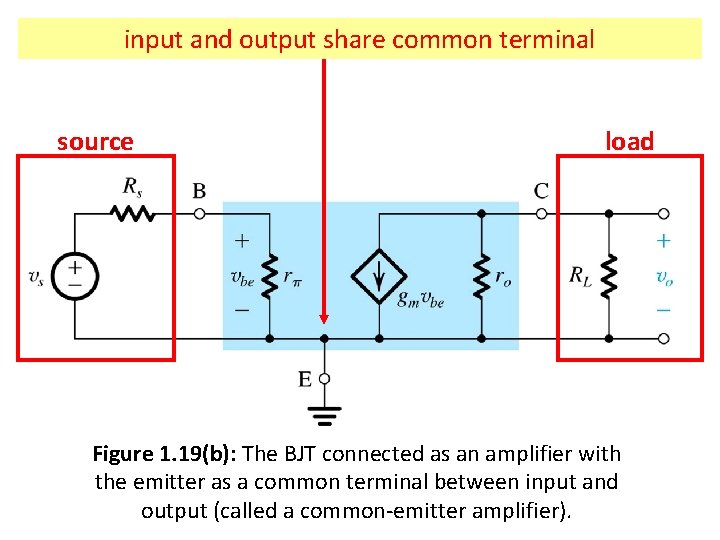
input and output share common terminal source load Figure 1. 19(b): The BJT connected as an amplifier with the emitter as a common terminal between input and Oxford University Publishing common-emitter amplifier). Microelectronic Circuits byoutput Adel S. Sedra and(called Kenneth C. Smitha (0195323033)
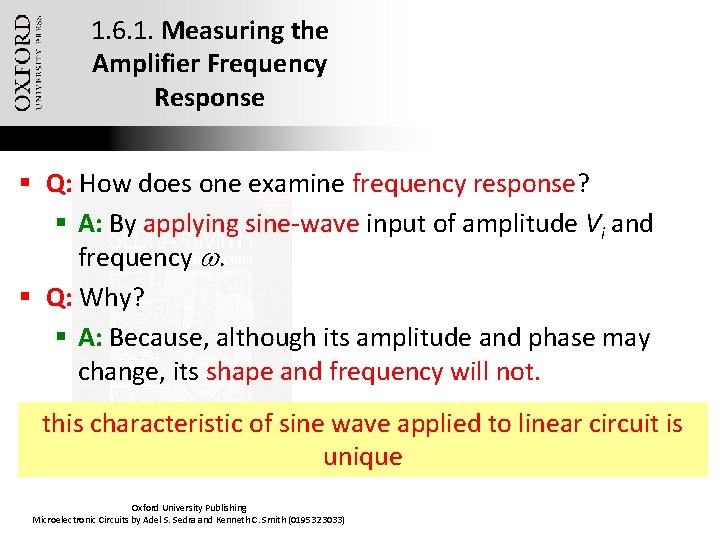
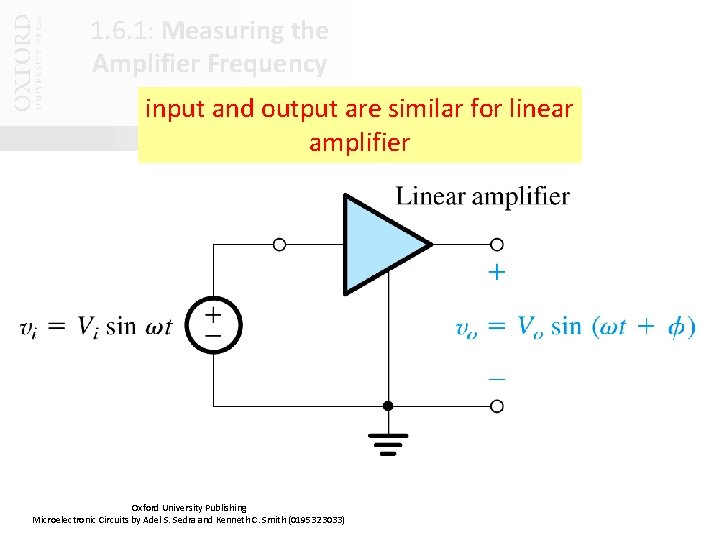
1. 6. 1. Measuring the Amplifier Frequency Response § Q: How does one examine frequency response? § A: By applying sine-wave input of amplitude Vi and frequency w. § Q: Why? § A: Because, although its amplitude and phase may change, its shape and frequency will not. this characteristic of sine wave applied to linear circuit is unique Oxford University Publishing Microelectronic Circuits by Adel S. Sedra and Kenneth C. Smith (0195323033)
1. 6. 1: Measuring the Amplifier Frequency Response input and output are similar for linear amplifier Oxford University Publishing Microelectronic Circuits by Adel S. Sedra and Kenneth C. Smith (0195323033)
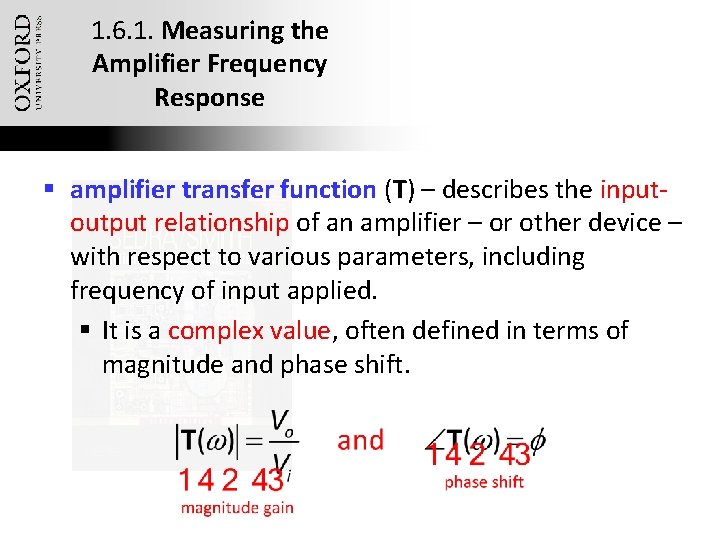
1. 6. 1. Measuring the Amplifier Frequency Response § amplifier transfer function (T) – describes the inputoutput relationship of an amplifier – or other device – with respect to various parameters, including frequency of input applied. § It is a complex value, often defined in terms of magnitude and phase shift. Oxford University Publishing Microelectronic Circuits by Adel S. Sedra and Kenneth C. Smith (0195323033)
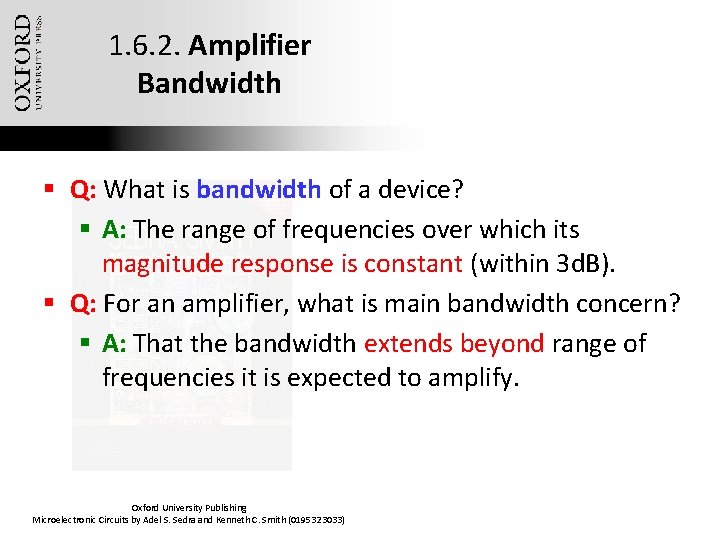
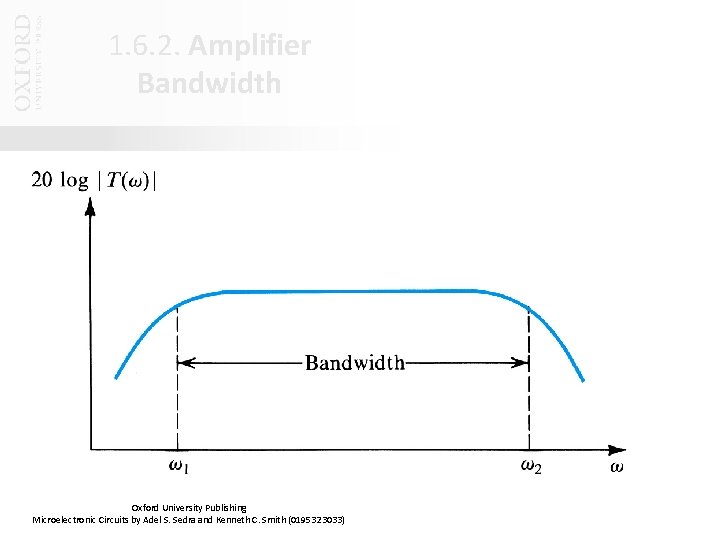
1. 6. 2. Amplifier Bandwidth § Q: What is bandwidth of a device? § A: The range of frequencies over which its magnitude response is constant (within 3 d. B). § Q: For an amplifier, what is main bandwidth concern? § A: That the bandwidth extends beyond range of frequencies it is expected to amplify. Oxford University Publishing Microelectronic Circuits by Adel S. Sedra and Kenneth C. Smith (0195323033)
1. 6. 2. Amplifier Bandwidth Oxford University Publishing Microelectronic Circuits by Adel S. Sedra and Kenneth C. Smith (0195323033)
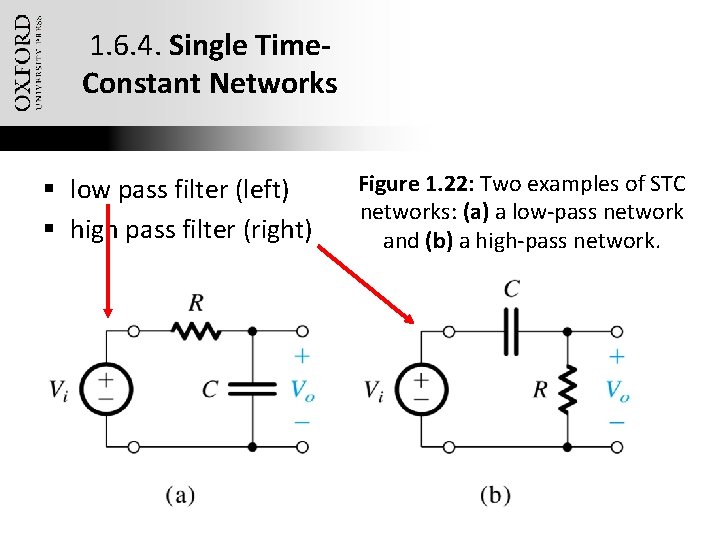
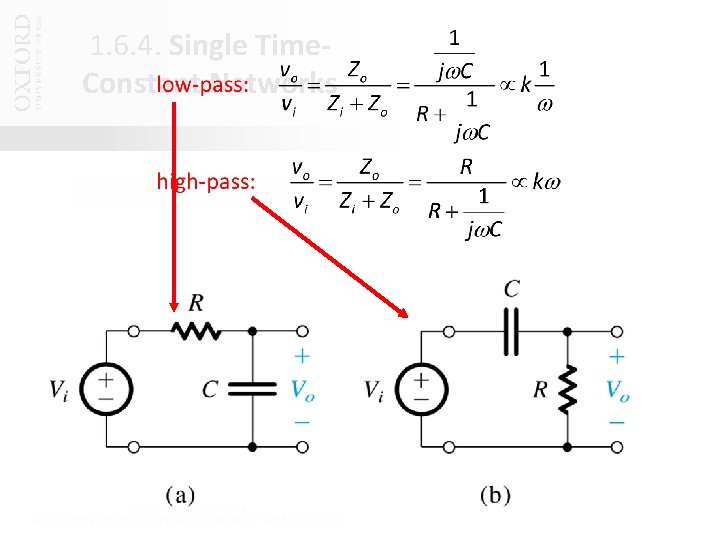
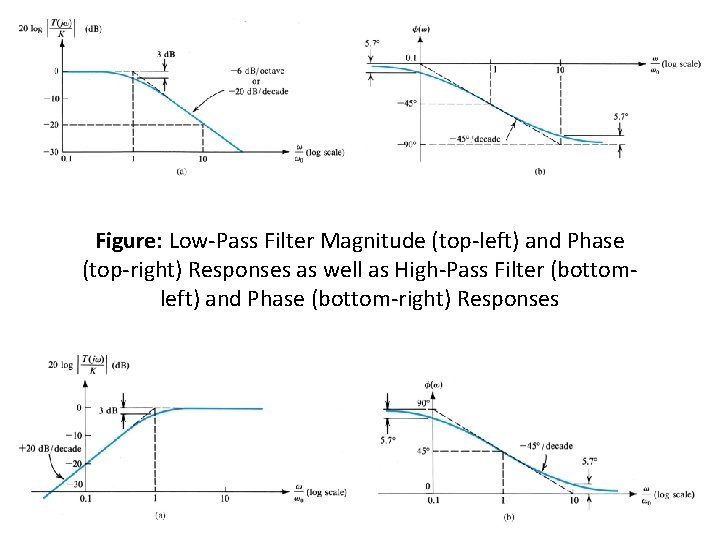
1. 6. 4. Single Time. Constant Networks § single time–constant (STC) network – is composed of (or may be reduced to) one reactive component and one resistance. § low pass filter – attenuates output at high frequencies, allow to pass § high pass filter – attenuates output at low frequencies, allow high to pass § time constant (t. ) – describes the length of time required for a network transient to settle from step change (t = L / R = RC) Oxford University Publishing Microelectronic Circuits by Adel S. Sedra and Kenneth C. Smith (0195323033)
1. 6. 4. Single Time. Constant Networks § low pass filter (left) § high pass filter (right) Oxford University Publishing Microelectronic Circuits by Adel S. Sedra and Kenneth C. Smith (0195323033) Figure 1. 22: output Two examples attenuates at highofs. STC networks: (a) a low-pass network and (b) a high-pass network.
1. 6. 4. Single Time. Constant Networks Oxford University Publishing Microelectronic Circuits by Adel S. Sedra and Kenneth C. Smith (0195323033)
1. 6. 4. Single Time. Constant Networks Oxford University Publishing Microelectronic Circuits by Adel S. Sedra and Kenneth C. Smith (0195323033)
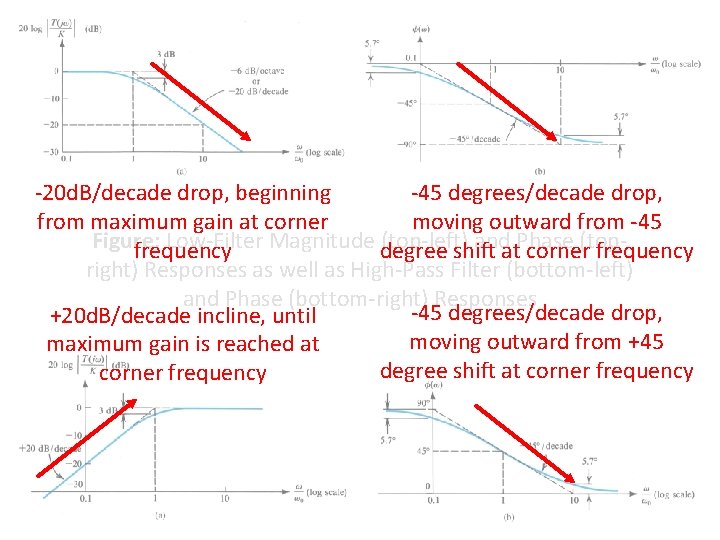
Figure: Low-Pass Filter Magnitude (top-left) and Phase (top-right) Responses as well as High-Pass Filter (bottomleft) and Phase (bottom-right) Responses Oxford University Publishing Microelectronic Circuits by Adel S. Sedra and Kenneth C. Smith (0195323033)
-20 d. B/decade drop, beginning -45 degrees/decade drop, from maximum gain at corner moving outward from -45 Figure: Low-Filter Magnitude degree (top-left) andat. Phase frequency shift corner(topfrequency right) Responses as well as High-Pass Filter (bottom-left) and Phase (bottom-right) Responses -45 degrees/decade drop, +20 d. B/decade incline, until moving outward from +45 maximum gain is reached at degree shift at corner frequency Oxford University Publishing Microelectronic Circuits by Adel S. Sedra and Kenneth C. Smith (0195323033)
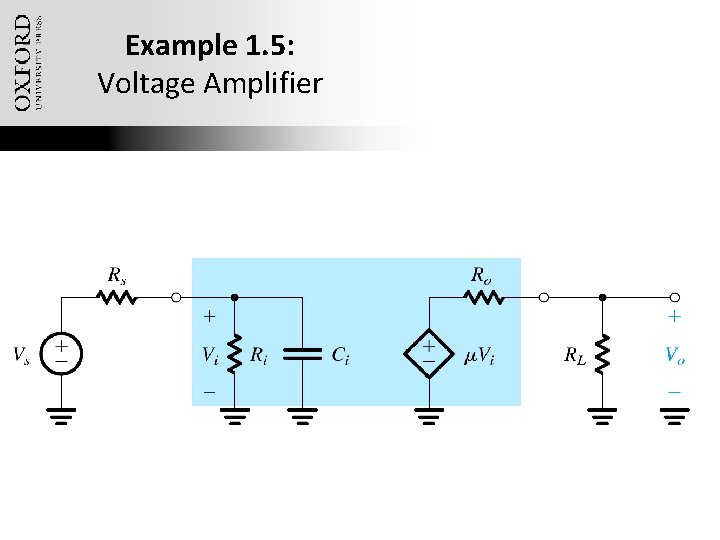
Example 1. 5: Voltage Amplifier § Examine voltage amplifier with: § input resistance (Ri) § input capacitance (Ci) § gain factor (m) § output resistance (Ro) § Q(a): Derive an expression for the amplifier voltage gain Vo / Vs as a function of frequency. From this, find expressions for the dc gain and 3 d. B frequency. Oxford University Publishing Microelectronic Circuits by Adel S. Sedra and Kenneth C. Smith (0195323033)
Example 1. 5: Voltage Amplifier Oxford University Publishing Microelectronic Circuits by Adel S. Sedra and Kenneth C. Smith (0195323033)
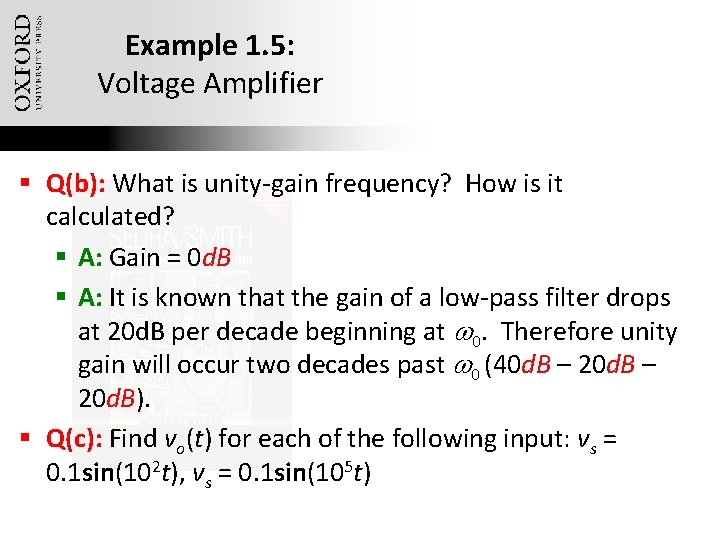
Example 1. 5: Voltage Amplifier § Q(b): What is unity-gain frequency? How is it calculated? § A: Gain = 0 d. B § A: It is known that the gain of a low-pass filter drops at 20 d. B per decade beginning at w 0. Therefore unity gain will occur two decades past w 0 (40 d. B – 20 d. B). § Q(c): Find vo(t) for each of the following input: vs = 0. 1 sin(102 t), vs = 0. 1 sin(105 t) Oxford University Publishing Microelectronic Circuits by Adel S. Sedra and Kenneth C. Smith (0195323033)
1. 6. 5. Classification of Amps Based on Frequency Response § internal capacitances – cause the falloff of gain at high frequencies § like those seen in previous example § coupling capacitors – cause the falloff of gain at low frequencies § are placed in between amplifier stages § generally chosen to be large Oxford University Publishing Microelectronic Circuits by Adel S. Sedra and Kenneth C. Smith (0195323033)
1. 6. 5. Classification of Amps Based on Frequency Response § directly coupled / dc amplifiers – allow passage of low frequencies § capacitively coupled amplifiers – allow passage of high frequencies § tuned amplifiers – allow passage of a “band” of frequencies Oxford University Publishing Microelectronic Circuits by Adel S. Sedra and Kenneth C. Smith (0195323033)
Conclusion § An electrical signal source can be represented in either Thevenin form (a voltage source vs in series with source resistance Rs) or the Norton form (a current source is in parallel with resistance Rs). Thevenin voltage vs is the open-circuit voltage between the source terminals. The Norton current is is equal to the shortcircuit current between the source terminals. For the two representations to be equivalent, vs and Rsis must be equal. § A signal can be represented either by its waveform vs time or as the sum of sinusoids. The latter representation is known as the frequency spectrum of the signal. Oxford University Publishing Microelectronic Circuits by Adel S. Sedra and Kenneth C. Smith (0195323033)
Conclusion (2) § The sine-wave signal is completely characterized by its peak value (or rms value which is the peak / 21/2), frequency (w in rad/s of f in Hz; w = 2 pf and f = 1/T, where T is the period is seconds), and phase with respect to an arbitrary reference time. § Analog signals have magnitudes that can assume any value. Electronic circuits that process analog signals are called analog circuits. Sampling the magnitude of an analog signal at discrete instants of time and representing each signal sample by a number results in a digital signal. Digital signals are processed by digital circuits. Oxford University Publishing Microelectronic Circuits by Adel S. Sedra and Kenneth C. Smith (0195323033)
Conclusion (3) § The simplest digital signals are obtained when the binary number system is used. An individual digital signal then assumes one of only two possible values: low and high (e. g. 0 V and 5 V) corresponding to logic 0 and logic 1. § An analog-to-digital converter (ADC) provides at its output the digits of the binary number representing the analog signal sample applied to its input. The output digital signal can then be processed using digital circuits. § A transfer characteristic, vo vs. vi, of a linear amplifier is a straight line with a slope equal to the voltage gain. Oxford University Publishing Microelectronic Circuits by Adel S. Sedra and Kenneth C. Smith (0195323033)
Conclusion (4) § Amplifiers increase the signal power and thus require dc power supplies for their operation. § The amplifier voltage gain can be expressed as a ratio Av in V/V or in decibels, 20 log|Av| in d. B. § Depending on the signal to be amplified (voltage or current) and on the desired form of output signal (voltage or current) there are four basic amplifier types: voltage, current, transconductance, and transresistance. A given amplifier may be modeled by any of these configurations, in which case their parameters are related by (1. 14) through (1. 16) in the text. Oxford University Publishing Microelectronic Circuits by Adel S. Sedra and Kenneth C. Smith (0195323033)
Conclusion (5) § The sinusoid is the only signal whose waveform is unchanged through a linear circuit. Sinusoidal signals are used to measure the frequency response of amplifiers. § The transfer function T(s) = Vo(s)/Vi(s) of a voltage amplifier may be determined from circuit analysis. Substituting s = jw gives T(jw) whose magnitude (|T(jw)| is the magnitude response and f(w) is the phase response. § Amplifiers are classified according to the shape of their frequency response. Oxford University Publishing Microelectronic Circuits by Adel S. Sedra and Kenneth C. Smith (0195323033)
Conclusion (6) § Single-time-constant (STC) networks are those networks that are composed of, or may be reduced to, one reactive component (L or C) and one resistance. The time constant (t) is L/R or RC. § STC networks can be classified into two categories: low-pass (LP) and high-pass (HP). LP network pass dc and low-frequencies while attenuating high-frequencies. The opposite is true for HP. § The gain of an LP (HP) STC circuit drops by 3 d. B below the zerofrequency (infinite-frequency) value at a frequency w 0 = 1/t. At high-frequencies (low-frequencies) the gain falls of at a rate of 6 d. B/octave or 20 d. B/decade. § Refer to Table 1. 2. on page 34 and Figs. 1. 23 and 1. 24. Further details are Oxfordin University Publishing E. provided Appendix Microelectronic Circuits by Adel S. Sedra and Kenneth C. Smith (0195323033)