
CHAPTER 1 Problem Solving and Critical Thinking Copyright

CHAPTER 1 Problem Solving and Critical Thinking Copyright © 2015, 2011, 2007 Pearson Education, Inc. Section 1. 2, Slide 1
Estimation, Graphs and Mathematical Models 1. 2 Copyright © 2015, 2011, 2007 Pearson Education, Inc. Section 1. 2, Slide 2
Objectives 1. Use estimation techniques to arrive at an approximate answer to a problem. 2. Apply estimation techniques to information given by graphs. 3. Develop mathematical models that estimate relationships between variables. Copyright © 2015, 2011, 2007 Pearson Education, Inc. Section 1. 2, Slide 3
Estimation The process of arriving at an approximate answer to a question. Methods of Estimation Rounding Numbers Using Graphs Using Mathematical Models Copyright © 2015, 2011, 2007 Pearson Education, Inc. Section 1. 2, Slide 4
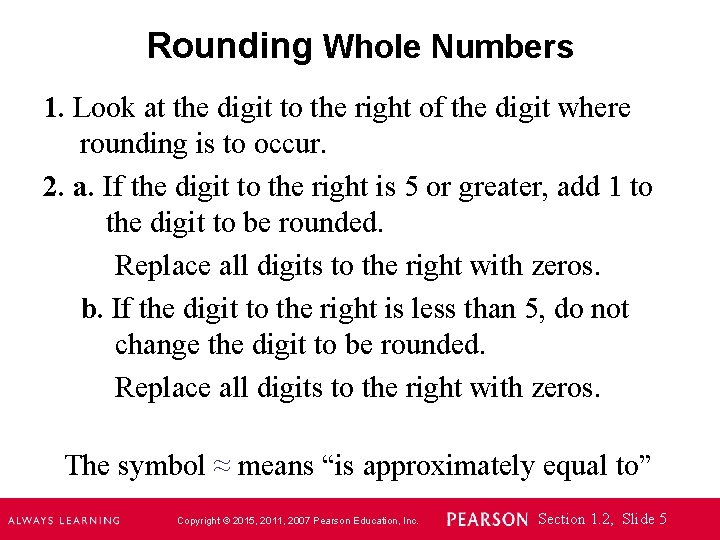
Rounding Whole Numbers 1. Look at the digit to the right of the digit where rounding is to occur. 2. a. If the digit to the right is 5 or greater, add 1 to the digit to be rounded. Replace all digits to the right with zeros. b. If the digit to the right is less than 5, do not change the digit to be rounded. Replace all digits to the right with zeros. The symbol ≈ means “is approximately equal to” Copyright © 2015, 2011, 2007 Pearson Education, Inc. Section 1. 2, Slide 5
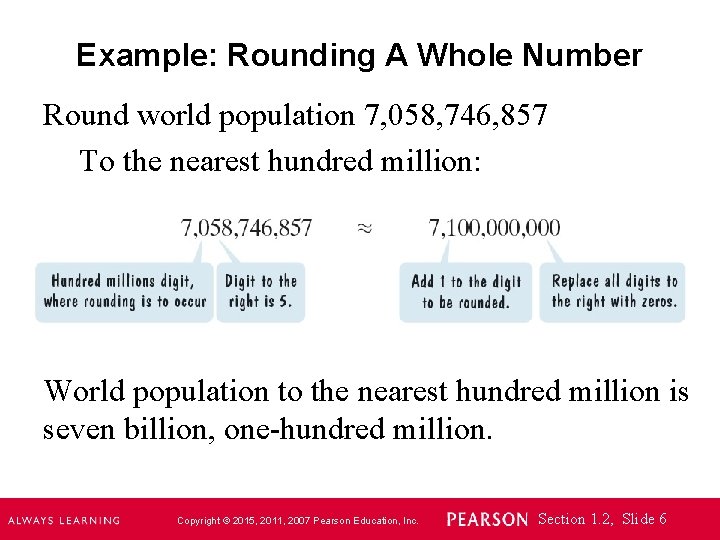
Example: Rounding A Whole Number Round world population 7, 058, 746, 857 To the nearest hundred million: World population to the nearest hundred million is seven billion, one-hundred million. Copyright © 2015, 2011, 2007 Pearson Education, Inc. Section 1. 2, Slide 6
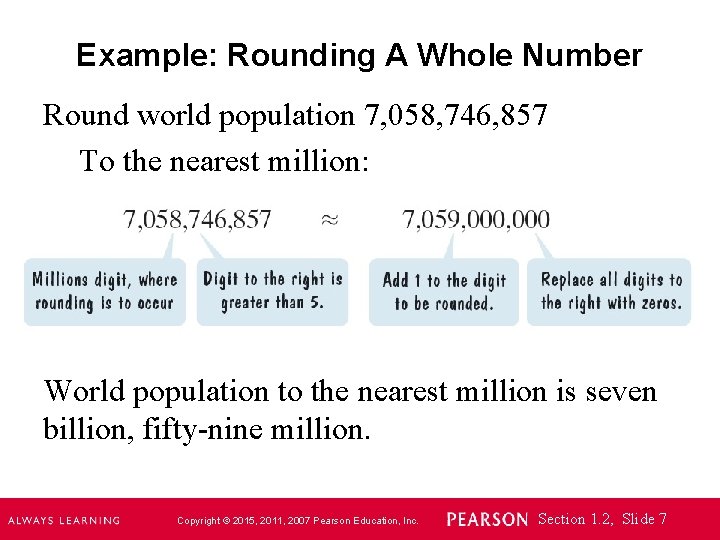
Example: Rounding A Whole Number Round world population 7, 058, 746, 857 To the nearest million: World population to the nearest million is seven billion, fifty-nine million. Copyright © 2015, 2011, 2007 Pearson Education, Inc. Section 1. 2, Slide 7
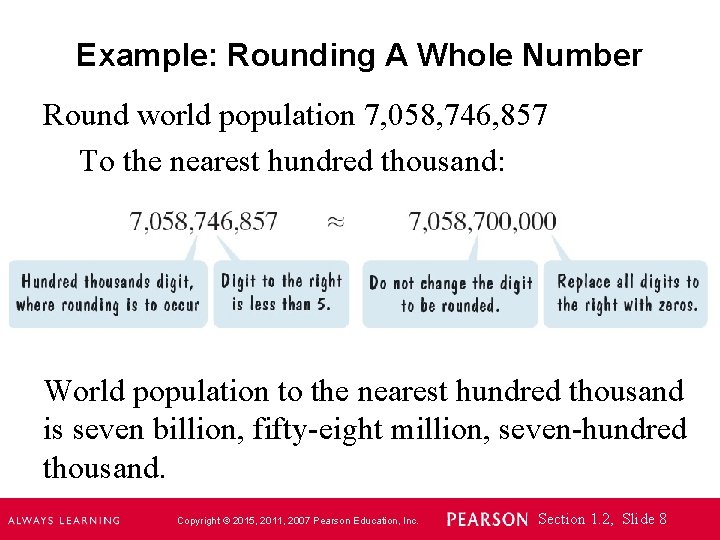
Example: Rounding A Whole Number Round world population 7, 058, 746, 857 To the nearest hundred thousand: World population to the nearest hundred thousand is seven billion, fifty-eight million, seven-hundred thousand. Copyright © 2015, 2011, 2007 Pearson Education, Inc. Section 1. 2, Slide 8
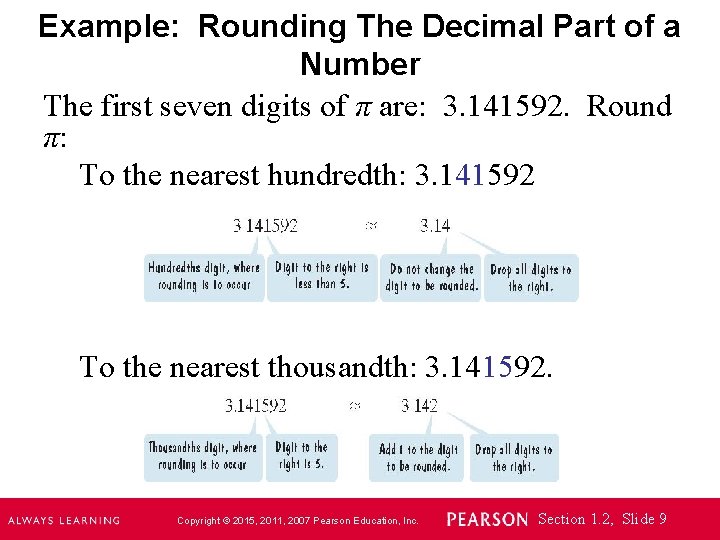
Example: Rounding The Decimal Part of a Number The first seven digits of π are: 3. 141592. Round π: To the nearest hundredth: 3. 141592 To the nearest thousandth: 3. 141592. Copyright © 2015, 2011, 2007 Pearson Education, Inc. Section 1. 2, Slide 9
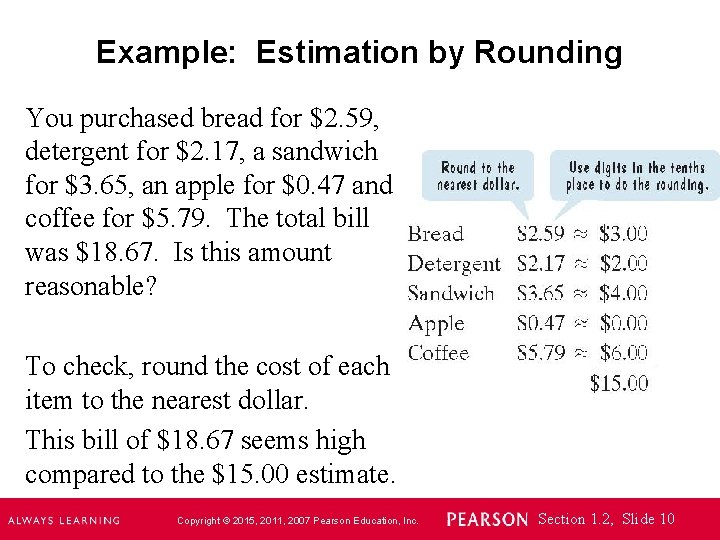
Example: Estimation by Rounding You purchased bread for $2. 59, detergent for $2. 17, a sandwich for $3. 65, an apple for $0. 47 and coffee for $5. 79. The total bill was $18. 67. Is this amount reasonable? To check, round the cost of each item to the nearest dollar. This bill of $18. 67 seems high compared to the $15. 00 estimate. Copyright © 2015, 2011, 2007 Pearson Education, Inc. Section 1. 2, Slide 10
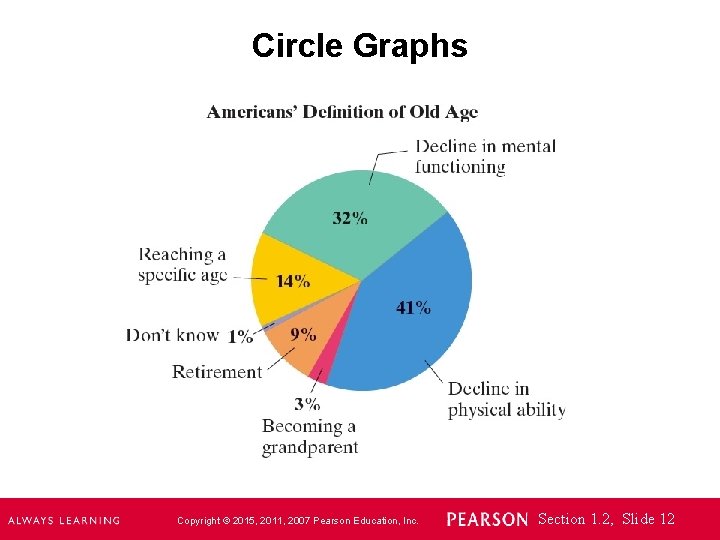
Circle Graphs Circle graphs, also called pie charts, show a whole quantity is divided into parts. Circle graphs are divided into pieces, called sectors. The figure (on the next slide) shows a circle graph that indicates how Americans disagree as to when “old age” begins. Copyright © 2015, 2011, 2007 Pearson Education, Inc. Section 1. 2, Slide 11
Circle Graphs Copyright © 2015, 2011, 2007 Pearson Education, Inc. Section 1. 2, Slide 12
Example: Applying Estimation Techniques to a Circle Graph According to the U. S. Census Bureau, in 2012, there were 229, 937, 770 Americans 20 years and older. Assuming the circle graph on the previous slide is representative of this age group, a. Use the appropriate information displayed by the graph to determine a calculation that shows the number of Americans 20 years and older who define old age by a decline in physical ability. b. Use rounding to find a reasonable estimate for this calculation. Copyright © 2015, 2011, 2007 Pearson Education, Inc. Section 1. 2, Slide 13
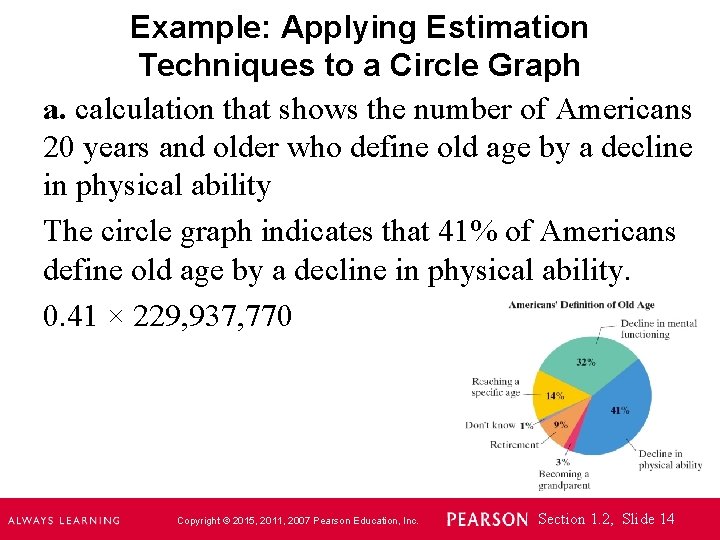
Example: Applying Estimation Techniques to a Circle Graph a. calculation that shows the number of Americans 20 years and older who define old age by a decline in physical ability The circle graph indicates that 41% of Americans define old age by a decline in physical ability. 0. 41 × 229, 937, 770 Copyright © 2015, 2011, 2007 Pearson Education, Inc. Section 1. 2, Slide 14

Example: Applying Estimation Techniques to a Circle Graph b. Use rounding to find a reasonable estimate for this calculation. 0. 41 × 229, 937, 770 Round 0. 41 to the nearest tenth. 0. 4 Round 229, 937, 700 to the nearest ten million. 230, 000 0. 4 × 230, 000 = 92, 000 Approximately 92, 000 Americans 20 years and older define old age by a decline in physical ability. Copyright © 2015, 2011, 2007 Pearson Education, Inc. Section 1. 2, Slide 15
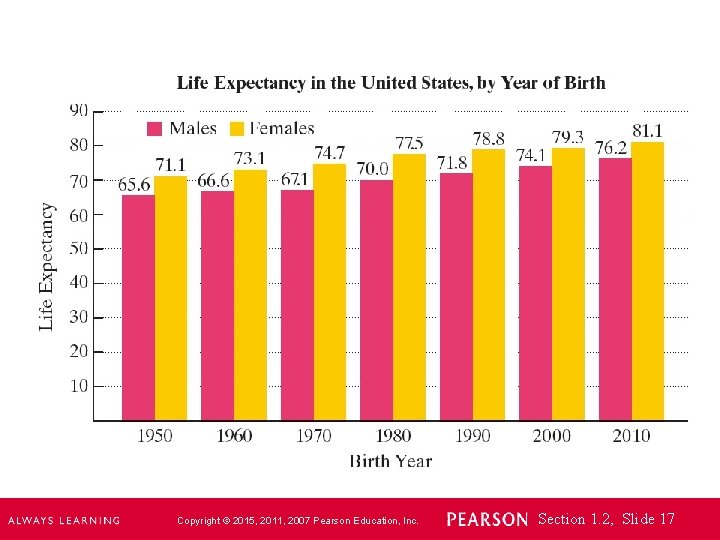
Estimation with Graphs: Bar Graphs Bar graphs use a vertical or horizontal bar to represent each item. The length of the bar determines the amount. We can use bar graphs to make predictions. The bar graph on the next slide shows the life expectancy in the United States by Year of Birth. Copyright © 2015, 2011, 2007 Pearson Education, Inc. Section 1. 2, Slide 16
Copyright © 2015, 2011, 2007 Pearson Education, Inc. Section 1. 2, Slide 17
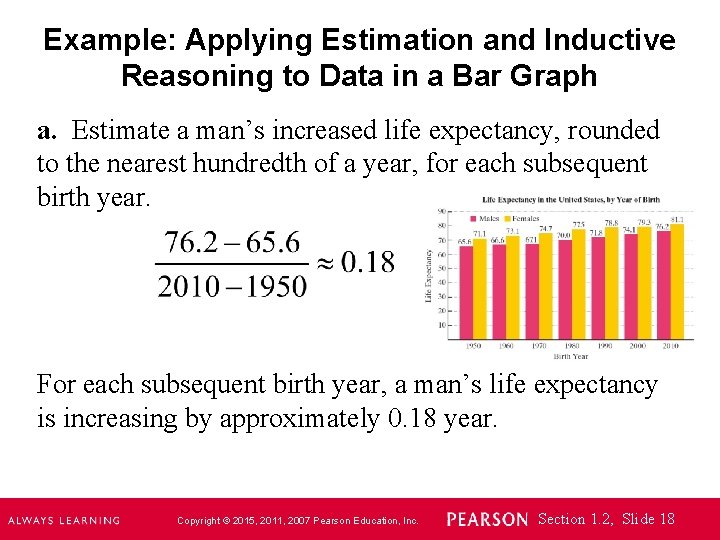
Example: Applying Estimation and Inductive Reasoning to Data in a Bar Graph a. Estimate a man’s increased life expectancy, rounded to the nearest hundredth of a year, for each subsequent birth year. For each subsequent birth year, a man’s life expectancy is increasing by approximately 0. 18 year. Copyright © 2015, 2011, 2007 Pearson Education, Inc. Section 1. 2, Slide 18
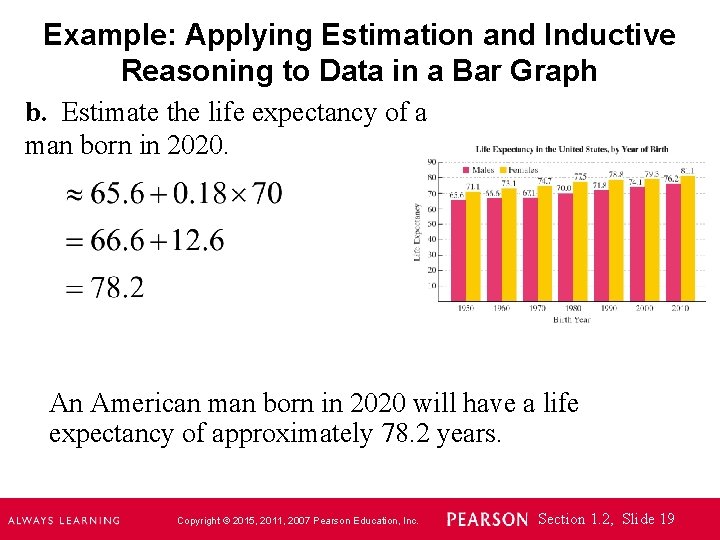
Example: Applying Estimation and Inductive Reasoning to Data in a Bar Graph b. Estimate the life expectancy of a man born in 2020. An American man born in 2020 will have a life expectancy of approximately 78. 2 years. Copyright © 2015, 2011, 2007 Pearson Education, Inc. Section 1. 2, Slide 19
Estimation with Graphs: Line Graphs Line graphs are often used to illustrate trends over time. Some measure of time, such as months or years, frequently appears on the horizontal axis. Amounts are generally listed on the vertical axis. Points are drawn to represent the given information. The graph is formed by connecting the points with line segments. Copyright © 2015, 2011, 2007 Pearson Education, Inc. Section 1. 2, Slide 20
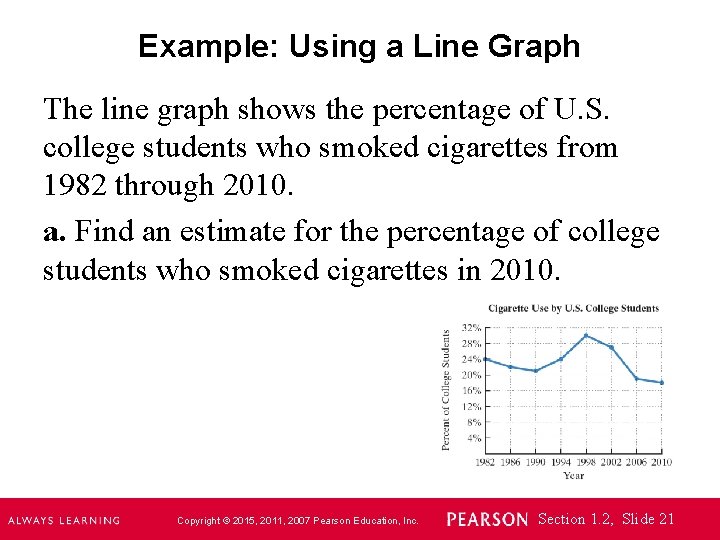
Example: Using a Line Graph The line graph shows the percentage of U. S. college students who smoked cigarettes from 1982 through 2010. a. Find an estimate for the percentage of college students who smoked cigarettes in 2010. Copyright © 2015, 2011, 2007 Pearson Education, Inc. Section 1. 2, Slide 21
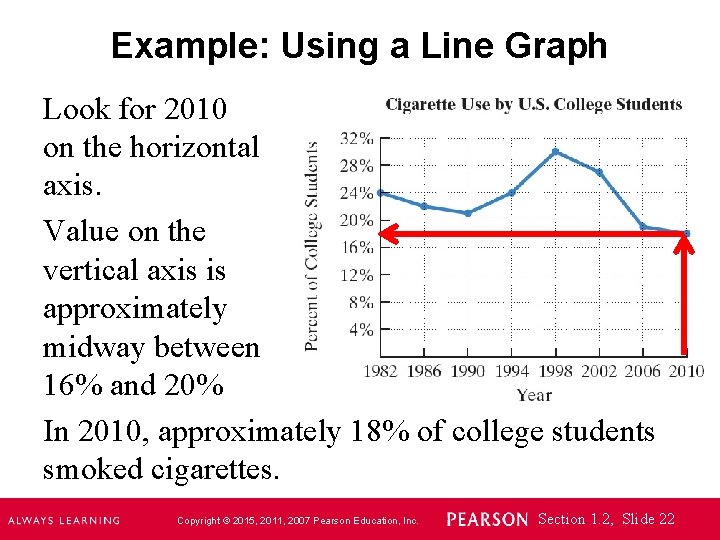
Example: Using a Line Graph Look for 2010 on the horizontal axis. Value on the vertical axis is approximately midway between 16% and 20% In 2010, approximately 18% of college students smoked cigarettes. Copyright © 2015, 2011, 2007 Pearson Education, Inc. Section 1. 2, Slide 22
Example: Using a Line Graph The line graph shows the percentage of U. S. college students who smoked cigarettes from 1982 through 2010. b. In which four-year period did the percentage of college students who smoked cigarettes decrease at the greatest rate? Copyright © 2015, 2011, 2007 Pearson Education, Inc. Section 1. 2, Slide 23
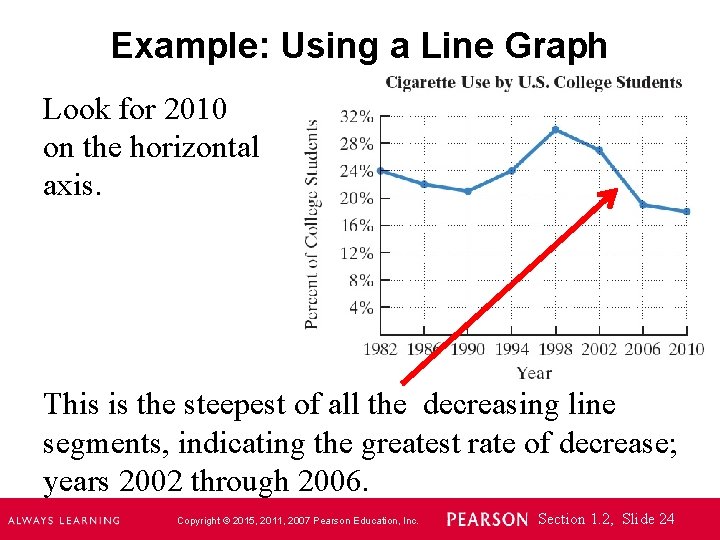
Example: Using a Line Graph Look for 2010 on the horizontal axis. This is the steepest of all the decreasing line segments, indicating the greatest rate of decrease; years 2002 through 2006. Copyright © 2015, 2011, 2007 Pearson Education, Inc. Section 1. 2, Slide 24
Example: Using a Line Graph The line graph shows the percentage of U. S. college students who smoked cigarettes from 1982 through 2010. c. In which year did 30% of college students smoke cigarettes? Copyright © 2015, 2011, 2007 Pearson Education, Inc. Section 1. 2, Slide 25
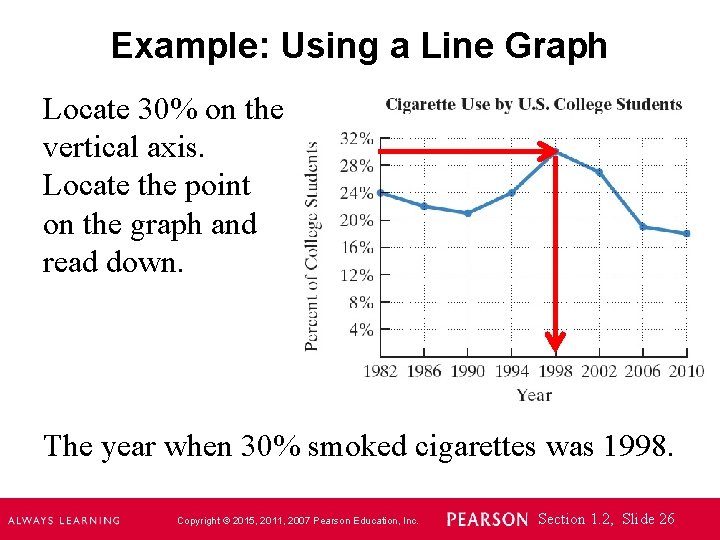
Example: Using a Line Graph Locate 30% on the vertical axis. Locate the point on the graph and read down. The year when 30% smoked cigarettes was 1998. Copyright © 2015, 2011, 2007 Pearson Education, Inc. Section 1. 2, Slide 26
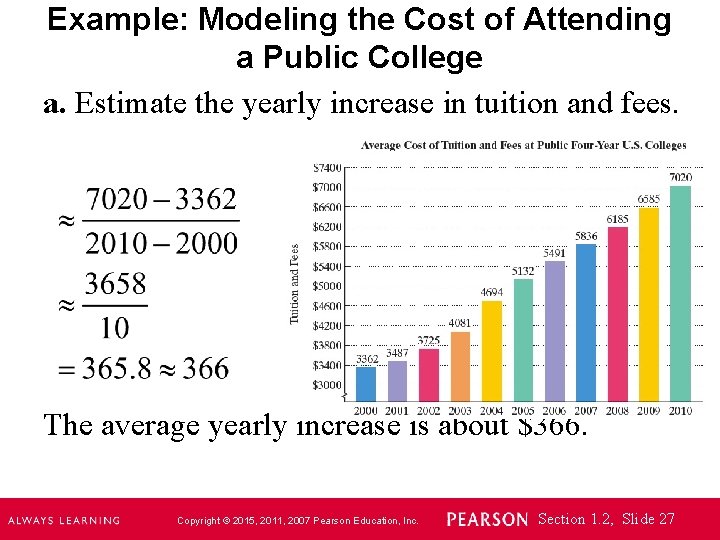
Example: Modeling the Cost of Attending a Public College a. Estimate the yearly increase in tuition and fees. The average yearly increase is about $366. Copyright © 2015, 2011, 2007 Pearson Education, Inc. Section 1. 2, Slide 27
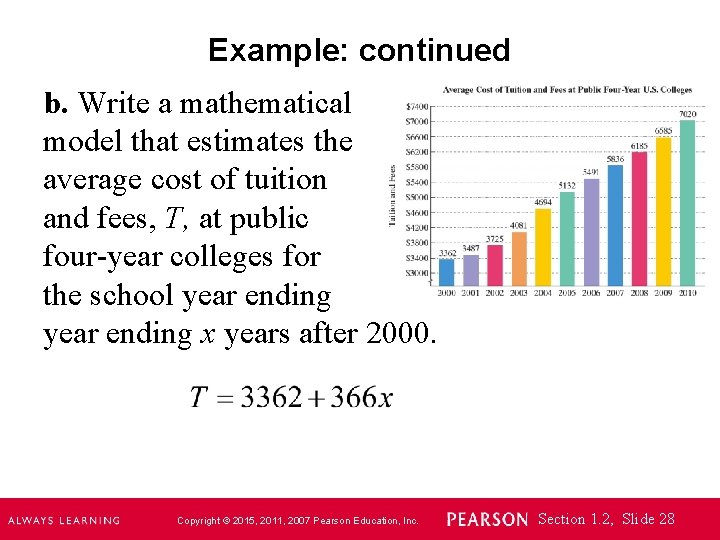
Example: continued b. Write a mathematical model that estimates the average cost of tuition and fees, T, at public four-year colleges for the school year ending x years after 2000. Copyright © 2015, 2011, 2007 Pearson Education, Inc. Section 1. 2, Slide 28
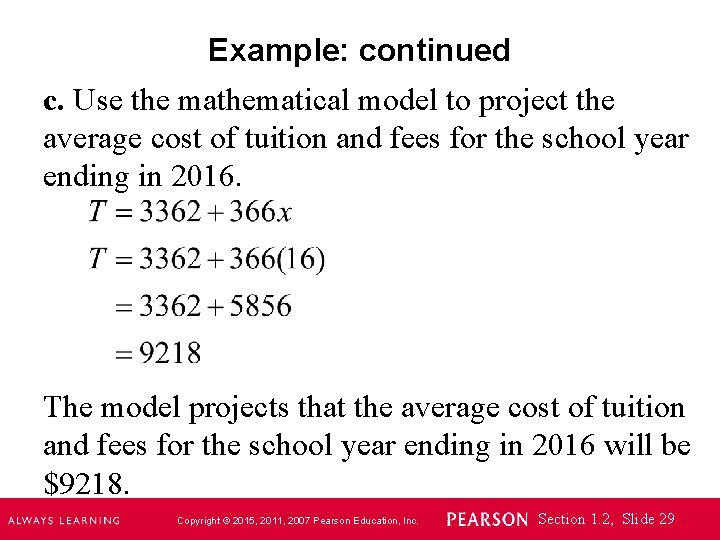
Example: continued c. Use the mathematical model to project the average cost of tuition and fees for the school year ending in 2016. The model projects that the average cost of tuition and fees for the school year ending in 2016 will be $9218. Copyright © 2015, 2011, 2007 Pearson Education, Inc. Section 1. 2, Slide 29
- Slides: 29