Chapter 1 Mean Median Mode Standard Deviation Shape


, Unusual features(are")


 Find the")


? Jan Which dotplot has the")


- Slides: 109
Chapter 1 Mean Median Mode Standard Deviation Shape Skew Outliers Stemplots Dot Plots Histograms Boxplots Descriptive Statistics
The Game of Greed
The Game of Greed PER 1 The distribution of Greed scores were slightly skewed to the right. The distribution had a mean score of 73. 3 which is slightly more than the median score of 71. 5. Out of the 26 students who played there were no outliers. Scored ranged from 25 up to 151.
The Game of Greed
The Game of Greed PER 2 The distribution of Greed scores had a fairly symmetric shape. The distribution had a mean score of 38. 4 which is just a tiny bit more than the median score of 38. Out of the 28 students who played there were no outliers. Scored ranged from 13 up to 60.
Quantitative vs Categorical Basically something that cannot be counted is categorical Something that can be counted is quantitative
Quantitative vs Categorical
Texting Ü Check your phone for the # of text messages you have sent since noon yesterday Ü Not Texts Received Ü Not Tweets Ü Just Texts Messages sent Ü If you have sent none, write zero Ü If you do not have a phone or its off or not with you, write N/A Ü Make sure to write down if you are a boy or girl
Texting Ü We will make a back-to-back stemplot comparing the boys and girls Ü We will calculate the summary statistics using 1 - variable stats on the calculator Ü We will check for outliers by constructing a boxplot on our calculator Ü We will compare the distributions(C. U. S. S. )
NFL CHALLENGE
NFL CHALLENGE As a group answer all questions on the NFL questionnaire You do not need to write the city name, just the mascot Example: Los Angeles Rams…. . . just write RAMS Use your cell phones Use Google, Find an NFL site, search for predictions, etc After the SUPER BOWL in Febuary, we will see who wins, . . . baseball cards awarded to best group. . . we will use this data in class later You have 15 minutes. . . GO
NFL CHALLENGE
The Game of Greed Ü The object of this game is to get the Highest Score you can after 5 rounds. Ü I will roll a 12 -sided die to give you points to start with. Ü After my initial roll, I will start rolling a 6 -sided die. You will add these points to your score. Ü BEWARE! If I roll a 2 you will lose all the points you have counted for that round. Ü You may sit down anytime and take the points you have earned for that round.
The Game of Greed Per 2
The Game of Greed Per 3
The Game of Greed Per 4
The Game of Greed Per 4
The Game of Greed Per 4
The Game of Greed Back-To-Back Stemplot
How old is our teacher? Ü Write down on a piece of paper the age you think Mr. Pines is. Ü Don’t ask anyone else, hide your answer, we will use this data in a few minutes.
How old is our teacher?
How old is our teacher?
How old is our teacher? Dot plot here Student Age Estimation for Mr. Pines n=108
How old is our teacher? Can you estimate the mean and median from the shape of the distribution? Mean = 36. 6 Median = 37 n=108
How old is our teacher? n=108 37 Mr. Pines actual age is…………………
How old is our teacher? Ü Describe the distribution. Center(mean and median), Unusual features(are there outliers? ), Shape(skewed left, symmetric, skewed n=108 right), Spread(max to min) Ü CUSS:
How old is our teacher? The distribution of age guesses are fairly symmetric, with a mean age guess of 36. 6 which slightly less than the median guess of 37. Students made six guesses that were considered outliers, they were 21, 22, 26, 27, and one at 50 years old. Guesses of Mr. Pines’ age ranged from 21 to 50 years old.
Histogram Mr. Pines Age Guesses
Histogram Skewed Right Skewed Left Symmetric Where do the mean and median lie in each histogram? A) Mean is greater than the Median B) Mean is less than the Median C) Mean and Median are the same
5# Summary Definition: The five-number summary of a distribution consists of the smallest observation, the first quartile, the median, the third quartile, and the largest observation, written in order from smallest to largest. Minimum Q 1 M Q 3 Maximum
Find the 5# Summary 1, 1, 6, 9, 13, 21, 35 Find the min, Q 1, Med, Q 3, Max n=7
Find the 5# Summary 2, 6, 22, 41, 15, 19 Find the min, Q 1, Med, Q 3, Max Let the Calculator do it! n =6
WE CANNOT USE THE CALCULATOR This is the 5# Summary Min Q 1 Med Q 3 Max 3 4 14 22 51 Check for outliers and construct a boxplot. Checking for outliers we use the formulas: Q 1 – 1. 5(IQR)…. . any number LOWER is an outlier Q 3 + 1. 5(IQR)…. . any number LARGER is an outlier IQR = Q 3 -Q 1 n =?
WE CANNOT USE THE CALCULATOR This is the 5# Summary Min Q 1 Med Q 3 Max 3 4 14 22 51 Check for outliers and construct a boxplot. n =?
WE CANNOT USE THE CALCULATOR This is the 5# Summary Min Q 1 Med Q 3 Max 3 4 14 22 51 Lets say that n = 20, tell me how many outliers there are? Give me the perfect answer.
Box Plot Shapes
Box Plots 25% Min Q 1 25% Q 2 25% Q 3 MAX
25% 25% Lets make up a 5#-summary Min Q 1 Med Q 3 Max 3 9 20 30 56 20 50% of the values are greater than _____ 75 _____% of the values are less than 30 50 _____% of the values are between 9 and 30 9 75% of the values are greater than _______
5# Summary Find the 5# summary for the following set of numbers 1, 4, 7, 12, 13, 21 First find the median(it is the one in the middle)
5# Summary Find the 5# summary for the following set of numbers 1, 4, 7, 12, 13, 21 Now Q 1 and Q 3 are the numbers in the middle below and above the Median The median cuts the set of numbers into two equal groups
5# Summary Find the 5# summary for the following set of numbers 1, 4, 7, 12, 13, 21 The Min and Max are the smallest and largest numbers.
5# Summary Find the 5# summary for the following set of numbers 1, 4, 7, 12, 13, 21 MIN Q 1 MEDIAN Q 3 MAX 1 4 12 13 21 This is the method for an ODD set of numbers
5# Summary Find the 5# summary for the following set of numbers 1, 4, 7, 12, 13, 21, 24 In an EVEN set of numbers there is no exact middle. The MEDIAN is the average of the two numbers in the middle. Q 1 and Q 3 are also found by taking the avg of the two numbers in the middle MIN Q 1 MEDIAN Q 3 MAX 1 5. 5 12. 5 17 24 This is the method for an EVEN set of numbers
Construct a Boxplot MIN Q 1 MEDIAN Q 3 MAX 1 5. 5 12. 5 17 24 First draw a number line that contains the numbers in your 5# summary 0 5 10 15 20 25
Construct a Boxplot MIN Q 1 MEDIAN Q 3 MAX 1 5. 5 12. 5 17 24 Next draw a rectangular box connecting Q 1 and Q 3 0 5 10 15 20 25
Construct a Boxplot MIN Q 1 MEDIAN Q 3 MAX 1 5. 5 12. 5 17 24 20 25 Place a vertical line for the MEDIAN 0 5 10 15
Construct a Boxplot MIN Q 1 MEDIAN Q 3 MAX 1 5. 5 12. 5 17 24 The MIN and MAX get small tic marks and connect to the box 0 5 10 15 20 25
Outliers in a boxplot MIN Q 1 MEDIAN Q 3 MAX 1 5. 5 12. 5 17 24 There are no outliers in this set of numbers, but what if the MAX was a bigger number like 36………how would this change our boxplot? 0 5 10 15 20 25
Outliers in a boxplot Do the following with the following numbers: 1) Find the 5#-Summary 2) Check for outliers 3) Create a boxplot 1, 4, 7, 12, 13, 21, 36
Outliers in a boxplot 1, 4, 7, 12, 13, 21, 36 Possible outlier MIN Q 1 MEDIAN Q 3 MAX 1 5. 5 12. 5 17 36 Checking for outliers we use the formulas: Q 1 – 1. 5(IQR)…. . any number LOWER is an outlier Q 3 + 1. 5(IQR)…. . any number LARGER is an outlier IQR = Q 3 -Q 1
Outliers in a boxplot 1, 4, 7, 12, 13, 21, 36 36 is an outlier The Outlier 36 is now considered the MAX but it is displayed with a circle. 0 5 10 15 20 25 30 35 40
Outliers in a boxplot 1, 4, 7, 12, 13, 21, 36 36 is an outlier The tail is now extended to the next highest number in the set which is 21. 0 5 10 15 20 25 30 35 40
Check for outliers 2, 5, 1, 3, 7, 8, 10, 12, 6, 8, 41 Checking for outliers we use the formulas: Q 1 – 1. 5(IQR)…. . any number LOWER is an outlier Q 3 + 1. 5(IQR)…. . any number LARGER is an outlier IQR = Q 3 -Q 1
Check for Outliers on calculator 2, 5, 1, 3, 7, 8, 10, 12, 6, 8, 41 Put the numbers in a list(L 1) and do a boxplot
5# Summary of Histogram
5# Summary of Histogram 10 8 6 4 3 1 1 n=33
Half of 33 is 16. 5 so the median falls in the “ 6” column Half of 16. 5 is 8. 25 which makes Q 1 in the “ 4” column On the other half Q 3 falls in the “ 7” column 10 8 6 4 3 1 1 n=33
The 5#-Summary becomes 0, 4, 6, 7, 7 10 8 6 4 3 1 1 n=33
This can be done on the calculator by putting the column numbers in L 1 and the frequency counts in L 2. 10 8 6 4 3 1 1 n=33
This can be done on the calculator by putting the column numbers in L 1 and the frequency counts in L 2. Next hit the “STAT” button, right arrow to “CALC”, select 1: 1 -Var Stats
This can be done on the calculator by putting the column numbers in L 1 and the frequency counts in L 2. Typel L 1, L 2 It should look like this: 1 -Var Stats L 1, L 2
This can be done on the calculator by putting the column numbers in L 1 and the frequency counts in L 2. 5#-Summary
This can be done on the calculator by putting the column numbers in L 1 and the frequency counts in L 2. You can also do a boxplot to get the 5#-summary Because our data is in two columns you need to change the frequency to L 2
This can be done on the calculator by putting the column numbers in L 1 and the frequency counts in L 2.
Variability and Spread Which dotplot has the highest variability(spread)? Jan Which dotplot has the lowest variability(spread)? July
Variability and Spread Which dotplot has the largest Standard Deviation? Jan Which dotplot has the smallest Standard Deviation? July
Percentiles In the July dotplot, estimate the percentile for the dot at 86. 49/51 =. 9608 so 86 is at the 96 th percentile. 86 is the 49 th dot out of 51 dots
Box Plots Mr. Pines caught lots of waves this past summer, such a bummer school had to start. But the good news is, now his AP Statistics students can calculate his surf stats for him.
Box Plots Mr. Pines caught lots of waves this past summer, such a bummer school had to start. But the good news is, now his AP Statistics students can calculate his surf stats for him.
Box Plots Mr. Pines caught lots of waves this past summer, such a bummer school had to start. But the good news is, now his AP Statistics students can calculate his surf stats for him.
Box Plots Mr. Pines caught lots of waves this past summer, such a bummer school had to start. But the good news is, now his AP Statistics students can calculate his surf stats for him.
Create a Box Plot Here are the number of waves Mr. Pines caught for 40 surfing sessions this past summer. 4 3 35 16 20 15 17 13 18 12 20 10 20 11 7 16 13 9 21 17 9 15 1 9 2 3 5 8 3 5 6 7 8 6 5 21 12 24 2 10
Create a Box Plot Here are the number of waves Mr. Pines caught for 40 surfing sessions this past summer. 4 3 35 16 20 15 17 13 18 12 20 10 20 11 7 16 13 9 21 17 9 15 1 9 2 3 5 8 3 5 6 7 8 6 5 21 12 24 2 10 Find the 5# Summary Min, Q 1, Median(Q 2), Q 3, Max
Create a Box Plot Here are the number of waves Mr. Pines caught for 40 surfing sessions this past summer. 4 3 35 16 20 15 17 13 18 12 20 10 20 11 7 16 13 9 21 17 9 15 1 9 2 3 5 8 3 5 6 7 8 6 5 21 12 24 2 10 Sometimes putting the numbers in a stemplot makes finding the Medians faster. Split the stems for this stemplot
Stemplot
Create a Box Plot Here are the number of waves Mr. Pines caught for 40 surfing sessions this past summer. 4 3 35 16 20 15 17 13 18 12 20 10 20 11 7 16 13 9 21 17 9 15 1 9 2 3 5 8 3 5 6 7 8 6 5 21 12 24 2 10 Find the 5# Summary
Create a Box Plot Here are the number of waves Mr. Pines caught for 40 surfing sessions this past summer. 4 3 35 16 20 15 17 13 18 12 20 10 20 11 7 16 13 9 21 17 9 15 1 9 2 3 5 8 3 5 6 7 8 6 5 21 12 24 2 10 Are there outliers?
Create a Box Plot Here are the number of waves Mr. Pines caught for 40 surfing sessions this past summer. 4 3 35 16 20 15 17 13 18 12 20 10 20 11 7 16 13 9 21 17 9 15 1 9 2 3 5 8 3 5 6 7 8 6 5 21 12 24 2 10 To check for low outlier: Q 1 -1. 5(IQR)……any number lower is considered an outlier
Create a Box Plot Here are the number of waves Mr. Pines caught for 40 surfing sessions this past summer. 4 3 35 16 20 15 17 13 18 12 20 10 20 11 7 16 13 9 21 17 9 15 1 9 2 3 5 8 3 5 6 7 8 6 5 21 12 24 2 10 To check for high outlier: Q 3+1. 5(IQR)……any number higher is considered an outlier
Create a Box Plot Here are the number of waves Mr. Pines caught for 40 surfing sessions this past summer.
Boxplot Construct a boxplot for the “guess the age of Mr. Pines data” n=130
Histogram Lets make a histogram for the number of minutes of each summer surf session. 40 20 80 45 65 48 48 62 50 48 70 49 61 49 50 48 60 47 61 55 57 51 45 45 15 15 30 50 45 45 40 50 60 45 20 75 45 75 20 60
Histogram 40 20 80 45 65 48 48 62 50 48 70 49 61 49 50 48 60 47 61 55 57 51 45 45 15 15 30 50 45 45 40 50 60 45 20 75 45 75 20 60 We need to choose the x-axis increments, the one you choose may be different than someone else’s.
Histogram 40 20 80 45 65 48 48 62 50 48 70 49 61 49 50 48 60 47 61 55 57 51 45 45 15 15 30 50 45 45 40 50 60 45 20 75 45 75 20 60 Before you start on your histogram, you MUST make a frequency table!
Frequency Table Range 0 -14 min 15 -29 min 30 -44 min 45 -59 min 60 -74 min 75 -89 min # of occurences
There are 19 observations in a data set. 5 # Summary…(1, 2, 4, 5, 8) Ü How many observations are less than 4? Ü 5 to 9 ÜHOW? Ü 1, 2, 2, 4, 4, 4, 5, 5, 8
There are 8 observations in a data set. 5 # Summary…(1, 2, 6, 20, 21) Ü Is it possible that there is no observation equal to 6? ÜWhy? Ü 1, 2, 2, 2, 10, 20, 21
Percentile What percentile was the day which reached 86 degrees in July?
Standard Deviation Ü Standard deviation is a measure of spread. Ü The easiest definition I can give you is that the standard deviation is the average distance the numbers in the set are from the mean. Ü If all the numbers are the same the standard deviation would be zero. Ü Standard Deviation is CONSISTENCY!. . . are the #’s close to each other or very spread out?
Standard Deviation Ü If the numbers in a set are all very close together(low variability) the standard deviation will be small Ü If the numbers in the set are very spread out(high variability) the standard deviation will be large. Ü Standard Deviation is NOT resistant to outliers, an outlier in either direction will make the standard deviation larger.
Standard Deviation
Resistant Vs. Nonresistant
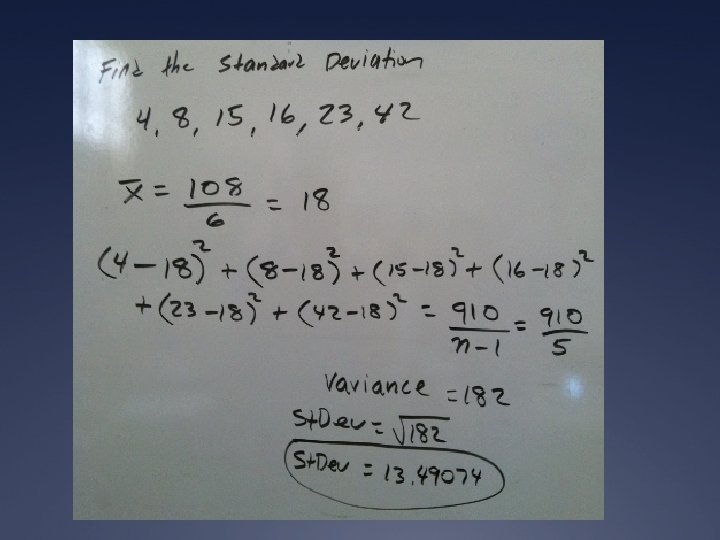
Find the Standard Deviation of “The Numbers”
Use your calculator as much as possible Hit the Stat Button, then hit 1: Edit, then enter the numbers
Use your calculator as much as possible Hit the Stat Button again, then use the right arrow to get to Calc, then hit 1: 1 var stats, then hit the 2 nd button and then L 1(#1 key) Hit Enter
Use your calculator as much as possible Standard Deviation
Standard Deviation Both histograms have the same mean and median. Which one has the smallest standard deviation?
Standard Deviation Histogram “a” has more data clustered around its center. Which gives it less variability, which results in a SMALLER Standard Deviation.
Standard Deviation Histogram “b” has more data away from the center. It has two clusters with almost a gap in the middle. Which gives it more variability, which results in a LARGER Standard Deviation.
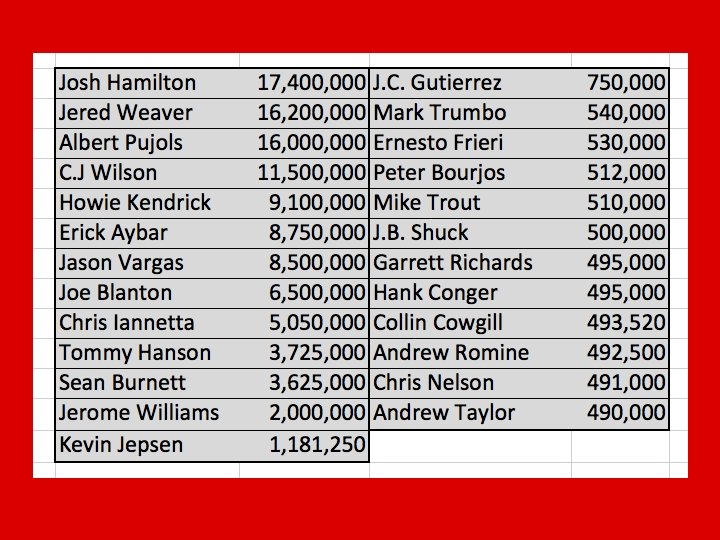
LA Angels 2013 Salaries
What shape will these salaries form?
If you wanted to convince someone that the LA Angels are overpaid, would you show them the median salary or mean salary? Explain?
Strong Skew to the right, so the mean is greater than the median. The huge salaries pull the mean to the right. The mean is non resistant.
Another view of the shape from a histogram, clearly skewed to the right.
Mean Salary: $4, 633, 200 Median Salary: $1, 181, 250