Chapter 1 Introduction to Statistics Statistics A set


 is a single measurement or")


 • In an experiment, one variable is manipulated to create treatment")


 • Because these studies do not use the")
 • Psychological variables –")


- Slides: 36
Chapter 1: Introduction to Statistics
Statistics • A set of methods and rules for organizing, summarizing, and interpreting information. 2
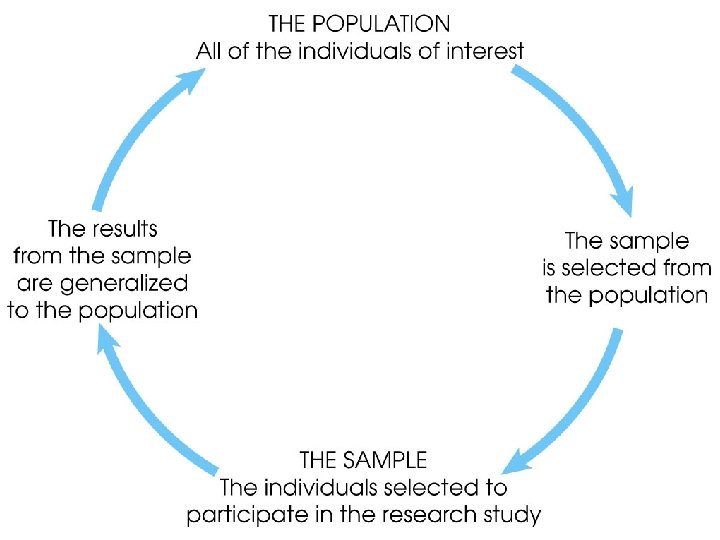
Population • The set of all individuals of interest in a particular study. 3
Sample • A set of individuals selected from a population, usually intended to represent the population in a study. 4
Variables • A variable is a characteristic or condition that can change or take on different values.
Data • Measurements or observations – A datum (singular) is a single measurement or observation. – A data set (or the data) is a collection of measurements or observations. 7
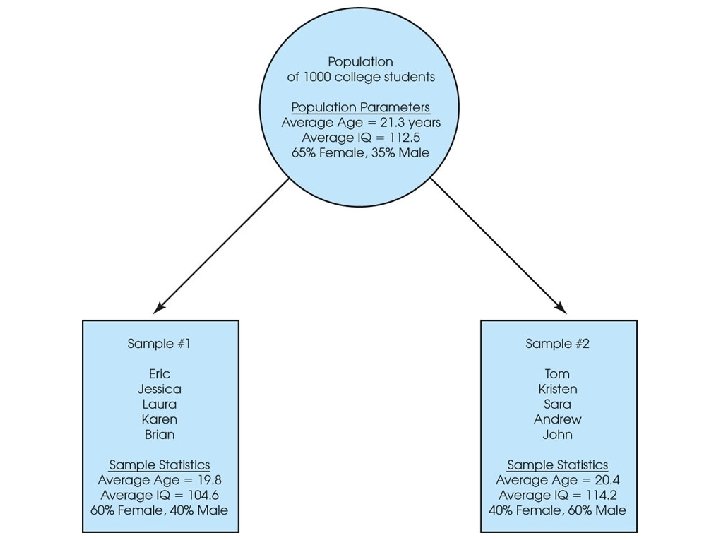
Parameter • A value, usually a numerical value, that describes a population. A parameter may be obtained from a single measurement or it may be derived from a set of measurements from the population. 8
Statistic • A value, usually a numerical value, that describes a sample. A statistic may be obtained from a single measurement, or it may be derived from a set of measurements from the sample. 9
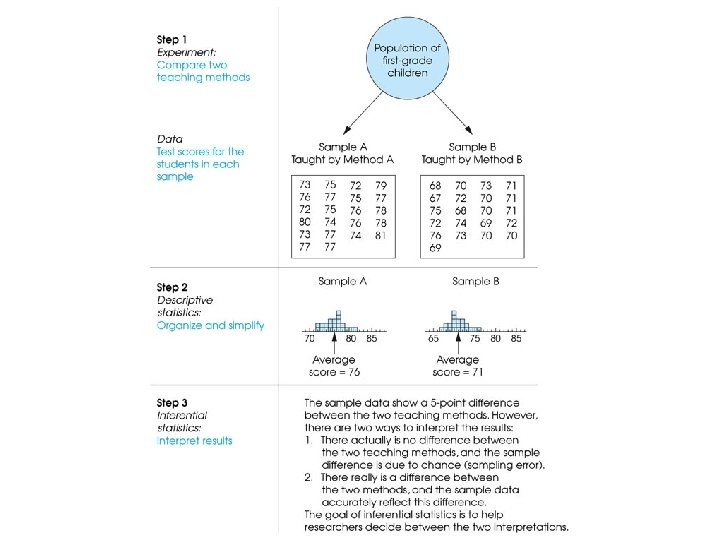
Group statistical procedures into 2 categories: • Descriptive statistics – Procedure to summarize, organize, and simplify data. • Inferential Statistics – Techniques that allow us to study samples and then make generalizations about the populations from which they came. 10
Sampling Error • The discrepancy, or amount of error, that exists between a sample statistic and the corresponding population parameter. 11
Research Designs or Types of Research Studies • Most research designed to investigate the relationship between 2 or more variables. • Violence on TV and Aggressive Behaviors • Amount of Sleep and GPA • Level of violence at home and level of selfesteem
• Correlation Method • Experimental Method • Quasi-Experimental Method 15
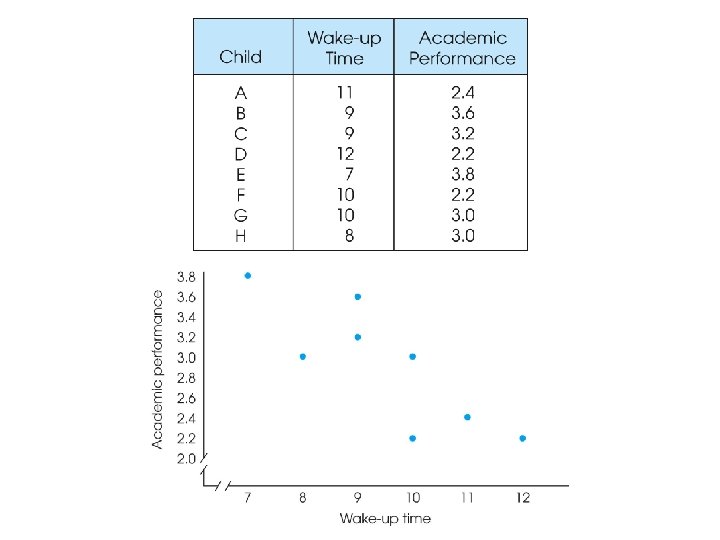
Correlational Studies • The goal of a correlational study is to determine whethere is a relationship between two variables and to describe the relationship. • A correlational study simply observes the two variables as they exist naturally.
Experiments • The goal of an experiment is to demonstrate a cause-and-effect relationship between two variables; that is, to show that changing the value of one variable causes changes to occur in a second variable.
Experiments (cont. ) • In an experiment, one variable is manipulated to create treatment conditions. A second variable is observed and measured to obtain scores for a group of individuals in each of the treatment conditions. The measurements are then compared to see if there are differences between treatment conditions. All other variables are controlled to prevent them from influencing the results. • In an experiment, the manipulated variable is called the independent variable and the observed variable is the dependent variable.
Treatment groups 70 degree room 90 degree room Test of performance Recall list of words Any difference? 21
Confounding variable Professor Smith Professor Jones Independent variable Lecture section Lecture with lab Dependent variable Final exam score Any difference? 22
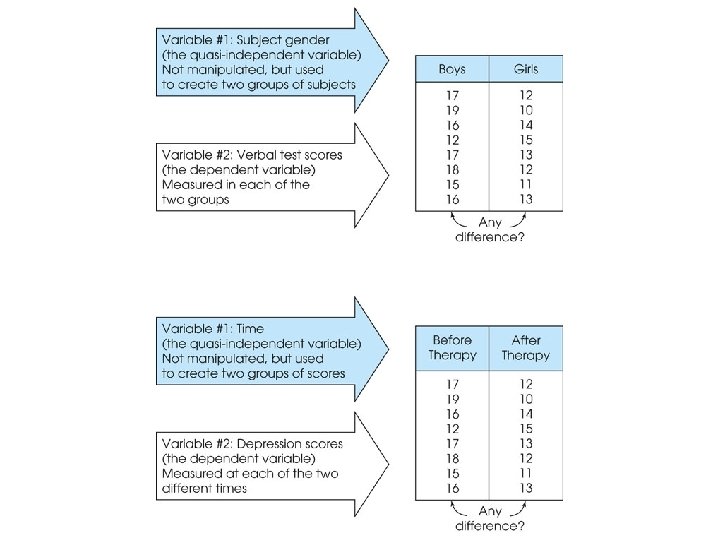
Other Types of Studies • Other types of research studies, know as nonexperimental or quasi-experimental, are similar to experiments because they also compare groups of scores. • These studies do not use a manipulated variable to differentiate the groups. Instead, the variable that differentiates the groups is usually a pre-existing participant variable (such as male/female) or a time variable (such as before/after).
Other Types of Studies (cont. ) • Because these studies do not use the manipulation and control of true experiments, they cannot demonstrate cause and effect relationships. As a result, they are similar to correlational research because they simply demonstrate and describe relationships.
Variables and Measurement • Well-defined variables (e. g. height, weight) • Psychological variables – internal attributes or characteristics (e. g. intelligence, selfesteem, or memory) – not observable • Psychological constructs • Operational Definition – define construct in terms of operations that measure behavior 26
Types of Variables • Variables can be classified as discrete or continuous. • Discrete variables (such as class size) consist of indivisible categories, and continuous variables (such as time or weight) are infinitely divisible into whatever units a researcher may choose. For example, time can be measured to the nearest minute, second, half-second, etc.
Variables • Discrete Variable – Dice roll – Class attendance – Number of children • Continuous Variable – Temperature – Weight – IQ test scores 28
Fig. 1 -8, p. 19
Measuring Variables • To establish relationships between variables, researchers must observe the variables and record their observations. This requires that the variables be measured. • The process of measuring a variable requires a set of categories called a scale of measurement and a process that classifies each individual into one category.
Scales of Measurement • Qualitative – categorized events • Quantitative – use numbers to categorize size of event 31
4 Types of Measurement Scales 1. A nominal scale is an unordered set of categories identified only by name. Nominal measurements only permit you to determine whether two individuals are the same or different. 2. An ordinal scale is an ordered set of categories. Ordinal measurements tell you the direction of difference between two individuals.
33
4 Types of Measurement Scales 3. An interval scale is an ordered series of equal-sized categories. Interval measurements identify the direction and magnitude of a difference. The zero point is located arbitrarily on an interval scale. 4. A ratio scale is an interval scale where a value of zero indicates none of the variable. Ratio measurements identify the direction and magnitude of differences and allow ratio comparisons of measurements.
Notation • The individual measurements or scores obtained for a research participant will be identified by the letter X (or X and Y if there are multiple scores for each individual). • The number of scores in a data set will be identified by N for a population or n for a sample. • Summing a set of values is a common operation in statistics and has its own notation. The Greek letter sigma, Σ, will be used to stand for "the sum of. " For example, ΣX identifies the sum of the scores.
Order of Operations 1. All calculations within parentheses are done first. 2. Squaring or raising to other exponents is done second. 3. Multiplying, and dividing are done third, and should be completed in order from left to right. 4. Summation with the Σ notation is done next. 5. Any additional adding and subtracting is done last and should be completed in order from left to right.