Chapter 1 Introduction 1 1 Analyzing Categorical Data


- Slides: 10
Chapter 1 Introduction & 1. 1: Analyzing Categorical Data
Introduction Data Analysis: Making Sense of Data After this section, you should be able to… ü DEFINE “Individuals” and “Variables” ü DISTINGUISH between “Categorical” and “Quantitative” variables ü DEFINE “Distribution” ü DESCRIBE the idea behind “Inference”
What is the Study of Statistics? ! • Statistics is the science of data. • In this course we study four different aspects of statistics: – Data Analysis (Chapters 1 to 3) • The process of organizing, displaying, summarizing, and asking questions about data. – Data Collection (Chapter 4) • The process of conducting and interpreting surveys and experiments. – Anticipating Patterns/Probability (Chapter 5 to 7) • The process of using probability and chance to explain natural phenomena. – Inference (Chapter 8 to 12) • The process of making predications and evaluations about a population from a sample.
Population Sample Make an inference about the population. Collect data from a representative sample. . . Perform Data Analysis, keeping probability in mind…
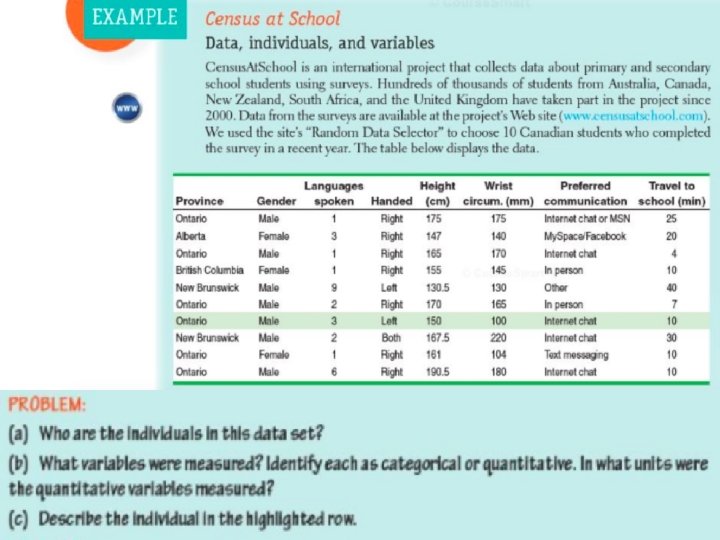
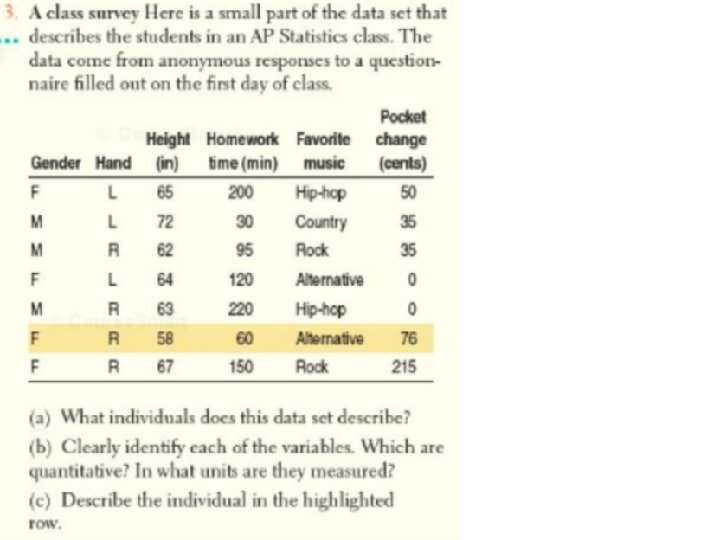
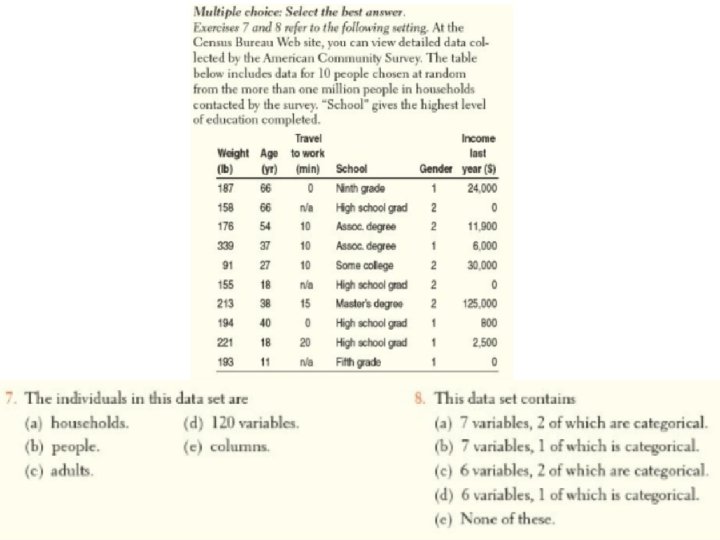
Variable - any characteristic of an individual or object Categorical Variable - Usually an adjective - Rarely a number Examples: - Gender - Race - Grade in School (Sophomore, Jr. , Sr. ) - Zip Code Quantitative Variable - Always a number - Must be able to find the mean of the numbers Examples: - Weight - Height - GPA - # of AP Classes taken - Square footage
Distribution • Distribution: describes what values a variable takes and how often it takes those values • Essentially “distribution” replaces the words “data” or “graph”. • The median of the distribution is 28. • The distribution is skewed left. Dotplot of MPG Distribution
• Practice