
CHAPTER 1 BLOOD AND MARROW TRANSPLANTATION Editors Dr
CHAPTER 1 BLOOD AND MARROW TRANSPLANTATION Editors: Dr Alan Teh Kee Hean Prof Dr Chan Lee Expert Panel: Dr Alan Teh Kee Hean (co-chairperson) Prof Dr Chan Lee (co-chairperson) Prof Dr Gan Gin Dr Hishamshah Mohd Ibrahim Prof Dr S. Fadilah Abdul Wahid Dr Ong Tee Chuan
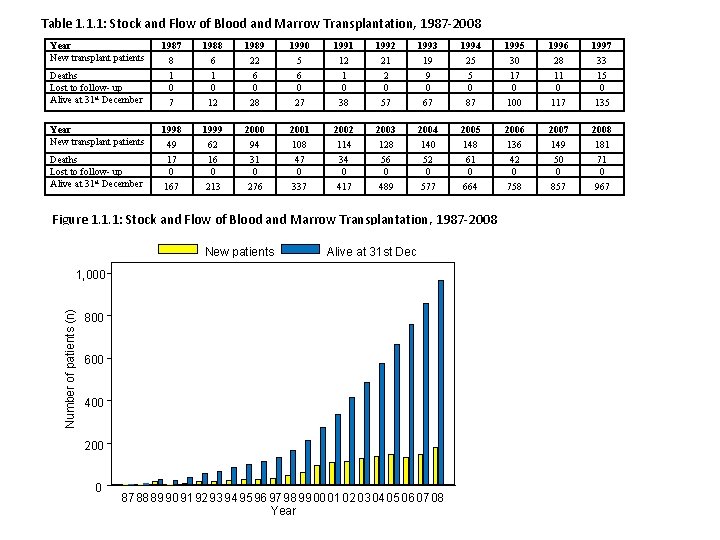
Table 1. 1. 1: Stock and Flow of Blood and Marrow Transplantation, 1987 -2008 Year New transplant patients 1987 1988 1989 1990 1991 1992 1993 1994 1995 1996 1997 8 6 22 5 12 21 19 25 30 28 33 Deaths Lost to follow- up Alive at 31 st December 1 0 6 0 1 0 2 0 9 0 5 0 17 0 11 0 15 0 7 12 28 27 38 57 67 87 100 117 135 Year New transplant patients 1998 1999 2000 2001 2002 2003 2004 2005 2006 2007 2008 49 62 94 108 114 128 140 148 136 149 181 Deaths Lost to follow- up Alive at 31 st December 17 0 16 0 31 0 47 0 34 0 56 0 52 0 61 0 42 0 50 0 71 0 167 213 276 337 417 489 577 664 758 857 967 Figure 1. 1. 1: Stock and Flow of Blood and Marrow Transplantation, 1987 -2008 New patients Alive at 31 st Dec Number of patients (n) 1, 000 800 600 400 200 0 87 88 89 90 91 92 93 94 95 96 97 98 99 00 01 02 03 04 05 06 07 08 Year
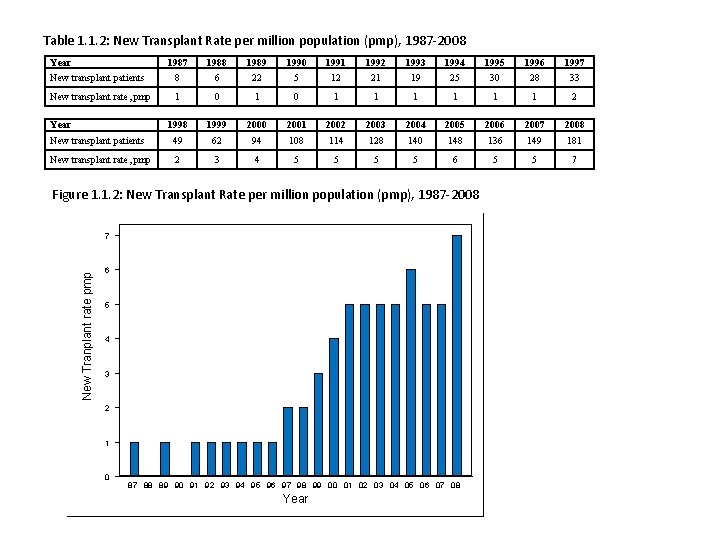
Table 1. 1. 2: New Transplant Rate per million population (pmp), 1987 -2008 Year 1987 1988 1989 1990 1991 1992 1993 1994 1995 1996 1997 New transplant patients 8 6 22 5 12 21 19 25 30 28 33 New transplant rate, pmp 1 0 1 1 1 2 Year 1998 1999 2000 2001 2002 2003 2004 2005 2006 2007 2008 New transplant patients 49 62 94 108 114 128 140 148 136 149 181 New transplant rate, pmp 2 3 4 5 5 6 5 5 7 Figure 1. 1. 2: New Transplant Rate per million population (pmp), 1987 -2008 New Tranplant rate pmp 7 6 5 4 3 2 1 0 87 88 89 90 91 92 93 94 95 96 97 98 99 00 01 02 03 04 05 06 07 08 Year
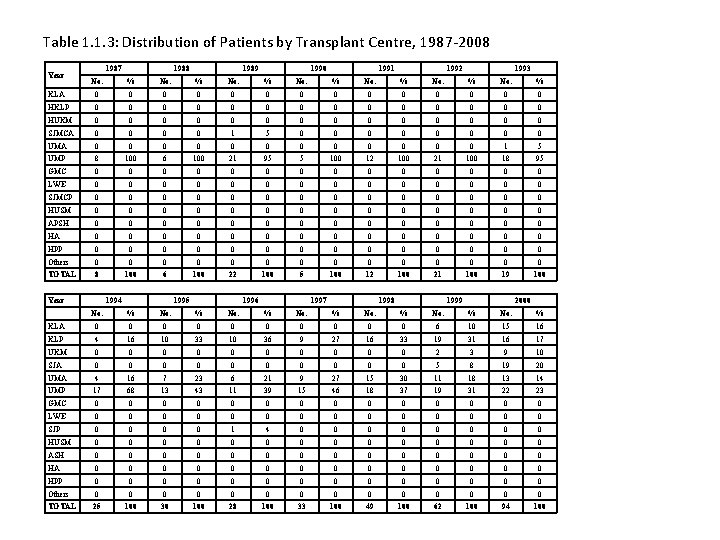
Table 1. 1. 3: Distribution of Patients by Transplant Centre, 1987 -2008 Year 1987 1988 1989 1990 1991 1992 1993 No. % No. % KLA 0 0 0 0 HKLP 0 0 0 0 HUKM 0 0 0 0 SJMCA 0 0 1 5 0 0 0 0 UMA 0 0 0 1 5 UMP 8 100 6 100 21 95 5 100 12 100 21 100 18 95 GMC 0 0 0 0 LWE 0 0 0 0 SJMCP 0 0 0 0 HUSM 0 0 0 0 APSH 0 0 0 0 HA 0 0 0 0 HPP 0 0 0 0 Others 0 0 0 0 TOTAL 8 100 6 100 22 100 5 100 12 100 21 100 19 100 1994 Year 1995 1996 1997 1998 1999 2000 No. % No. % KLA 0 0 0 0 0 6 10 15 16 KLP 4 16 10 33 10 36 9 27 16 33 19 31 16 17 UKM 0 0 0 0 0 2 3 9 10 SJA 0 0 0 0 0 5 8 19 20 UMA 4 16 7 23 6 21 9 27 15 30 11 18 13 14 UMP 17 68 13 43 11 39 15 46 18 37 19 31 22 23 GMC 0 0 0 0 LWE 0 0 0 0 SJP 0 0 1 4 0 0 0 0 HUSM 0 0 0 0 ASH 0 0 0 0 HA 0 0 0 0 HPP 0 0 0 0 Others 0 0 0 0 TOTAL 25 100 30 100 28 100 33 100 49 100 62 100 94 100
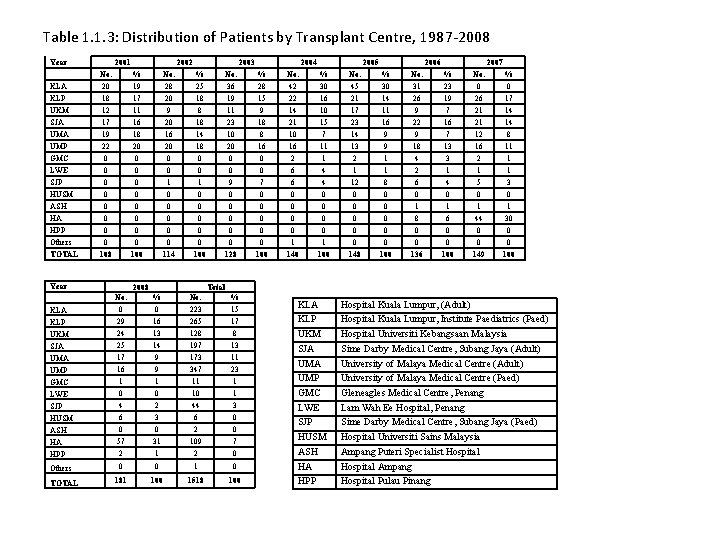
Table 1. 1. 3: Distribution of Patients by Transplant Centre, 1987 -2008 Year KLA KLP UKM SJA UMP GMC LWE SJP HUSM ASH HA HPP Others TOTAL Year 2001 No. 20 18 12 17 19 22 0 0 0 0 108 2002 % 19 17 11 16 18 20 0 0 0 0 100 No. 28 20 9 20 16 20 0 0 114 2003 % 25 18 8 18 14 18 0 0 1 0 0 0 100 2008 No. 36 19 11 23 10 20 0 0 9 0 0 0 128 KLA KLP UKM SJA UMP GMC LWE SJP % 0 16 13 14 9 9 1 0 2 No. 223 265 128 197 173 347 11 10 44 % 15 17 8 13 11 23 1 1 3 HUSM ASH HA HPP 6 0 57 2 3 0 31 1 6 2 109 2 0 0 7 0 TOTAL No. 42 22 14 21 10 16 2 6 6 0 0 1 140 2005 % 30 16 10 15 7 11 1 4 4 0 0 1 100 No. 45 21 17 23 14 13 2 1 12 0 0 0 148 2006 % 30 14 11 16 9 9 1 1 8 0 0 0 100 No. 31 26 9 22 9 18 4 2 6 0 1 8 0 0 136 2007 % 23 19 7 16 7 13 3 1 4 0 1 6 0 0 100 No. 0 26 21 21 12 16 2 1 5 0 1 44 0 0 149 % 0 17 14 14 8 11 1 1 3 0 1 30 0 0 100 Total No. 0 29 24 25 17 16 1 0 4 Others 2004 % 28 15 9 18 8 16 0 0 7 0 0 0 100 0 0 181 100 1518 100 KLA KLP UKM SJA UMP GMC LWE SJP HUSM ASH HA HPP Hospital Kuala Lumpur, (Adult) Hospital Kuala Lumpur, Institute Paediatrics (Paed) Hospital Universiti Kebangsaan Malaysia Sime Darby Medical Centre, Subang Jaya (Adult) University of Malaya Medical Centre (Paed) Gleneagles Medical Centre, Penang Lam Wah Ee Hospital, Penang Sime Darby Medical Centre, Subang Jaya (Paed) Hospital Universiti Sains Malaysia Ampang Puteri Specialist Hospital Ampang Hospital Pulau Pinang
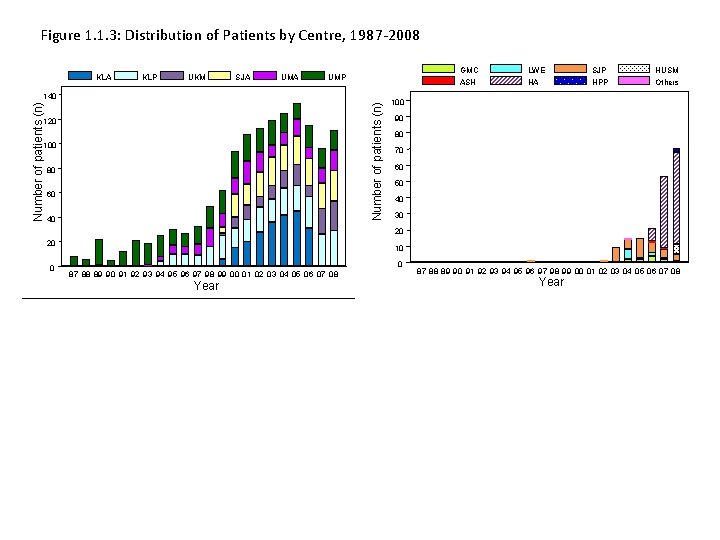
Figure 1. 1. 3: Distribution of Patients by Centre, 1987 -2008 KLA KLP UKM SJA UMA GMC ASH UMP Number of patients (n) 140 120 100 80 60 40 LWE HA SJP HPP HUSM Others 100 90 80 70 60 50 40 30 20 20 0 10 0 87 88 89 90 91 92 93 94 95 96 97 98 99 00 01 02 03 04 05 06 07 08 Year
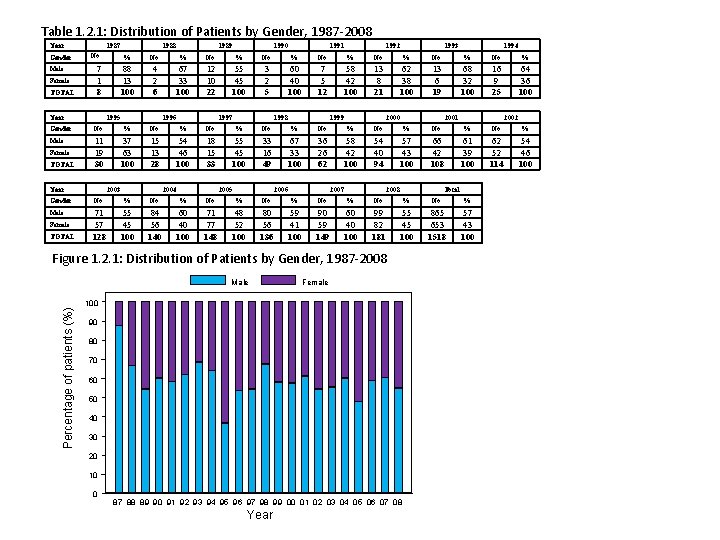
Table 1. 2. 1: Distribution of Patients by Gender, 1987 -2008 Year Gender Male Female TOTAL 1987 No. 7 1 8 Year 1988 1989 1990 1991 1992 1993 1994 % No. % 88 13 100 4 2 6 67 33 100 12 10 22 55 45 100 3 2 5 60 40 100 7 5 12 58 42 100 13 8 21 62 38 100 13 6 19 68 32 100 16 9 25 64 36 100 1995 1996 1997 1998 1999 2000 2001 2002 Gender No. % No. % Male 11 19 30 37 63 100 15 13 28 54 46 100 18 15 33 55 45 100 33 16 49 67 33 100 36 26 62 58 42 100 54 40 94 57 43 100 66 42 108 61 39 100 62 52 114 54 46 100 Female TOTAL Year 2003 2004 2005 2006 2007 2008 Total Gender No. % No. % Male 71 57 128 55 45 100 84 56 140 60 40 100 71 77 148 48 52 100 80 56 136 59 41 100 90 59 149 60 40 100 99 82 181 55 45 100 865 653 1518 57 43 100 Female TOTAL Figure 1. 2. 1: Distribution of Patients by Gender, 1987 -2008 Percentage of patients (%) Male Female 100 90 80 70 60 50 40 30 20 10 0 87 88 89 90 91 92 93 94 95 96 97 98 99 00 01 02 03 04 05 06 07 08 Year
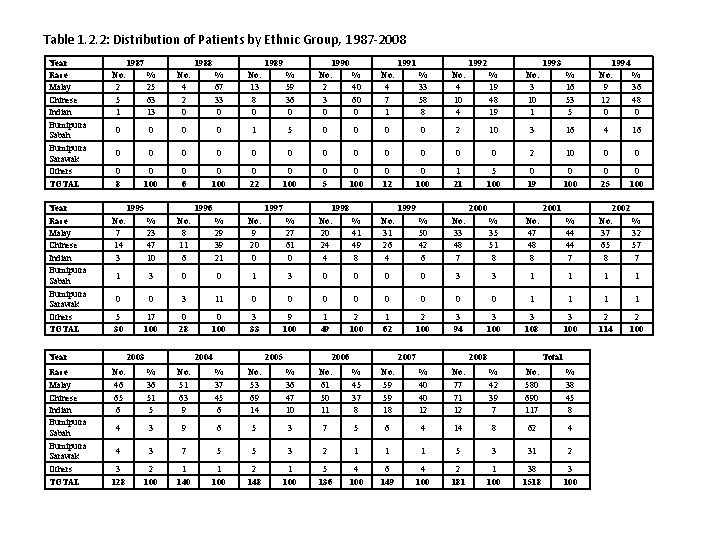
Table 1. 2. 2: Distribution of Patients by Ethnic Group, 1987 -2008 Year Race Malay Chinese Indian Bumiputra Sabah Bumiputra Sarawak Others TOTAL 1987 1989 1990 No. % 2 40 3 60 0 0 % 25 63 13 No. 4 2 0 % 67 33 0 No. 13 8 0 % 59 36 0 0 0 1 5 0 0 0 0 8 0 100 0 6 0 100 0 22 0 100 1995 1996 1997 1991 1992 1993 1994 No. % 9 36 12 48 0 0 No. 4 7 1 % 33 58 8 No. 4 10 4 % 19 48 19 No. 3 10 1 % 16 53 5 0 0 0 2 10 3 16 4 16 0 0 0 2 10 0 5 0 100 0 12 0 100 1 21 5 100 0 19 0 100 0 25 0 100 1998 No. % 20 41 24 49 4 8 No. 31 26 4 % 50 42 6 No. 33 48 7 % 35 51 8 No. 47 48 8 % 44 44 7 2002 No. % 37 32 65 57 8 7 1999 2000 2001 No. 7 14 3 % 23 47 10 No. 8 11 6 % 29 39 21 No. 9 20 0 % 27 61 0 1 3 0 0 0 0 3 3 1 1 0 0 3 11 0 0 0 0 1 1 5 30 17 100 0 28 0 100 3 33 9 100 1 49 2 100 1 62 2 100 3 94 3 100 3 108 3 100 2 114 2 100 Year Race Malay Chinese Indian Bumiputra Sabah Bumiputra Sarawak Others TOTAL 1988 No. 2 5 1 2003 2004 2005 2006 2007 2008 Total No. 46 65 6 % 36 51 5 No. 51 63 9 % 37 45 6 No. 53 69 14 % 36 47 10 No. 61 50 11 % 45 37 8 No. 59 59 18 % 40 40 12 No. 77 71 12 % 42 39 7 No. 580 690 117 % 38 45 8 4 3 9 6 5 3 7 5 6 4 14 8 62 4 4 3 7 5 5 3 2 1 1 1 5 3 31 2 3 128 2 100 1 140 1 100 2 148 1 100 5 136 4 100 6 149 4 100 2 181 1 100 38 1518 3 100
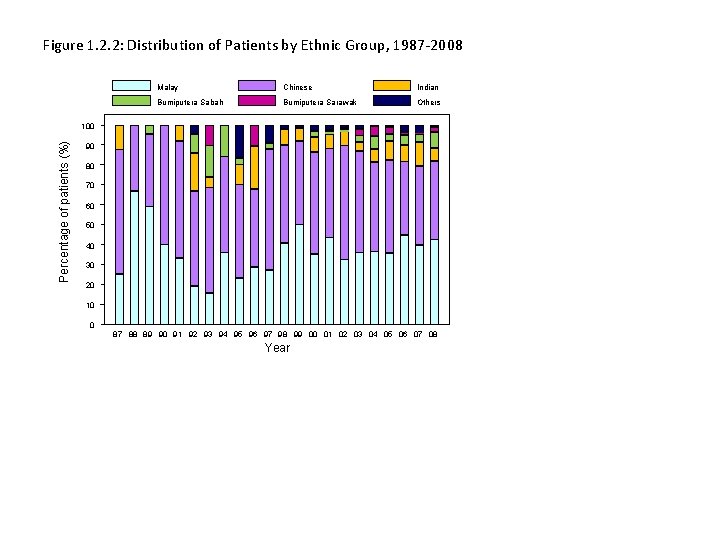
Figure 1. 2. 2: Distribution of Patients by Ethnic Group, 1987 -2008 Malay Chinese Indian Bumiputera Sabah Bumiputera Sarawak Others Percentage of patients (%) 100 90 80 70 60 50 40 30 20 10 0 87 88 89 90 91 92 93 94 95 96 97 98 99 00 01 02 03 04 05 06 07 08 Year
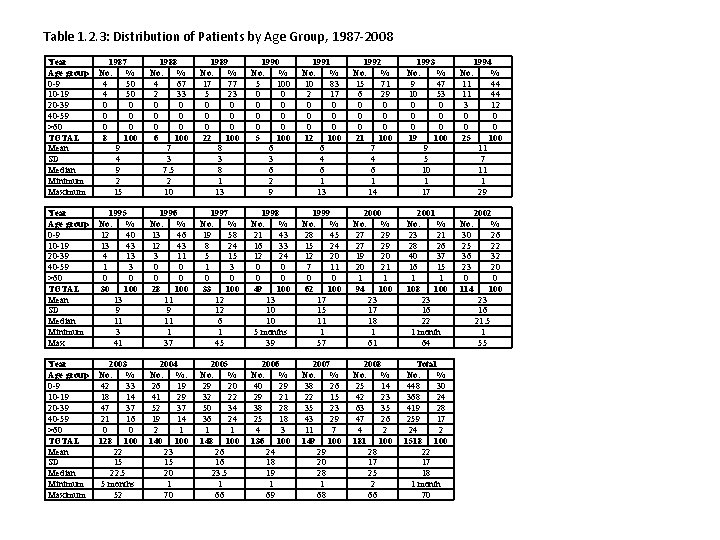
Table 1. 2. 3: Distribution of Patients by Age Group, 1987 -2008 Year Age group 0 -9 10 -19 20 -39 40 -59 ≥ 60 TOTAL Mean SD Median Minimum Maximum 1987 No. % 4 50 0 0 0 8 100 9 4 9 2 15 1988 No. % 4 67 2 33 0 0 0 6 100 7 3 7. 5 2 10 1989 No. % 17 77 5 23 0 0 0 22 100 8 3 8 1 13 1990 No. % 5 100 0 0 0 0 5 100 6 3 6 2 9 1991 No. % 10 83 2 17 0 0 0 12 100 6 4 6 1 13 1992 No. % 15 71 6 29 0 0 0 21 100 7 4 6 1 14 1993 No. % 9 47 10 53 0 0 0 19 100 9 5 10 1 17 Year Age group 0 -9 10 -19 20 -39 40 -59 ≥ 60 TOTAL Mean SD Median Minimum Max 1995 No. % 12 40 13 43 4 13 1 3 0 0 30 100 13 9 11 3 41 1996 No. % 13 46 12 43 3 11 0 0 28 100 11 9 11 1 37 1997 No. % 19 58 8 24 5 15 1 3 0 0 33 100 12 12 6 1 45 1998 No. % 21 43 16 33 12 24 0 0 49 100 13 10 10 5 months 39 1999 No. % 28 45 15 24 12 20 7 11 0 0 62 100 17 15 11 1 57 2000 No. % 27 29 19 20 20 21 1 1 94 100 23 17 18 1 61 2001 No. % 23 21 28 26 40 37 16 15 1 1 108 100 23 16 22 1 month 64 Year Age group 0 -9 10 -19 20 -39 40 -59 ≥ 60 TOTAL Mean SD Median Minimum Maximum 2003 No. % 42 33 18 14 47 37 21 16 0 0 128 100 22 15 22. 5 5 months 52 2004 No. %. 26 19 41 29 52 37 19 14 2 1 140 100 23 15 20 1 70 2005 No. % 29 20 32 22 50 34 36 24 1 1 148 100 26 16 23. 5 1 66 2006 No. % 40 29 29 21 38 28 25 18 4 3 136 100 24 18 19 1 69 2007 No. % 38 26 22 15 35 23 43 29 11 7 149 100 29 20 28 1 68 2008 No. % 25 14 42 23 63 35 47 26 4 2 181 100 28 17 25 2 66 Total No. % 448 30 368 24 419 28 259 17 24 2 1518 100 22 17 18 1 month 70 No. 11 11 3 0 0 25 No. 30 25 36 23 0 114 1994 % 44 44 12 0 0 100 11 7 11 1 29 2002 % 26 22 32 20 0 100 23 16 21. 5 1 55
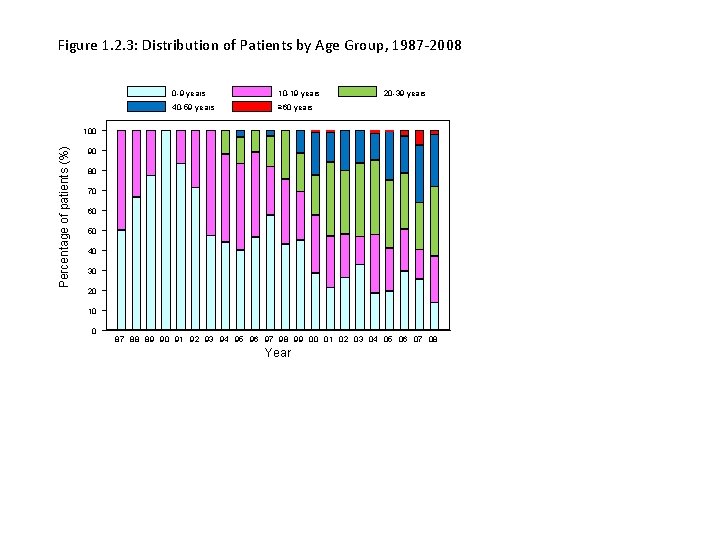
Figure 1. 2. 3: Distribution of Patients by Age Group, 1987 -2008 0 -9 years 10 -19 years 40 -59 years ≥ 60 years 20 -39 years Percentage of patients (%) 100 90 80 70 60 50 40 30 20 10 0 87 88 89 90 91 92 93 94 95 96 97 98 99 00 01 02 03 04 05 06 07 08 Year
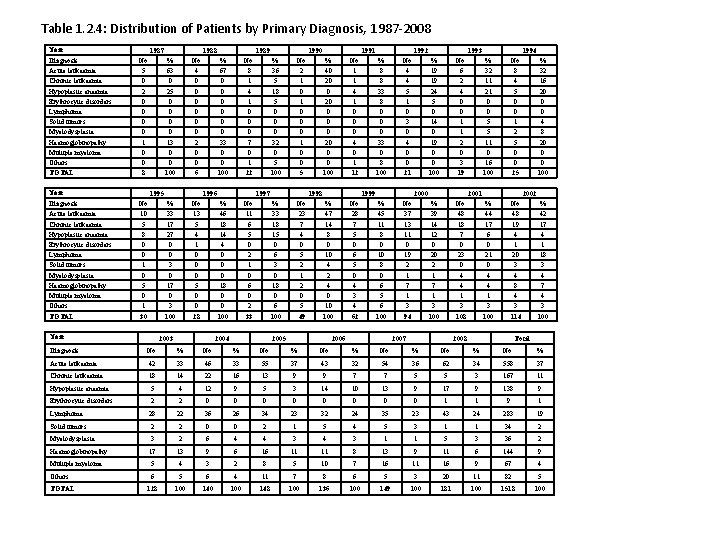
Table 1. 2. 4: Distribution of Patients by Primary Diagnosis, 1987 -2008 Year 1987 Diagnosis Acute leukaemia Chronic leukaemia Hypoplastic anaemia Erythrocytic disorders Lymphoma Solid tumors Myelodysplasia Haemoglobinopathy Multiple myeloma Others TOTAL No. 5 0 2 0 0 1 0 0 8 1988 % 63 0 25 0 0 13 0 0 100 No. 4 0 0 0 2 0 0 6 % 33 17 27 0 0 3 0 17 0 3 100 No. 13 5 4 1 0 0 0 5 0 0 28 1989 % 67 0 0 0 33 0 0 100 No. 8 1 4 1 0 0 0 7 0 1 22 % 46 18 14 4 0 0 0 18 0 0 100 No. 11 6 5 0 2 1 0 6 0 2 33 1990 % 36 5 18 5 0 0 0 32 0 5 100 No. 2 1 0 0 0 1 0 0 5 % 33 18 15 0 6 3 0 18 0 6 100 No. 23 7 4 0 5 2 1 2 0 5 49 1991 % 40 20 0 0 100 No. 1 1 4 1 0 0 0 4 0 1 12 % 47 14 8 0 10 4 2 4 0 10 100 No. 28 7 5 0 6 5 0 4 3 4 62 1992 % 8 8 33 8 0 0 0 33 0 8 100 No. 4 4 5 1 0 3 0 4 0 0 21 % 45 11 8 0 10 8 0 6 5 6 100 No. 37 13 11 0 19 2 1 7 1 3 94 1993 % 19 19 24 5 0 14 0 19 0 0 100 No. 6 2 4 0 0 1 1 2 0 3 19 % 39 14 12 0 20 2 1 7 1 3 100 No. 48 18 7 0 23 0 4 4 1 3 108 1994 % 32 11 21 0 0 5 5 11 0 16 100 No. 8 4 5 0 0 1 2 5 0 0 25 % 44 17 6 0 21 0 4 4 1 3 100 No. 48 19 4 1 20 3 4 8 4 3 114 % 32 16 20 0 0 4 8 20 0 0 100 Year Diagnosis Acute leukaemia Chronic leukaemia Hypoplastic anaemia Erythrocytic disorders Lymphoma Solid tumors Myelodysplasia Haemoglobinopathy Multiple myeloma Others TOTAL 1995 No. 10 5 8 0 0 1 0 5 0 1 30 Year 1996 2003 1997 2004 1998 1999 2005 2000 2006 2001 2007 2002 2008 % 42 17 4 1 18 3 4 7 4 3 100 Total Diagnosis No. % No. % Acute leukaemia 42 33 46 33 55 37 43 32 54 36 62 34 558 37 Chronic leukaemia 18 14 22 16 13 9 9 7 7 5 5 3 167 11 Hypoplastic anaemia 5 4 12 9 5 3 14 10 13 9 17 9 138 9 Erythrocytic disorders 2 2 0 0 0 0 1 1 9 1 Lymphoma 28 22 36 26 34 23 32 24 35 23 43 24 283 19 Solid tumors 2 2 0 0 2 1 5 4 5 3 1 1 34 2 Myelodysplasia 3 2 6 4 4 3 1 1 5 3 36 2 Haemoglobinopathy 17 13 9 6 16 11 11 8 13 9 11 6 144 9 Multiple myeloma 5 4 3 2 8 5 10 7 16 11 16 9 67 4 Others 6 5 6 4 11 7 8 6 5 3 20 11 82 5 128 100 140 100 148 100 136 100 149 100 181 100 1518 100 TOTAL
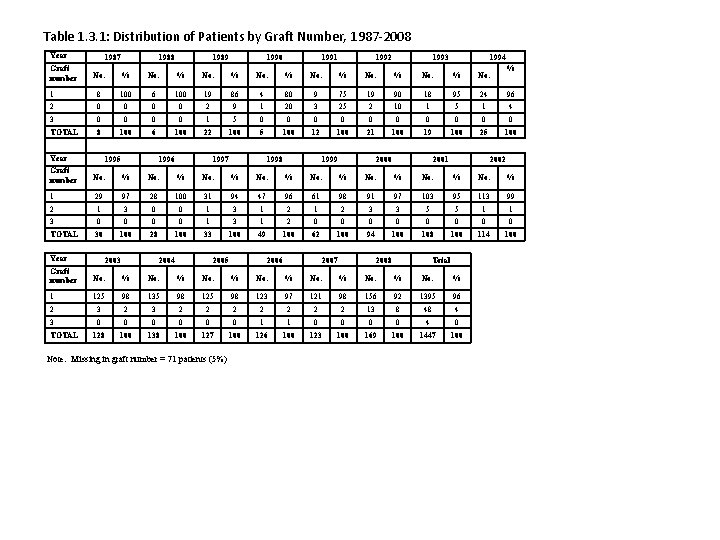
Table 1. 3. 1: Distribution of Patients by Graft Number, 1987 -2008 Year Graft number 1987 1988 1989 1990 1991 1992 1993 1994 % No. 1 8 100 6 100 19 86 4 80 9 75 19 90 18 95 24 96 2 0 0 2 9 1 20 3 25 2 10 1 5 1 4 3 0 0 1 5 0 0 0 0 0 TOTAL 8 100 6 100 22 100 5 100 12 100 21 100 19 100 25 100 Year 1995 1996 1997 1998 1999 2000 2001 2002 Graft number No. % No. % 1 29 97 28 100 31 94 47 96 61 98 91 97 103 95 113 99 2 1 3 0 0 1 3 1 2 3 3 5 5 1 1 3 0 0 1 3 1 2 0 0 0 0 TOTAL 30 100 28 100 33 100 49 100 62 100 94 100 108 100 114 100 Year 2003 2004 2005 2006 2007 2008 Total Graft number No. % No. % 1 125 98 135 98 123 97 121 98 156 92 1395 96 2 3 2 2 2 2 13 8 48 4 3 0 0 0 1 1 0 0 4 0 128 100 138 100 127 100 126 100 123 100 169 100 1447 100 TOTAL Note: Missing in graft number = 71 patients (5%)
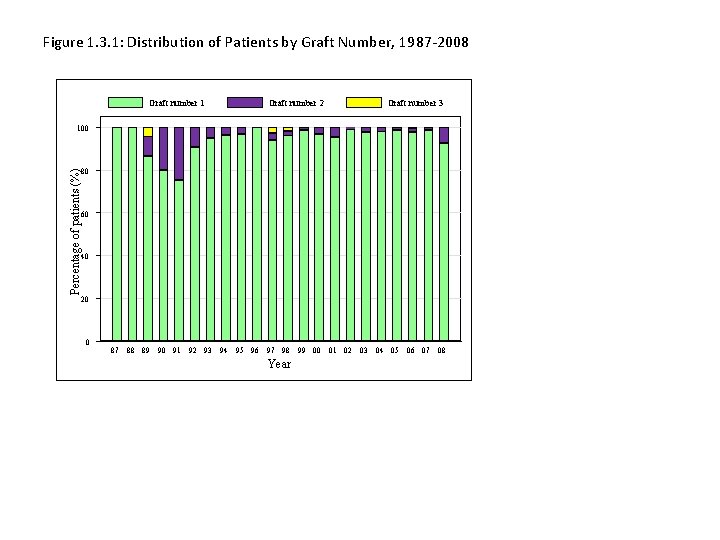
Figure 1. 3. 1: Distribution of Patients by Graft Number, 1987 -2008 Graft number 1 Graft number 2 Graft number 3 100 Percentage of patients (%) 80 60 40 20 0 87 88 89 90 91 92 93 94 95 96 97 98 99 00 01 02 03 04 05 06 07 08 Year
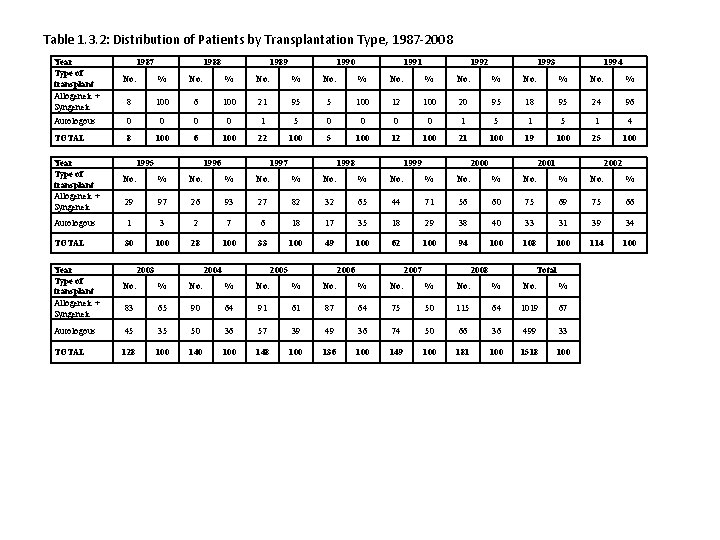
Table 1. 3. 2: Distribution of Patients by Transplantation Type, 1987 -2008 Year Type of transplant Allogeneic + Syngeneic 1987 1988 1989 1990 1991 1992 1993 1994 No. % No. % 8 100 6 100 21 95 5 100 12 100 20 95 18 95 24 96 Autologous 0 0 0 0 1 5 1 5 1 4 TOTAL 8 100 6 100 22 100 5 100 12 100 21 100 19 100 25 100 Year Type of transplant Allogeneic + Syngeneic 1995 1996 1997 1998 1999 2000 2001 2002 No. % No. % 29 97 26 93 27 82 32 65 44 71 56 60 75 69 75 66 Autologous 1 3 2 7 6 18 17 35 18 29 38 40 33 31 39 34 TOTAL 30 100 28 100 33 100 49 100 62 100 94 100 108 100 114 100 Year Type of transplant Allogeneic + Syngeneic 2003 2004 2005 2006 2007 2008 Total No. % No. % 83 65 90 64 91 61 87 64 75 50 115 64 1019 67 Autologous 45 35 50 36 57 39 49 36 74 50 66 36 499 33 TOTAL 128 100 140 100 148 100 136 100 149 100 181 100 1518 100
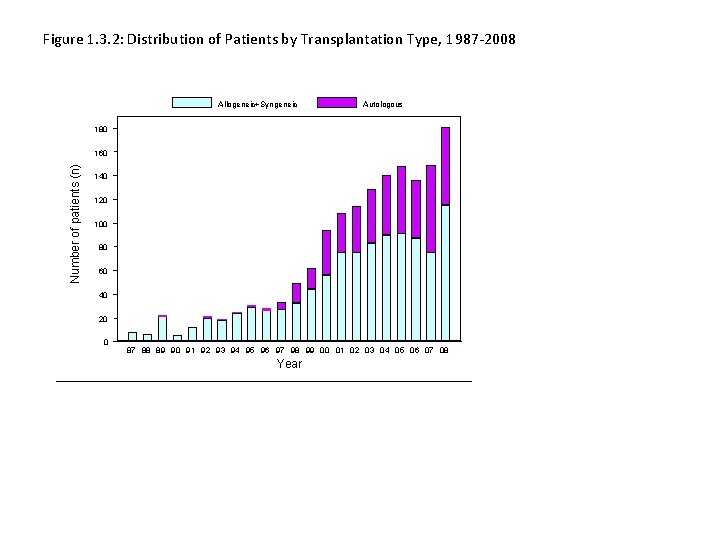
Figure 1. 3. 2: Distribution of Patients by Transplantation Type, 1987 -2008 Allogeneic+Syngeneic Autologous 180 Number of patients (n) 160 140 120 100 80 60 40 20 0 87 88 89 90 91 92 93 94 95 96 97 98 99 00 01 02 03 04 05 06 07 08 Year
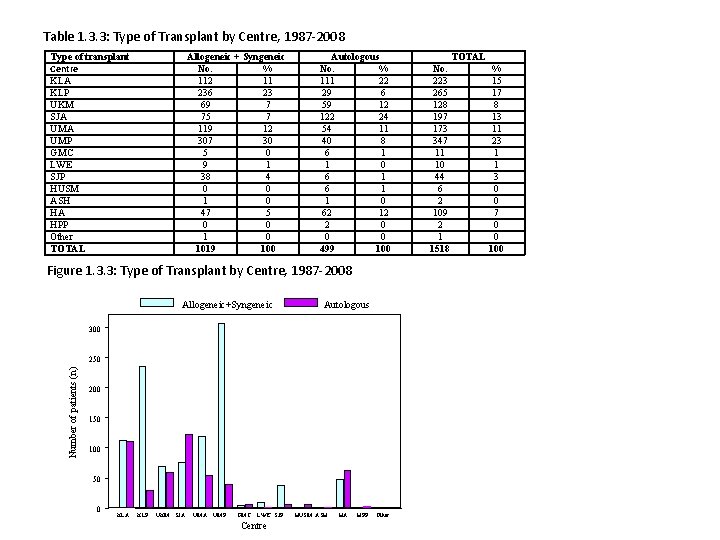
Table 1. 3. 3: Type of Transplant by Centre, 1987 -2008 Type of transplant Centre KLA KLP UKM SJA UMP GMC LWE SJP HUSM ASH HA HPP Other TOTAL Allogeneic + Syngeneic No. % 112 11 236 23 69 7 75 7 119 12 307 30 5 0 9 1 38 4 0 0 1 0 47 5 0 0 1019 100 Autologous No. % 111 22 29 6 59 12 122 24 54 11 40 8 6 1 1 0 62 12 2 0 0 0 499 100 Figure 1. 3. 3: Type of Transplant by Centre, 1987 -2008 Allogeneic+Syngeneic Autologous 300 Number of patients (n) 250 200 150 100 50 0 KLA KLP UKM SJA UMP GMC LWE SJP Centre HUSM ASH HA HPP Other TOTAL No. 223 265 128 197 173 347 11 10 44 6 2 109 2 1 1518 % 15 17 8 13 11 23 1 1 3 0 0 7 0 0 100
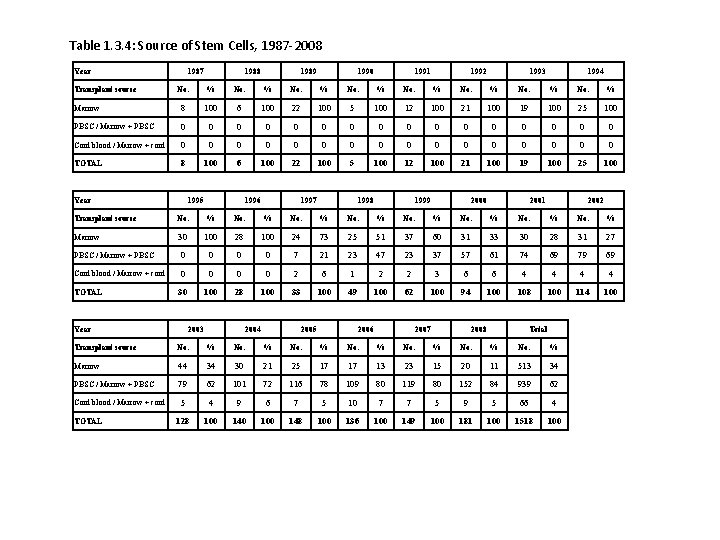
Table 1. 3. 4: Source of Stem Cells, 1987 -2008 Year Transplant source 1987 1988 1989 1990 1991 1992 1993 1994 No. % No. % Marrow 8 100 6 100 22 100 5 100 12 100 21 100 19 100 25 100 PBSC / Marrow + PBSC 0 0 0 0 Cord blood / Marrow + cord 0 0 0 0 TOTAL 8 100 6 100 22 100 5 100 12 100 21 100 19 100 25 100 Year 1995 1996 1997 1998 1999 2000 2001 2002 Transplant source No. % No. % Marrow 30 100 28 100 24 73 25 51 37 60 31 33 30 28 31 27 PBSC / Marrow + PBSC 0 0 7 21 23 47 23 37 57 61 74 69 79 69 Cord blood / Marrow + cord 0 0 2 6 1 2 2 3 6 6 4 4 TOTAL 30 100 28 100 33 100 49 100 62 100 94 100 108 100 114 100 Year 2003 2004 2005 2006 2007 2008 Total Transplant source No. % No. % Marrow 44 34 30 21 25 17 17 13 23 15 20 11 513 34 PBSC / Marrow + PBSC 79 62 101 72 116 78 109 80 119 80 152 84 939 62 Cord blood / Marrow + cord 5 4 9 6 7 5 10 7 7 5 9 5 66 4 128 100 140 100 148 100 136 100 149 100 181 100 1518 100 TOTAL
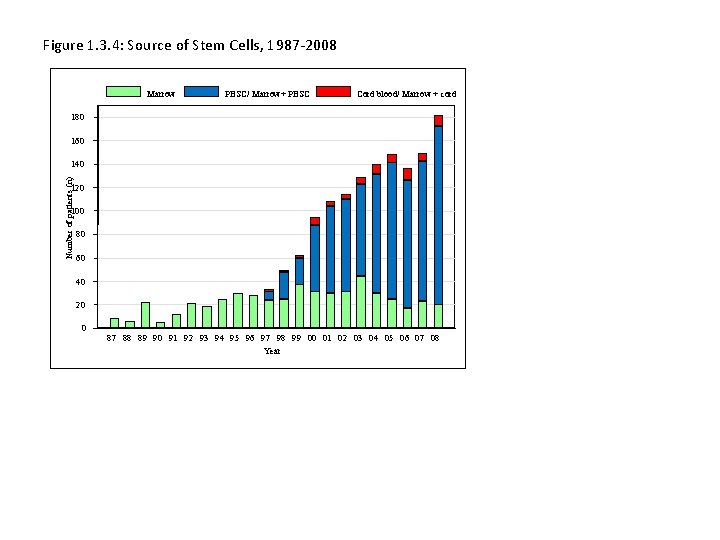
Figure 1. 3. 4: Source of Stem Cells, 1987 -2008 Marrow PBSC/ Marrow+ PBSC Cord blood/ Marrow + cord 180 160 Number of patients (n) 140 120 100 80 60 40 20 0 87 88 89 90 91 92 93 94 95 96 97 98 99 00 01 02 03 04 05 06 07 08 Year
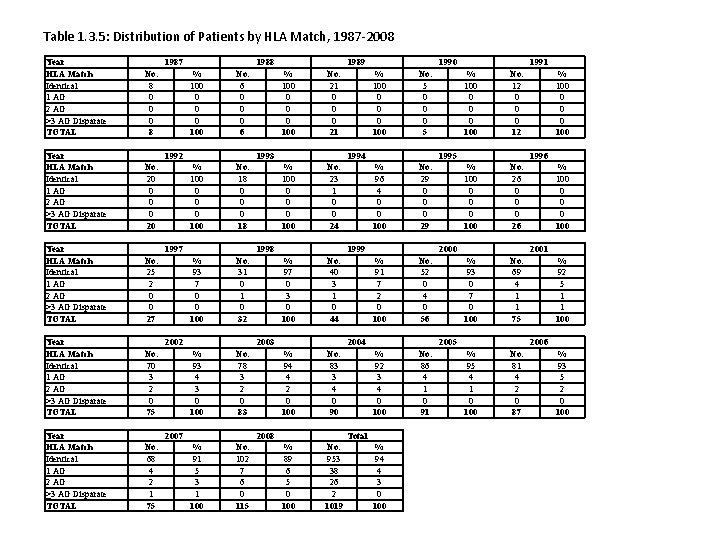
Table 1. 3. 5: Distribution of Patients by HLA Match, 1987 -2008 Year HLA Match Identical 1 AG 2 AG ≥ 3 AG Disparate TOTAL No. 8 0 0 0 8 1987 Year HLA Match Identical 1 AG 2 AG ≥ 3 AG Disparate TOTAL No. 20 0 20 Year HLA Match Identical 1 AG 2 AG ≥ 3 AG Disparate TOTAL No. 25 2 0 0 27 Year HLA Match Identical 1 AG 2 AG ≥ 3 AG Disparate TOTAL No. 70 3 2 0 75 Year HLA Match Identical 1 AG 2 AG ≥ 3 AG Disparate TOTAL No. 68 4 2 1 75 1988 % 100 0 100 No. 6 0 0 0 6 % 100 0 100 No. 18 0 0 0 18 % 93 7 0 0 100 No. 31 0 32 % 93 4 3 0 100 No. 78 3 2 0 83 % 91 5 3 1 100 No. 102 7 6 0 115 1992 1989 % 100 0 100 No. 21 0 0 0 21 % 100 0 100 No. 23 1 0 0 24 % 97 0 3 0 100 No. 40 3 1 0 44 % 94 4 2 0 100 No. 83 3 4 0 90 % 89 6 5 0 100 No. 953 38 26 2 1019 1993 1997 % 96 4 0 0 100 No. 29 0 0 0 29 % 91 7 2 0 100 No. 52 0 4 0 56 % 92 3 4 0 100 No. 86 4 1 0 91 No. 12 0 0 0 12 % 100 0 100 No. 26 0 0 0 26 % 93 0 7 0 100 No. 69 4 1 1 75 % 95 4 1 0 100 No. 81 4 2 0 87 % 94 4 3 0 100 % 100 0 100 2001 2005 Total % 100 0 100 1996 2000 2004 2008 1991 % 100 0 100 1995 1999 2003 2007 No. 5 0 0 0 5 1994 1998 2002 1990 % 100 0 100 % 92 5 1 1 100 2006 % 93 5 2 0 100
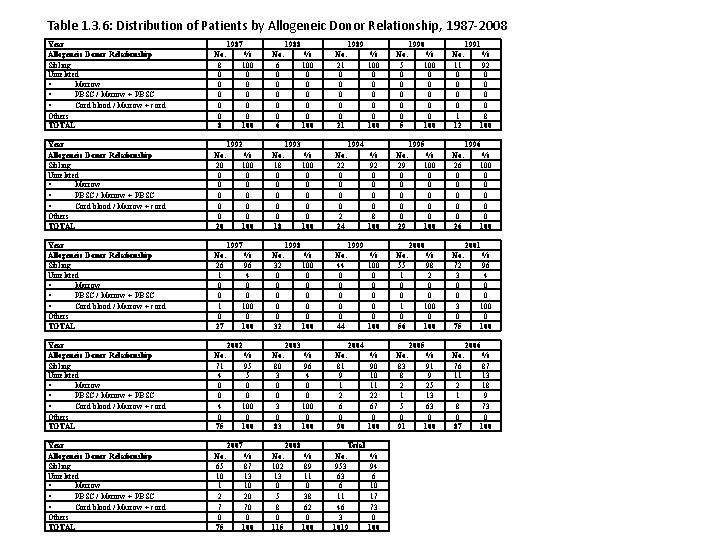
Table 1. 3. 6: Distribution of Patients by Allogeneic Donor Relationship, 1987 -2008 Year Allogeneic Donor Relationship Sibling Unrelated Marrow PBSC / Marrow + PBSC Cord blood / Marrow + cord Others TOTAL No. 8 0 0 0 8 1987 Year Allogeneic Donor Relationship Sibling Unrelated Marrow PBSC / Marrow + PBSC Cord blood / Marrow + cord Others TOTAL No. 20 0 0 20 Year Allogeneic Donor Relationship Sibling Unrelated Marrow PBSC / Marrow + PBSC Cord blood / Marrow + cord Others TOTAL No. 26 1 0 0 1 0 27 Year Allogeneic Donor Relationship Sibling Unrelated Marrow PBSC / Marrow + PBSC Cord blood / Marrow + cord Others TOTAL No. 71 4 0 0 4 0 75 Year Allogeneic Donor Relationship Sibling Unrelated Marrow PBSC / Marrow + PBSC Cord blood / Marrow + cord Others TOTAL No. 65 10 1 2 7 0 75 % 100 0 0 100 1988 No. 6 0 0 0 6 1992 % 100 0 0 100 No. 5 0 0 0 5 No. 22 0 0 2 24 % 92 0 0 8 100 No. 29 0 0 0 29 % 100 0 0 100 No. 44 0 0 0 44 % 100 0 0 100 No. 55 1 0 0 1 0 56 % 96 4 0 0 100 No. 81 9 1 2 6 0 90 % 90 10 11 22 67 0 100 No. 83 8 2 1 5 0 91 % 89 11 0 38 62 0 100 Total No. 953 63 6 11 46 3 1019 % 94 6 10 17 73 0 100 1994 1991 No. 11 0 0 1 12 % 100 0 0 100 % 98 2 0 0 100 % 100 0 0 100 2001 No. 72 3 0 0 3 0 75 2005 % 91 9 25 13 63 0 100 % 92 0 0 8 100 1996 No. 26 0 0 0 26 2000 2004 2008 No. 102 13 0 5 8 0 115 % 100 0 0 100 1995 1999 2003 No. 80 3 0 83 2007 % 87 13 10 20 70 0 100 % 100 0 0 100 1998 No. 32 0 0 0 32 2002 % 95 5 0 0 100 No. 21 0 0 0 21 1993 No. 18 0 0 0 18 1997 % 96 4 0 0 100 1989 % 100 0 0 100 % 96 4 0 0 100 2006 No. 76 11 2 1 8 0 87 % 87 13 18 9 73 0 100
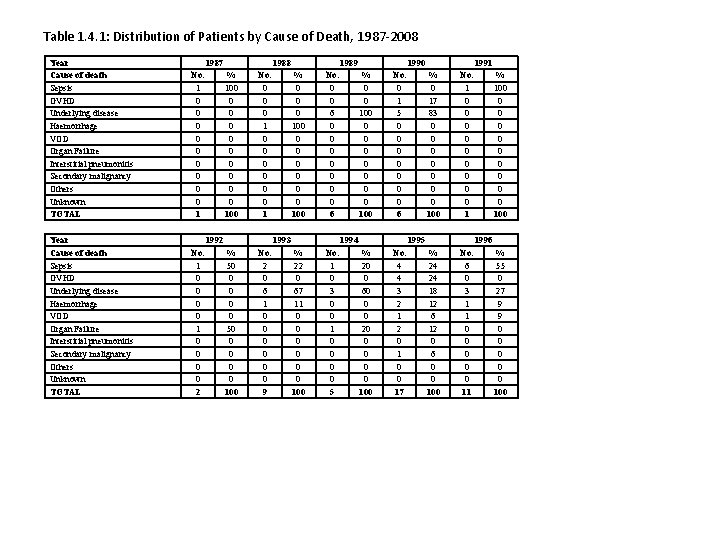
Table 1. 4. 1: Distribution of Patients by Cause of Death, 1987 -2008 Year Cause of death Sepsis GVHD Underlying disease Haemorrhage VOD Organ Failure Interstitial pneumonitis Secondary malignancy Others Unknown TOTAL 1987 No. 1 0 0 0 0 0 1 1988 % 100 0 0 0 0 100 No. 0 0 0 1 1992 No. 1 0 0 0 0 2 1989 % 0 0 0 100 No. 0 0 6 0 0 0 0 6 1993 % 50 0 0 0 0 100 No. 2 0 6 1 0 0 0 9 1990 % 0 0 100 0 0 0 100 No. 0 1 5 0 0 0 0 6 1994 % 22 0 67 11 0 0 0 100 No. 1 0 3 0 0 1 0 0 5 1991 % 0 17 83 0 0 0 0 100 No. 1 0 0 0 0 0 1 1995 % 20 0 60 0 0 20 0 0 100 No. 4 4 3 2 1 2 0 1 0 0 17 % 100 0 0 0 0 100 1996 % 24 24 18 12 6 12 0 6 0 0 100 No. 6 0 3 1 1 0 0 0 11 % 55 0 27 9 9 0 0 0 100
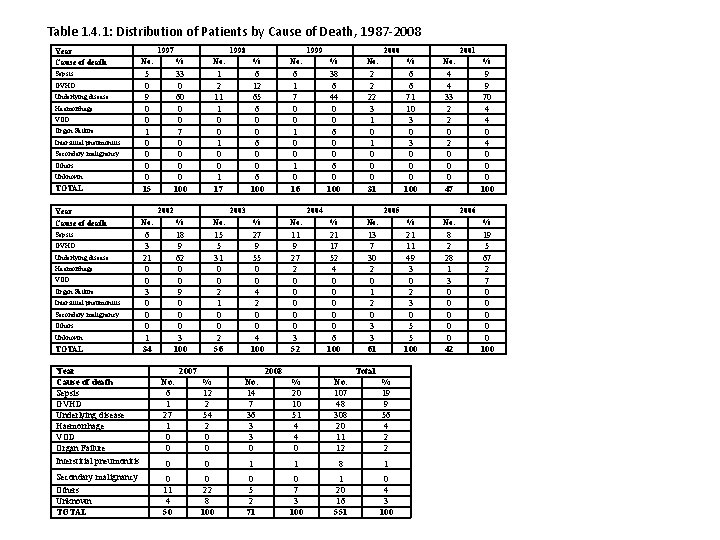
Table 1. 4. 1: Distribution of Patients by Cause of Death, 1987 -2008 Year Cause of death 1997 1998 1999 2000 2001 No. % TOTAL 5 0 9 0 0 15 33 0 60 0 0 7 0 0 100 1 2 11 1 0 0 1 17 6 12 65 6 0 0 6 100 6 1 7 0 0 1 0 16 38 6 44 0 0 6 0 100 2 2 22 3 1 0 0 0 31 6 6 71 10 3 0 0 0 100 4 4 33 2 2 0 0 0 47 9 9 70 4 4 0 0 0 100 Year Cause of death No. % 6 3 21 0 0 3 0 0 0 1 34 18 9 62 0 0 9 0 0 0 3 100 15 5 31 0 0 2 56 27 9 55 0 0 4 2 0 0 4 100 11 9 27 2 0 0 0 3 52 21 17 52 4 0 0 0 6 100 13 7 30 2 0 1 2 0 3 3 61 21 11 49 3 0 2 3 0 5 5 100 8 2 28 1 3 0 0 0 42 19 5 67 2 7 0 0 0 100 Sepsis GVHD Underlying disease Haemorrhage VOD Organ Failure Interstitial pneumonitis Secondary malignancy Others Unknown TOTAL 2002 2003 2004 2007 2005 2008 Total Year Cause of death Sepsis GVHD Underlying disease Haemorrhage VOD Organ Failure Interstitial pneumonitis No. 6 1 27 1 0 0 % 12 2 54 2 0 0 No. 14 7 36 3 3 0 % 20 10 51 4 4 0 No. 107 48 308 20 11 12 % 19 9 56 4 2 2 0 0 1 1 8 1 Secondary malignancy Others Unknown TOTAL 0 11 4 50 0 22 8 100 0 5 2 71 0 7 3 100 1 20 16 551 0 4 3 100 2006
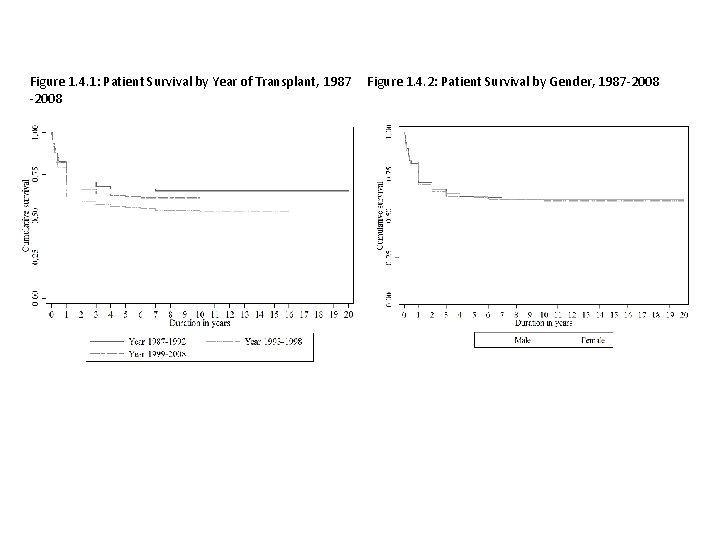
Figure 1. 4. 1: Patient Survival by Year of Transplant, 1987 -2008 Figure 1. 4. 2: Patient Survival by Gender, 1987 -2008
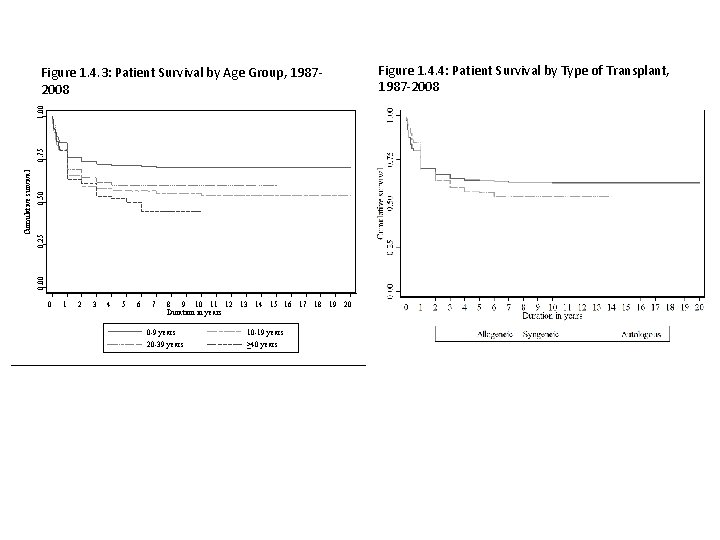
0. 50 0. 25 0. 00 Cumulative survival 0. 75 1. 00 Figure 1. 4. 3: Patient Survival by Age Group, 19872008 0 1 2 3 4 5 6 7 8 9 10 11 12 13 14 15 16 17 18 19 20 Duration in years 0 -9 years 10 -19 years 20 -39 years ≥ 40 years Figure 1. 4. 4: Patient Survival by Type of Transplant, 1987 -2008
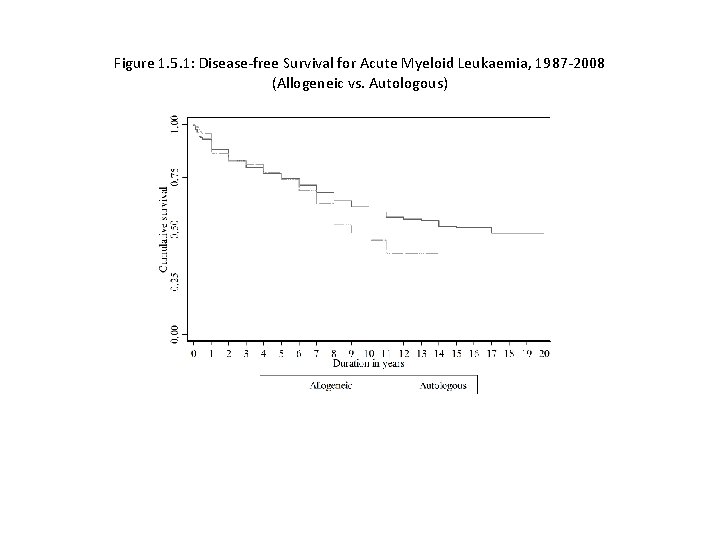
Figure 1. 5. 1: Disease-free Survival for Acute Myeloid Leukaemia, 1987 -2008 (Allogeneic vs. Autologous)
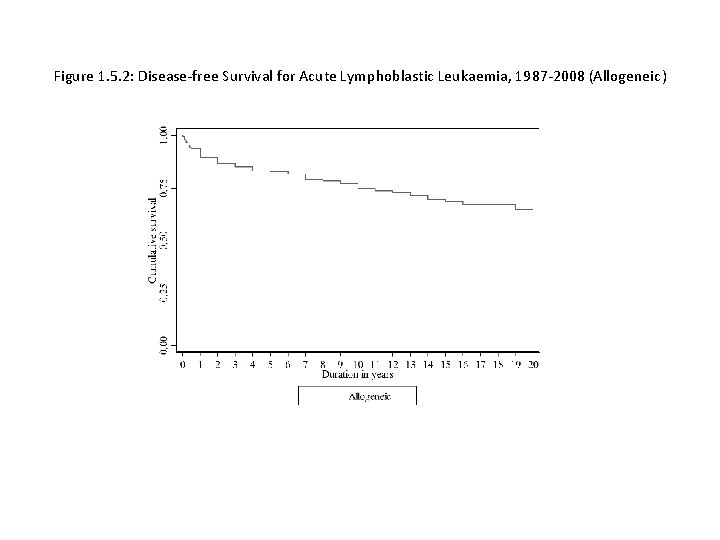
Figure 1. 5. 2: Disease-free Survival for Acute Lymphoblastic Leukaemia, 1987 -2008 (Allogeneic)
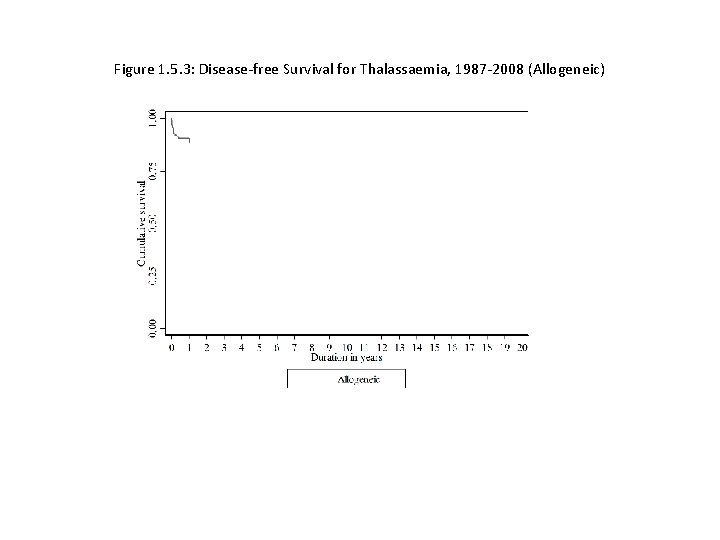
Figure 1. 5. 3: Disease-free Survival for Thalassaemia, 1987 -2008 (Allogeneic)
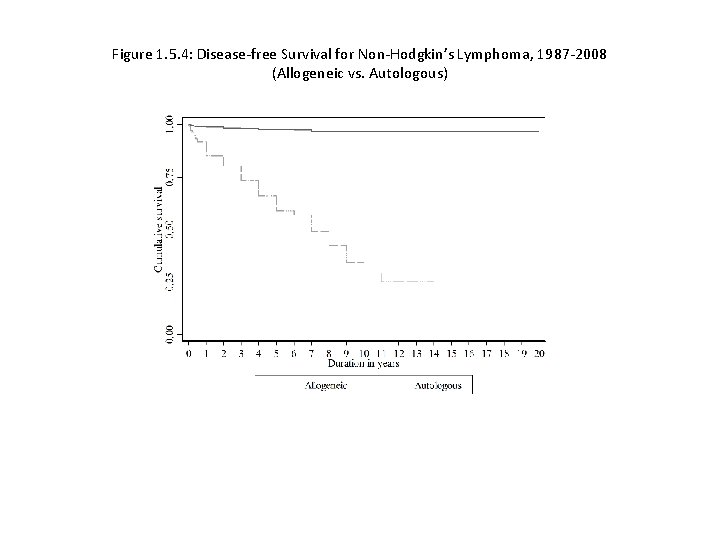
Figure 1. 5. 4: Disease-free Survival for Non-Hodgkin’s Lymphoma, 1987 -2008 (Allogeneic vs. Autologous)
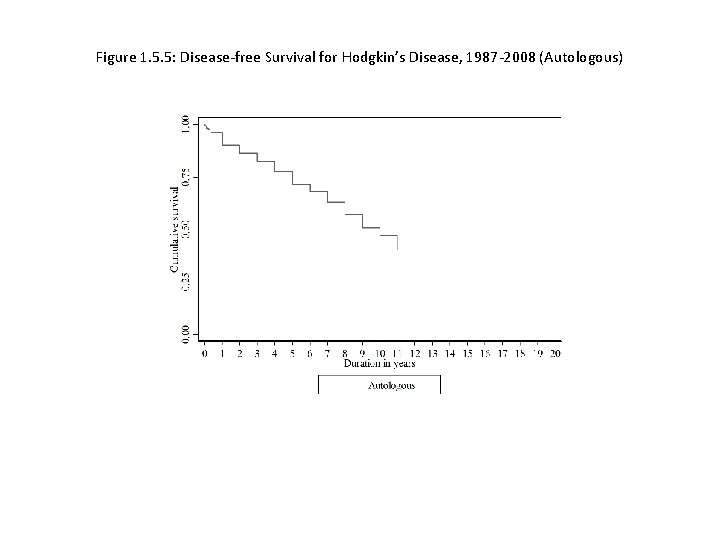
Figure 1. 5. 5: Disease-free Survival for Hodgkin’s Disease, 1987 -2008 (Autologous)
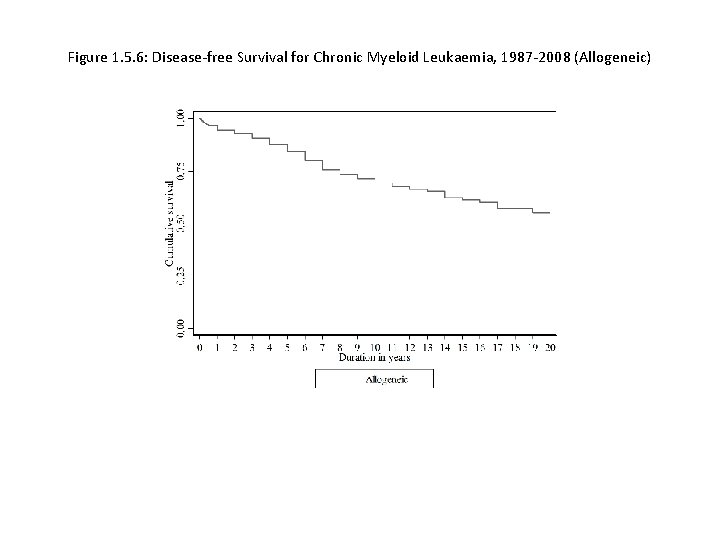
Figure 1. 5. 6: Disease-free Survival for Chronic Myeloid Leukaemia, 1987 -2008 (Allogeneic)
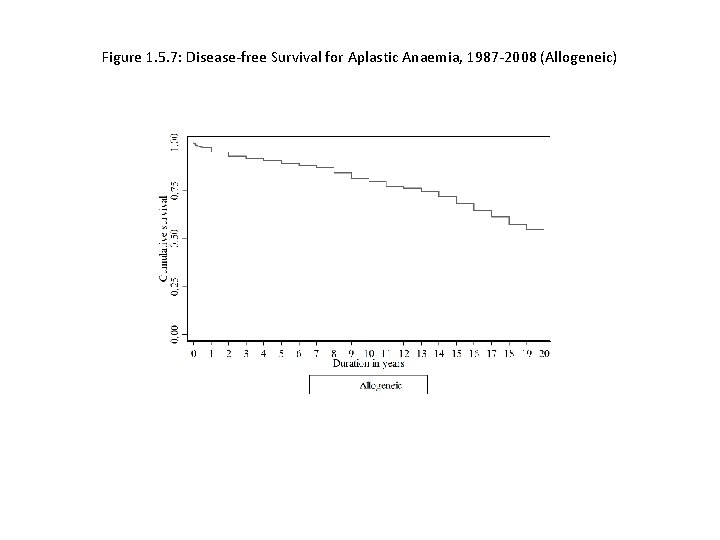
Figure 1. 5. 7: Disease-free Survival for Aplastic Anaemia, 1987 -2008 (Allogeneic)
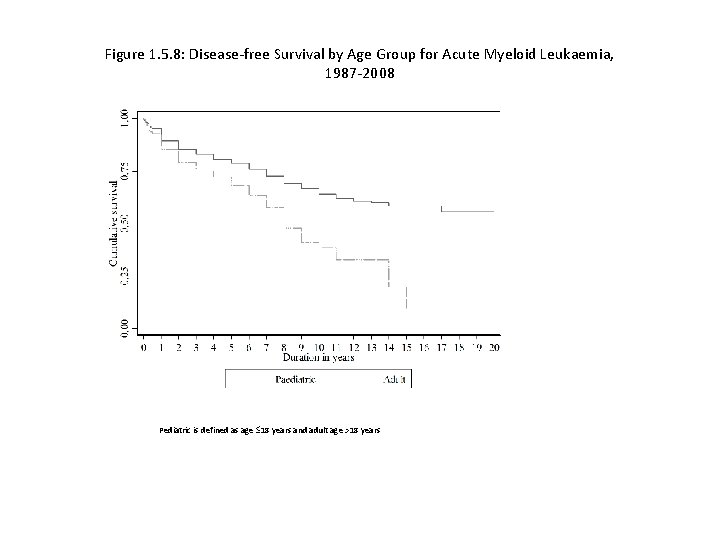
Figure 1. 5. 8: Disease-free Survival by Age Group for Acute Myeloid Leukaemia, 1987 -2008 Pediatric is defined as age 18 years and adult age >18 years.
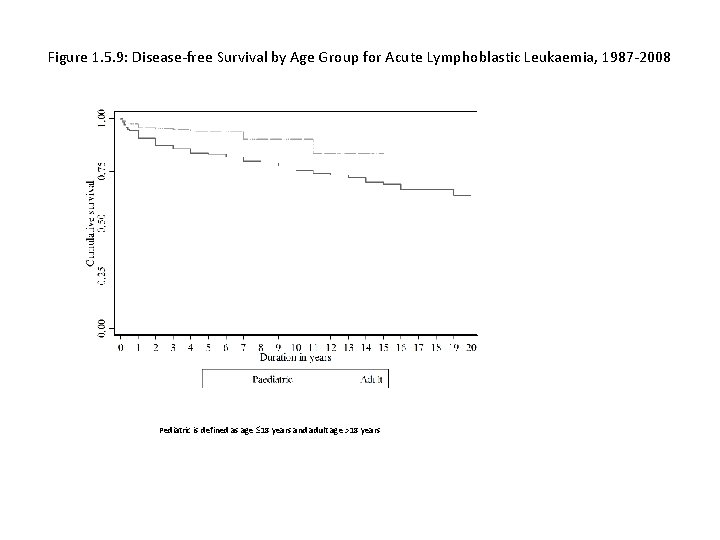
Figure 1. 5. 9: Disease-free Survival by Age Group for Acute Lymphoblastic Leukaemia, 1987 -2008 Pediatric is defined as age 18 years and adult age >18 years.
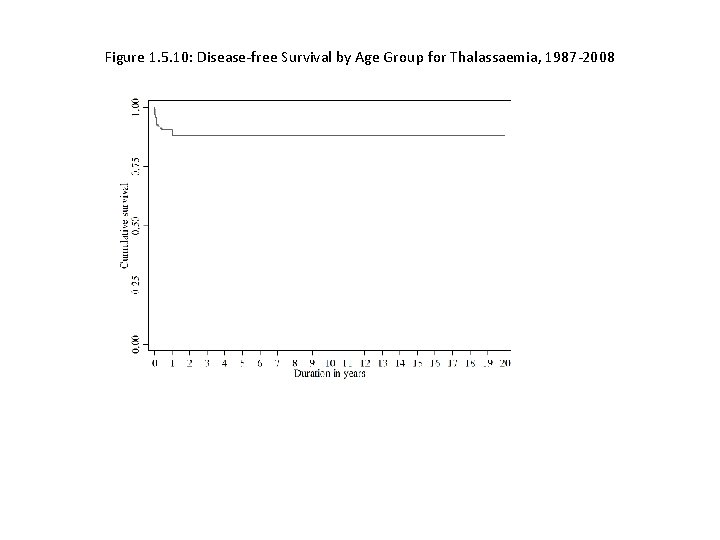
Figure 1. 5. 10: Disease-free Survival by Age Group for Thalassaemia, 1987 -2008
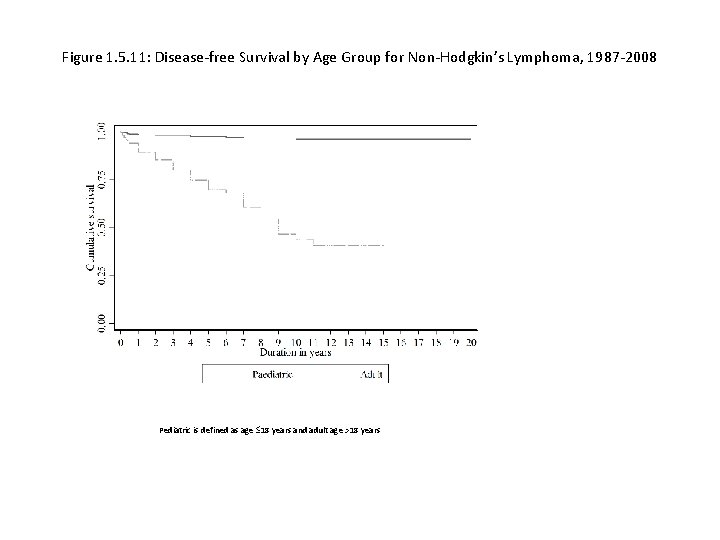
Figure 1. 5. 11: Disease-free Survival by Age Group for Non-Hodgkin’s Lymphoma, 1987 -2008 Pediatric is defined as age 18 years and adult age >18 years.
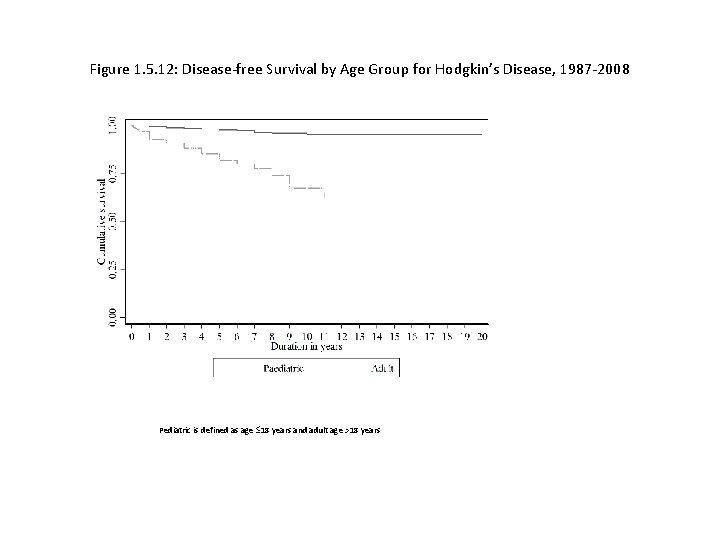
Figure 1. 5. 12: Disease-free Survival by Age Group for Hodgkin’s Disease, 1987 -2008 Pediatric is defined as age 18 years and adult age >18 years.
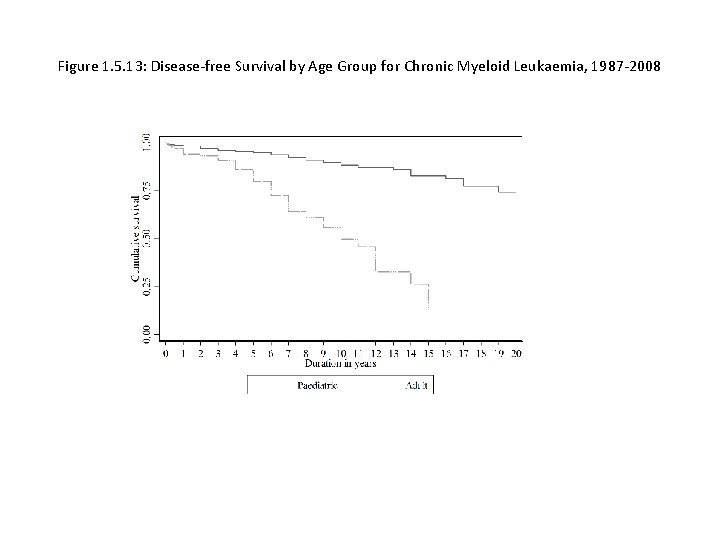
Figure 1. 5. 13: Disease-free Survival by Age Group for Chronic Myeloid Leukaemia, 1987 -2008
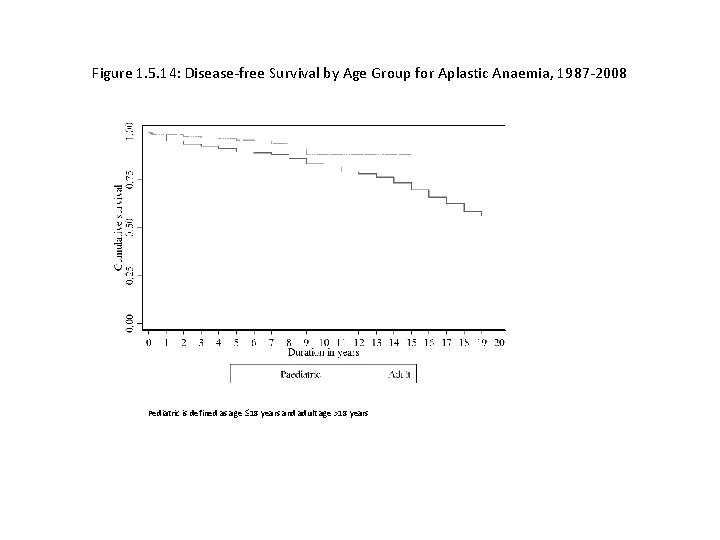
Figure 1. 5. 14: Disease-free Survival by Age Group for Aplastic Anaemia, 1987 -2008 Pediatric is defined as age 18 years and adult age >18 years.
- Slides: 39