Chapter 1 Basic Physics Tools and Errro Analysis

Chapter 1 - Basic Physics Tools and Errro Analysis Error

Why Bother? • The knowledge we have of the physical world is obtained by doing experiments and making measurements. • It is important to understand how to express such data and how to analyze and draw meaningful conclusions from it.

Why Bother? • ALL measurements of physical quantities are subject to uncertainties. • It is never possible to measure anything exactly. • in order to draw valid conclusions the error must be indicated and dealt with properly.

Example: Your Height is 5' 8“. How accurate is this? The height of a person depends on : • how straight she stands, • Did she just got up from lying horizontally • Did she has her shoes on • How her hair is made up. • A quantity such as height is not exactly defined without specifying many other circumstances.

That’s Not All…. . • Even if you could precisely specify the "circumstances, " your result would still have an error associated with it. • The scale you are using is of limited accuracy • when you read the scale, you may have to estimate a fraction between the marks on the scale, etc.
 A numerical value (in")
The two essential components of a physical measurement • (1) A numerical value (in a specified system of units) giving the best estimate possible of the quantity measured • (2) the degree of uncertainty associated with this estimated value. • For example, a measurement of the width of a table would yield a result such as • 95. 3 cm +/- 0. 1 cm.

Significant Figures • Definition: The significant figures of a quantity are the meaningful digits in it. • 1. Nonzero digits are always significant. • 2. All final zeros after the decimal point are significant • 3. Zeros between two other significant digits are always significant • 4. Zeros used solely for spacing the decimal point are not significant.

Significant Figures • 1. Any digit that is not zero is significant. 549 1. 892

Significant Figures • 2. Zeros between non zero digits are significant. • 4023 • 68907 • 101

Significant Figures • 3. Zeros to the left of the first non zero digit are not significant • 0. 000034 = 3. 4 x 10 -5 • 0. 01 = 1 x 10 -2 • 0. 00416 = 4. 16 x 10 -3

Significant Figures • For numbers with decimal points, zeros to the right of a non zero digit are significant. • • 2. 00 has three significant figures 0. 050 has two significant figures. • For this reason it is important to keep the trailing zeros to indicate the actual number of significant figures.

How many Significant Figures does each number have? • • 1023. 00 2208 0. 000056 3, 000 5550 609. 000 8. 000001 0. 002
 between two")
Percent Error • To express the magnitude of the error (or deviation) between two measurements scientists invariably use percent error. • Example: The length of a box is measured to be 12. 5 cm, and the actual value is 12. 0 cm. What is the percent error in the measurement? • % Error = 12. 5 cm-12. 0 cm x 100 = 0. 5 x 100 = 4. 16% • 12. 0 cm 12. 0

Vocabulary • 1. Physics – the study of the physical world: energy, matter and how they are related. • 2. Dimensional Analysis – The method of treating the units as algebraic quantities which can be cancelled. • Significant Figures – The valid digits in a measurement • Scientific Method – • Hypothesis – An educated guess about how variables are related. • Scientific Law – A rule of nature that sums up related observations to describe a pattern in nature.

Vocabulary • Scientific Theory – An explanation based on many observations supported by experimental results. • Measurement – A comparison between an unknown quantity and a standard. • Precision – The degree of exactness. • Accuracy – How well the results of a measurement agree with the “real” value. • Parallax – The apparent shift in the position of an object when it is viewed from different angles.

Vocabulary • Independent Variable – The factor that is changed or manipulated during the experiment. • Dependent variable – the factor that depends on the independent variable. • Line of Best Fit – A line drawn as close as possible to all the data points.

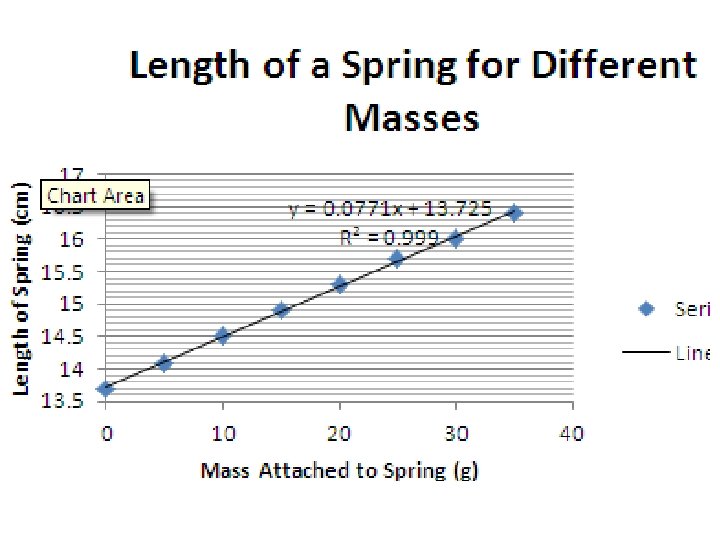
Example: when you attach different masses to a spring to see how much it gets stretched, Which is the Independent Variable? Dependent Variable?

How to Plot Graphs • 1. Identify the independent variable and dependent variables in your data. • 2. The independent variable is plotted on the x-axis. • 3. The dependent variable is plotted on the y-axis. • 4. Determine the ranges of both variables to be plotted. • 5. Decide if (0, 0) is a valid data point. • 6. Spread the data out as much as possible. Use convenient divisions such as 2, 5, 10. • 7. Number and label the horizontal axis. Include the units, e. g. Mass (grams) • 8. Draw a Best Fit Line/Curve • 9. Give the graph a title that clearly tells what the graph represents.

How to Draw a Line of Best Fit • Average all the x measurements • Average all the y measurements • Plot this point (xavg, yavg) on the graph. This will be your pivot point. • Use the pivot point to draw a line that passes as much data points as possible and has about equal numbers of data points on either side of the line.

Linear Relationships • When the best-fit line is a straight line, the relationship between the independent variable and dependent variable is linear. • The equation of the line is y = mx + b, where • m = slope of the line = Rise = y • Run x • b = y-intercept
")
Linear Relationships • • • 1. Temperature – Celsius and Farenheit C = (5/9) (F-32) 2. Exchange Rates – E = 0. 7749 D Euro to dollar 3. Cell phone costs/month C = 0. 05 m + 20 4. Distance travelled D = 60 t

Nonlinear Relationships • When the graph is not a straight line, the relationship between the independent and the dependent variable is NOT linear. • Common nonlinear graphs: • Quadratic: y = ax 2 + bx + c • Inverse: y = a/x

Quadratic Relationship

Real applications of quadratic equations • • • 1. Path of planetary motion 2. Stopping distance of a braking car. 3. Trajectory of a ball that is thrown -- artillery calculations 4. Bernoulli’s Principle--predict the behaviour of the flow of air over the wing of an aircraft and to see why an aircraft flies.

Inverse Relationship • 1. Pressure and volume of a gas • 2. Price and demand in economics If the local Starbucks lowers their price of a tall coffee from $1. 75 to $1. 65, the quantity demanded will rise from 45 coffees an hour to 48 coffees an hour. 3. Mortality Rates And Performance In The Hospital Quality Alliance Measures

Order of Magnitude • Used to make a rough comparison between compare numbers. • Order of Magnitude of 1 = 101 • Order of Magnitude of 2 = 102 • Order of Magnitude of 3 = 103 etc.

How to Find the Order of Magnitude of a number • Write the number in Scientific Notation • If the mantissa (left side) is greater than 5, then go up one more power. • Example: 8. 9 x 10⁴ It is greater than 5. 0 x 104 Therefore 8. 9 x 10⁴ would have an Order of Magnitude of 5. • • **check: 89, 000 is closer to 100, 000 than 10, 000.

Order of Magnitude Number Scientific Notation 2789 2. 789 x 103 Greater than Order of 5 Magnitude In the mantissa No 3 5510 5. 510 x 103 Yes 97000 9. 7000 x 104 0. 00678 6. 78 x 10 -3 -3 4

- Slides: 30