Chapter 1 Basic Concepts Review Reference Map Political

Chapter 1 Basic Concepts Review

Reference Map • • • Political Physical Historical Road Topographic

Physical Maps • • • Use shaded or painted relief to illustrate the major landforms (natural features) of a region, country, or world. Mountain ranges and rivers usually are prominent features on such maps; other features would include deserts, glaciers, lakes, and valleys. The colors on physical maps often include brown or green for land blue for water.

Political Maps • are reference maps that show names and boundaries of political geographic units (states, countries, etc. ) and only very important physical or human features (e. g. , rivers, highways, etc. )

Topographic Maps • • Are general reference maps showing coastlines, cities, and rivers that use contour lines to show elevation differences. Such maps are helpful to hikers because they can show elevation changes along a trail Government agencies like the U. S. Geological Survey (USGS) produce these maps that are often based on satellite data or aerial photography.

Thematic Maps • • Isoline Choropleth Proportional symbol Dot Density

Choropleth Map

Choropleth Map • Use color shading to represent different quantities or values. Darker colors usually represent greater quantities or values, while lighter colors usually represent smaller quantities or values.

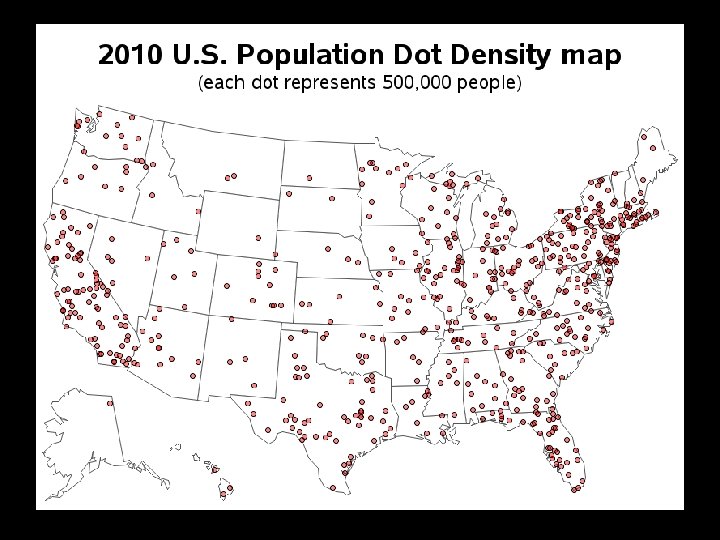
Dot Density Map

Dot Density Map • • • Uses points to show the precise locations of specific observations or occurrences place individual points on a map to correspond with occurrences of a particular feature or data Clusters of dots show where the features or data are concentrated

Proportional Symbol Map

Proportional Symbol Map • • Use symbols of different sizes placed within an area to show the value or quantity associated with it. The symbol is often a circle, but it may be one that relates to the map’s theme (such as figures of people to represent population data).

Isoline Map

Isoline Map • • Connects points of equal or very similar values Use lines to connect points of equal value, such as temperature, rainfall, or elevation. Lines of equal temperature are called isotherms • Lines of equal rainfall are called isohyets • Lines of equal elevation are called contours • • Contour lines are often used on topographic maps

Other Types of Maps Cartogram � Cognitive or Mind/Mental Map �

Cartogram

Cartogram • • distort the size and shape of map areas to show statistical data. For example, a cartogram of world population shows land area as proportional to population size—although the United States and China have similar land areas (the U. S. is slightly larger), a population cartogram would show China as much larger than the U. S. because its population is much larger.

Cognitive or Mind/Mental Map allies

Cognitive or Mind/Mental Map • • • Everyone has one It is a cognitive image of landscape in the human mind Common about most people’s mental maps is that we have accurate geographies of area around our home, school, and workplace Known landscape along transportation routes we use Other places not in our mental map is blank People can improve mental maps of places by using/reading maps

MAP PROJECTION & DISTORTION

Projection • • Transferring locations from Earth’s surface to a flat map Problem: distortion or alteration • Earth’s spherical shape and 3 -D continents pose a challenge for cartographers because drawing Earth on a 2 -D flat piece of paper produces some distortions.

Projections “All maps lie flat, and all flat maps lie”

Equal Area Projection an equal-area map projection map showing parallels and the equator as straight lines and other meridians as curved; used to map tropical latitudes. � Type of: map projection. a projection of the globe onto a flat map using a grid of lines of latitude and longitude. �

Equal Area Projection � Advantages: Shows true size and shape of land masses. � Disadvantages: Distorts (interrupts) shape of water areas

Peters Projection • • • Equal area Advantages: Accurately represents the actual area of landforms. Disadvantages: distorts other properties like shape
 Advantages: Better balance of")
Robinson Projection • • • Compromise (neither equal or conformal) Advantages: Better balance of size and shape of high-latitude lands than in Mercator or Mollweide. Directions true along all parallels and along central meridian. Disadvantages: Distorts shape, area, scale, and distance in an attempt to balance the errors and so one property is not drastically distorted

Mercator Projection � Conformal � because it accurately represents the shape of landforms � � Advantages: Used for marine navigation Disadvantages: It is not equal in area because sizes of landforms are drastically distorted � Example: Greenland is larger on map than it should be

Azimuthal Projection • • • Flat-plan constructed maps of each hemisphere Advantages: Directions from a central point are evident. Direction is accurate Disadvantages: Distances from all other points are incorrect, and areas and shapes get distorted more that one moves away from the center of the projection.

PLACE

Place � � � A location on Earth distinguished by a particular characteristic Occupies a unique location Has things in common with other places An area bounded by space of some human importance Humans have a strong sense or feeling of it �A hometown, vacation destination, country

� � People don’t have to live there in order for a place to exist Geographers describe features of it �To show similarities, differences, and changes across the globe �Identify its location or position on the Earth’s surface �Three ways to identify location: 1. place name 2. site 3. situation

1. Place name � � What is its name and why When human importance is recognized, it is common to assign a place name Toponym: name for a place or location Example- people that came from England, York, and Jersey in Europe came to US and named their new homes New England, New York, and New Jersey

2. Site � what it looks like � the physical characteristics of place �Example- New York City is located on a large, deep water harbor, next to the Atlantic Ocean

3. Situation � � how its location and attributes are related to other places a place’s interrelatedness with other places �Example- New York has the most prominent trade and finance center in US (1800 s) Uses Hudson River to transport goods to and from New England is a major port along the Atlantic Circular Trade Has much greater potential than Boston, Philadelphia and Charleston because of its large inland waterway

Change in Place � � Attributes of place change overtime Causes of change� Sequent occupancy: the succession of groups and cultural influences throughout a place’s history Several different historical layers contribute to placespecific culture, society, politics, and economy �For example�Santa Fe, New Mexico �Has complex mix of multiple Native American, Spanish colonial, and modern American influences �based on the sequence of past and current societal influences

REGIONS

1. Formal Region � � Is an area of space with a boundary that possesses some homogeneous characteristic or uniformity (similarity) There is one thing that is the same within this region Culture (common language) Political (boundary lines) Environment (ecotones; ex. the space between the Sahara Desert and the tropical savanna is a dry grassland known as the Sahel)

2. Functional or Nodal Region � � � Areas that have a central place or node that is the focus or point of origin Also known as “nodal region” Strongest influence of central place for those who live closest to it Distance decay is experienced by those further away from the central place The influence of this point is strongest in the areas close to the center � Example- Example: market area for a sports team will have the strongest fan base and intensive medial network coverage in areas close to the team’s home city

3. Perceptual Region � � � Also known as a vernacular region is made up by the residents of the places; is based on the things these residents feel define it as a particular region Example� Some people in the American South believe that what defines their region is the country music bands, numbers of Southern Baptist Churches, and NASCAR races � Southern Californians may define their region as having sunny weather, surfing, Mexican food, rap and rock music, laid back (“dude”) and health-oriented citizens

Regionalization � area with one or more unique characteristics � a type of place Ex: Bible Belt, Sun Belt, etc.

SPACE

Space � � � Is a geometric surface or area on the earth When geographers analyze or think about space it is called “spatial analysis” or “thinking spatially” When thinking about space (“thinking spatially”) � Geographers look objects in a space � Objects could be trees, people, buildings, and even whole cities � They observe how these objects are distributed or spread out and see if there is a pattern � They analyze any relationships, connections, movement, growth and change in the objects or in the space overtime

Distribution How objects or people are distributed or spread out in a space or location � Three properties of distribution in space: � �Density �Concentration �Pattern
 that something exists in a space � People, houses,")
1. Density The frequency (rate) that something exists in a space � People, houses, cars, or trees are items that are measured �
 density: is calculated by number of things per square")
Types of Density �Arithmetic (population) density: is calculated by number of things per square unit of distance � Physiologic density: measures the number of people per square unit of arable land � Land that has been farmed and land that has the potential to be farmed � So, how many ppl have to be fed with how much land is open for farming. � Agricultural density: refers to the number of people needed to farm per square unit of land � Land is actively used for farming

2. Concentration � The spread of something over a space or location �If it is close, it is called clustered. �If it is spread out, it is called dispersed. � It helps describe changes in distribution.

Clustered or Dispersed

Clustered or Dispersed

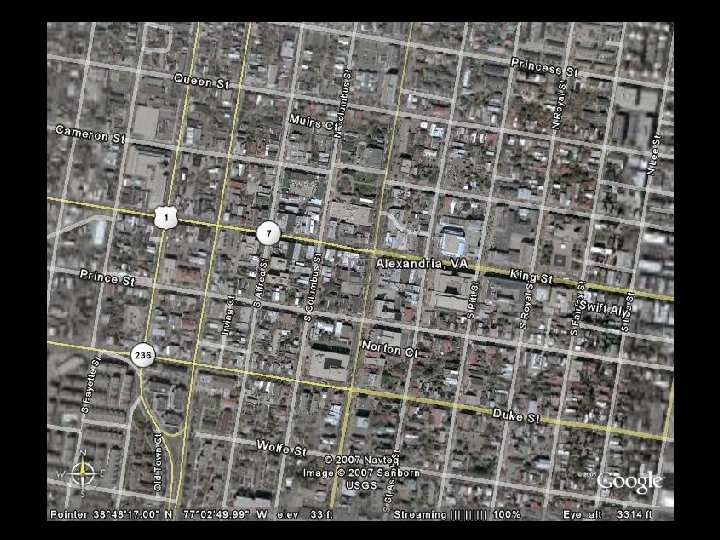
3. Pattern Geometric arrangement of objects in a space � Objects are usually arranged in square or rectangular patterns � Patterns of streets � �On a grid

DIFFUSION

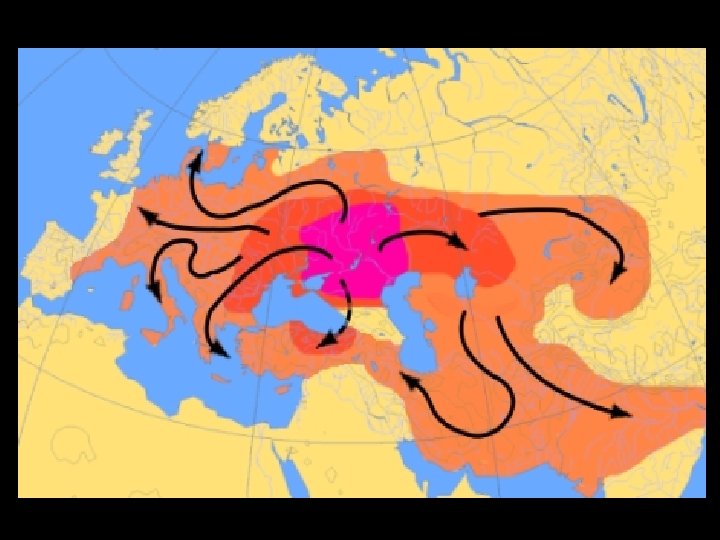
Spatial Diffusion � Diffusion: is the process by which characteristics spread from one place to another overtime � There a number of ways and patterns that human phenomena diffuse or spread spatially or spread across Earth’s surface � Hearth: place where innovation originates � hearth orginiates when a cultural group is willing to try something new � This cultural group seeks out interaction with other persons, objects, and ideas in other regions � They diffuse

Expansion Diffusion and Types � � Expansion diffusion: a pattern that starts in a central place and then expands outward in all directions to other locations Three types of expansion diffusion: � Hierarchical diffusion: spread of idea from persons of authority (political leaders) Moves from first-order location down to subordinate secondorder location For example- fashion trends, go from one urban center to another. � Contagious diffusion: diffusion of characteristic throughout population Starts at point of origin then moves to nearby locations For example- spread of disease or news

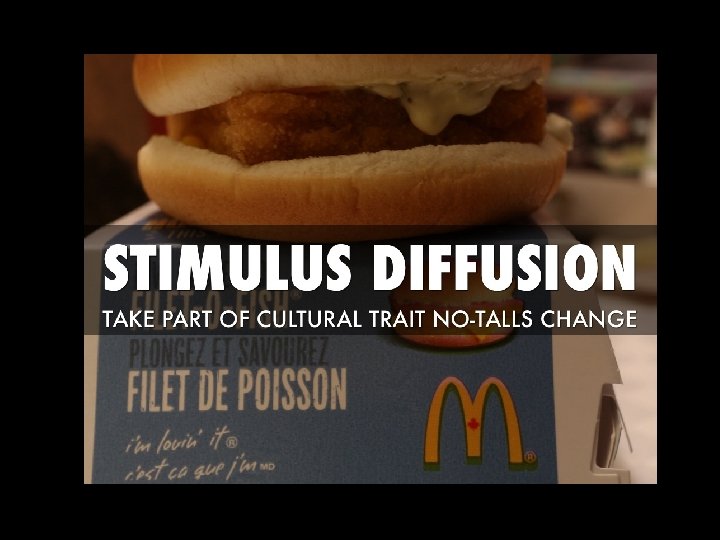
� Stimulus Diffusion: an idea or principle diffuses which stimulates the creation of new products or ideas � For example- when vegetarian eating habits (principle) influence restaurants to offer more vegetarian dishes

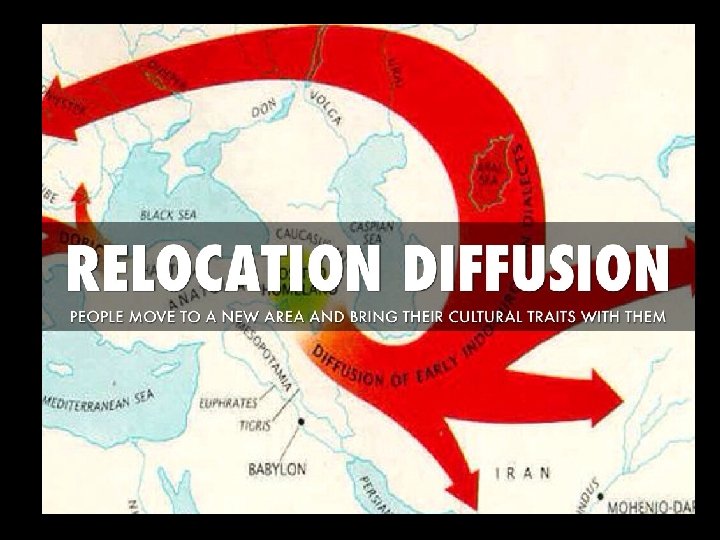
Relocation Diffusion � Ideas and items spread from point of origin and then crosses a significant physical barrier Barrier can be ocean, mountain range, or desert They can spread language, technology, religion, disease and culture �For example: Explorers venture to America bringing new language, religion, disease and culture with them.
- Slides: 59