
Chapter 1 Acquisition Modelling Introduction Teaching Style for

























- Slides: 180
Chapter 1: Acquisition Modelling Introduction
Teaching Style for Modelling • Overall objective is to teach more complex project finance theory and concepts through modelling. • Don’t use really big template models. Instead work from blank sheet and understand sophisticated issues. • You can find models at www. edbodmer. com • Understanding the modelling concepts is much more important than typing formulas in excel. • If you find yourself typing formulas instead of understanding the concepts STOP TYPING (you will receive and e-mail of the completed model). 2
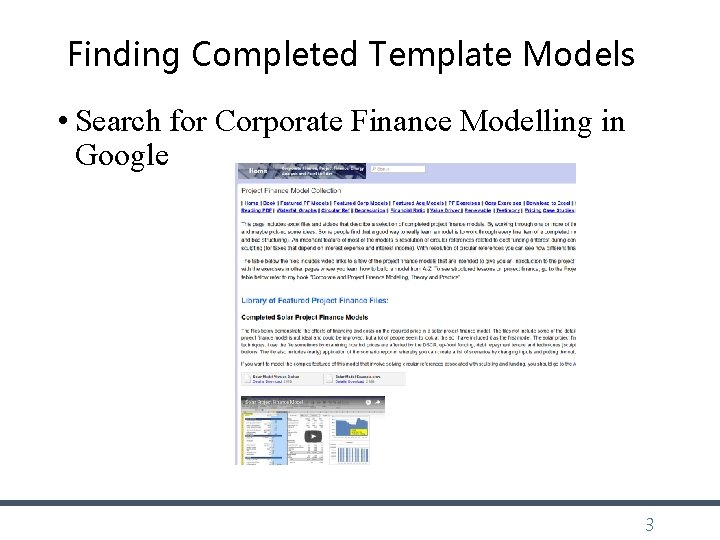
Finding Completed Template Models • Search for Corporate Finance Modelling in Google 3
Teaching Style - 2 • Review the general finance theory and concepts first. • Do this very quickly with power point slides as many of the concepts have been discussed • Do this because modelling is not useful unless understand the project finance concept • After discussing the modelling concept, add issues into a simple model. • Many issues are much better analysed with a simple demonstration in excel rather than a big model with 30 sheets. 4
Financial Modelling Religion and FAST • Various organisations have rules for modelling. • One good technique for modelling (and maybe for your life) is FAST. (General conflict between Structure and Flexible) • Flexible: Different timing, scenarios, financing techniques. • Accurate or appropriate. The balance sheet must balance • S • T • Structured. • Separate financing from operations. • Transparent – short equations. 5
What does Flexibility Mean in Corporate Model • Add new history without re-doing the model • Alternative terminal value timing • Addition of different scenario analysis • Alternative valuation techniques • Different types of assumptions (e. g. A/R to sales as last year or historic average)
Accurate/Appropriate • Accurate and Appropriate • Level of detail in model • Balance sheet and other tests • ROIC presentation 7
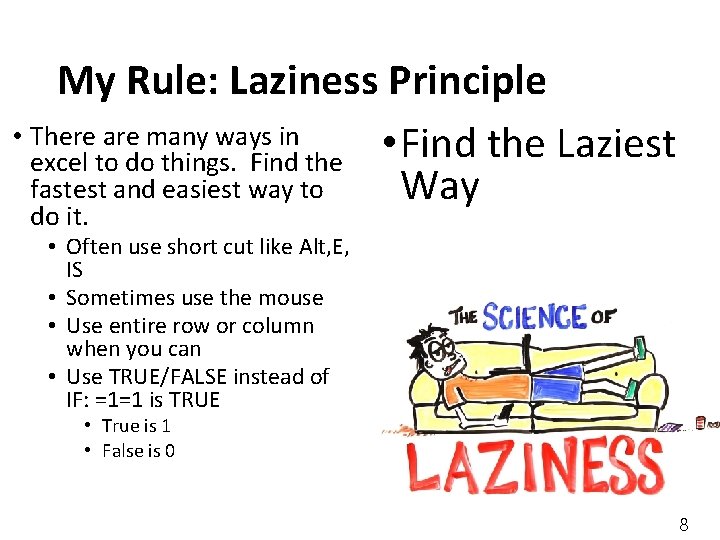
My Rule: Laziness Principle • There are many ways in • Find the Laziest excel to do things. Find the fastest and easiest way to Way do it. • Often use short cut like Alt, E, IS • Sometimes use the mouse • Use entire row or column when you can • Use TRUE/FALSE instead of IF: =1=1 is TRUE • True is 1 • False is 0 8
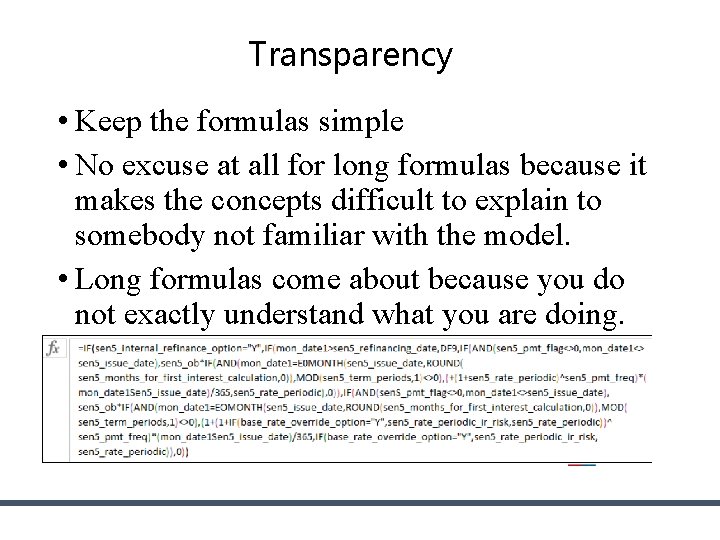
Transparency • Keep the formulas simple • No excuse at all for long formulas because it makes the concepts difficult to explain to somebody not familiar with the model. • Long formulas come about because you do not exactly understand what you are doing.
Excel Functions • We will use short-cuts, excel enhancements, TRUE/FALSE switches and only four functions. • The functions should be used in a way that you are probably not used to. • INDEX • LOOKUP (not VLOOKUP or HLOOKUP) • SUMIF (or AVERAGEIF or COUNTIF) • EDATE • MAX and MIN for Waterfalls (not IF) 10
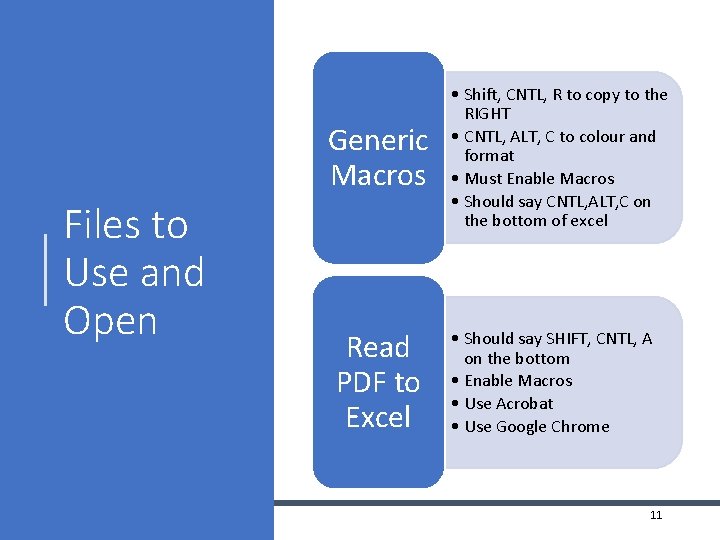
Generic Macros Files to Use and Open Read PDF to Excel • Shift, CNTL, R to copy to the RIGHT • CNTL, ALT, C to colour and format • Must Enable Macros • Should say CNTL, ALT, C on the bottom of excel • Should say SHIFT, CNTL, A on the bottom • Enable Macros • Use Acrobat • Use Google Chrome 11
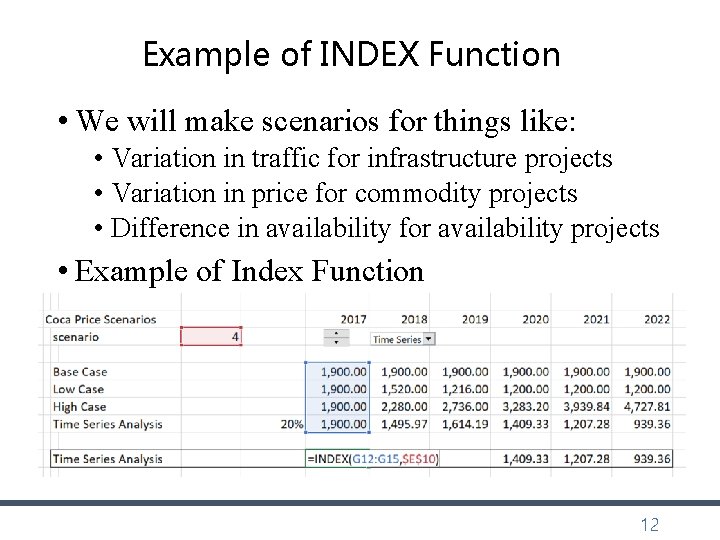
Example of INDEX Function • We will make scenarios for things like: • Variation in traffic for infrastructure projects • Variation in price for commodity projects • Difference in availability for availability projects • Example of Index Function 12
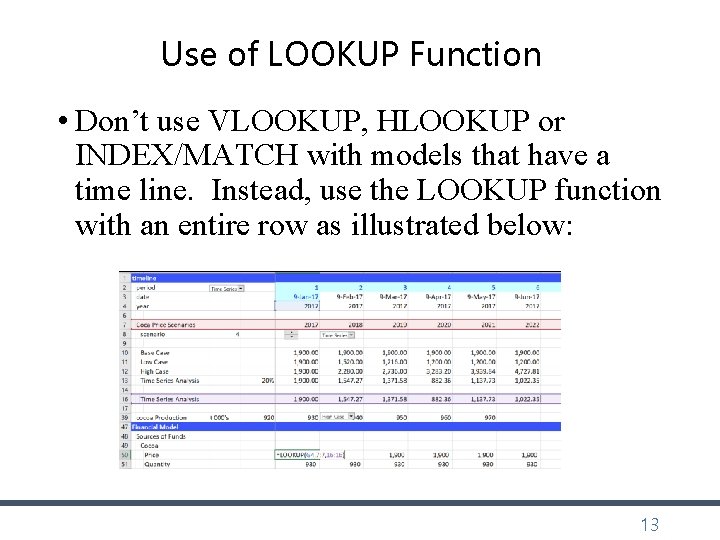
Use of LOOKUP Function • Don’t use VLOOKUP, HLOOKUP or INDEX/MATCH with models that have a time line. Instead, use the LOOKUP function with an entire row as illustrated below: 13
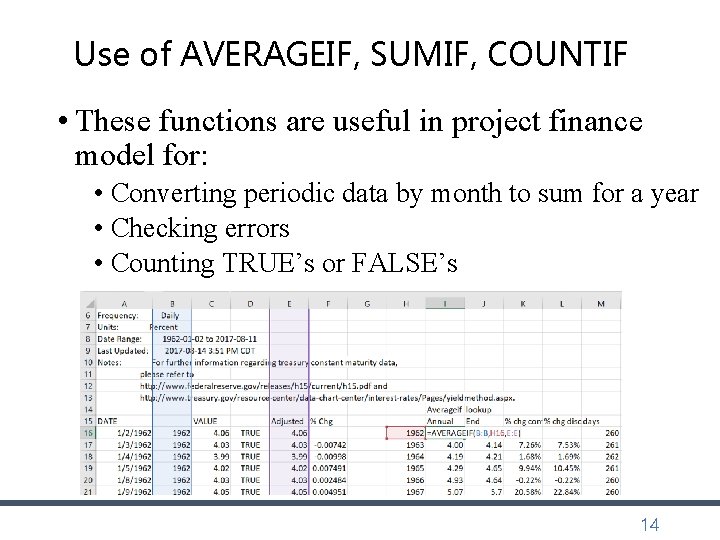
Use of AVERAGEIF, SUMIF, COUNTIF • These functions are useful in project finance model for: • Converting periodic data by month to sum for a year • Checking errors • Counting TRUE’s or FALSE’s 14
Chapter 2: Difficulties in Corporate Finance Modelling
Valuation and Magic Potion • Calculation of Cost of Capital with CAPM and Expected Market Risk Premium • Adjustments to WACC for Tax Deduction on Interest and Debt Beta • Use of Valuation Formula: Value = Income x (1 g/ROIC)/(WACC-g) • Assumption that a Company will suddenly become a stable company in equilibrium • Myriad of adjustments for political risk, liquidity, beta mean reversion, small company risk … • Methods to Normalise Cash Flow in Terminal Period
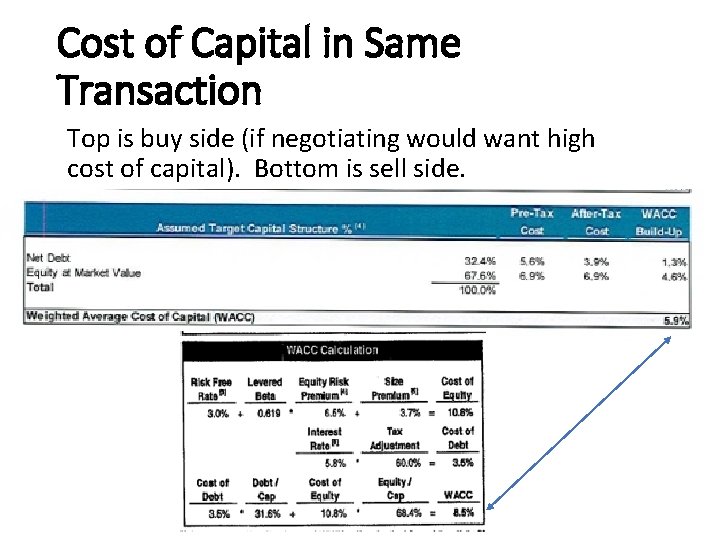
Cost of Capital in Same Transaction Top is buy side (if negotiating would want high cost of capital). Bottom is sell side.
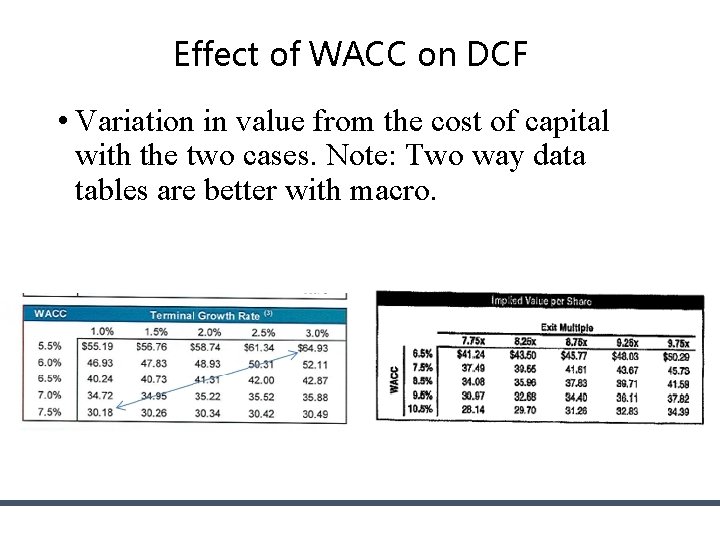
Effect of WACC on DCF • Variation in value from the cost of capital with the two cases. Note: Two way data tables are better with macro.
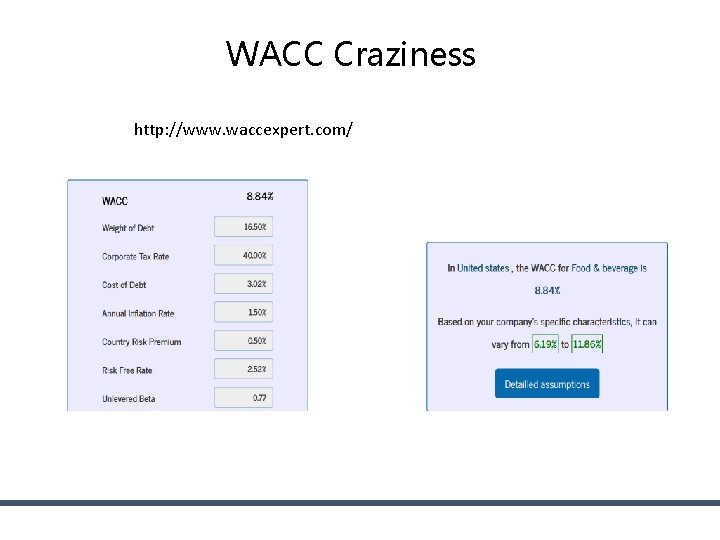
WACC Craziness http: //www. waccexpert. com/
Corporate Finance Ideas for Simple Company • Lets say you can find the following: • A company with some fluctuations in return, but not too much. • A company that grows at about the same rate in real terms as the population (e. g. a food company). • An industry where P/E multiples and EV/EBITDA multiples are stable across companies and stable over time. • An industry where there is quite a lot of competition and assets are not very capital intensive.
Companies Used in Mc. Kinsey Book and Typical Examples • Fed Ex • UPS • Heiniken • Disney • Walgreens • General Mills
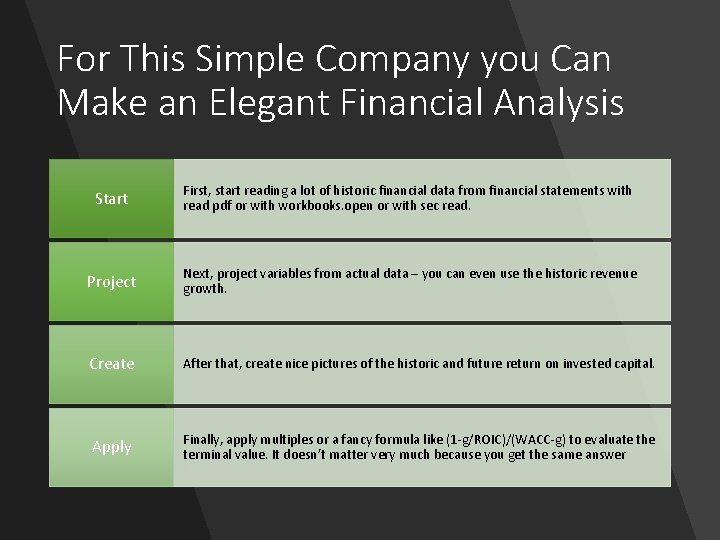
For This Simple Company you Can Make an Elegant Financial Analysis Start First, start reading a lot of historic financial data from financial statements with read pdf or with workbooks. open or with sec read. Project Next, project variables from actual data – you can even use the historic revenue growth. Create After that, create nice pictures of the historic and future return on invested capital. Apply Finally, apply multiples or a fancy formula like (1 -g/ROIC)/(WACC-g) to evaluate the terminal value. It doesn’t matter very much because you get the same answer
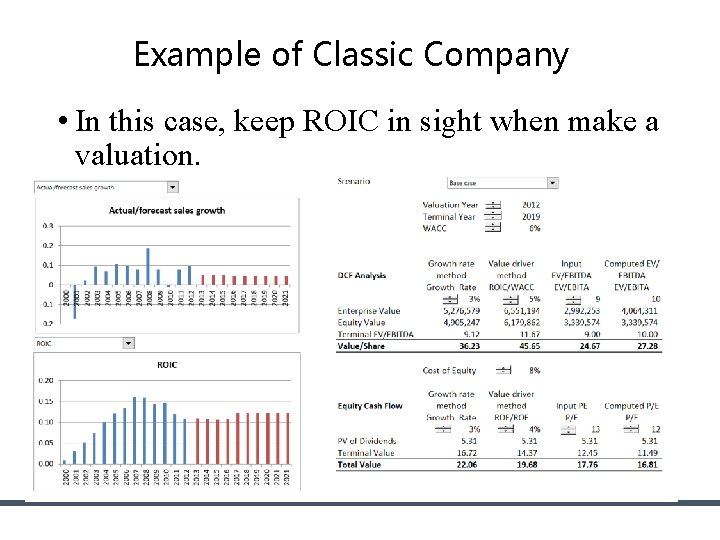
Example of Classic Company • In this case, keep ROIC in sight when make a valuation.
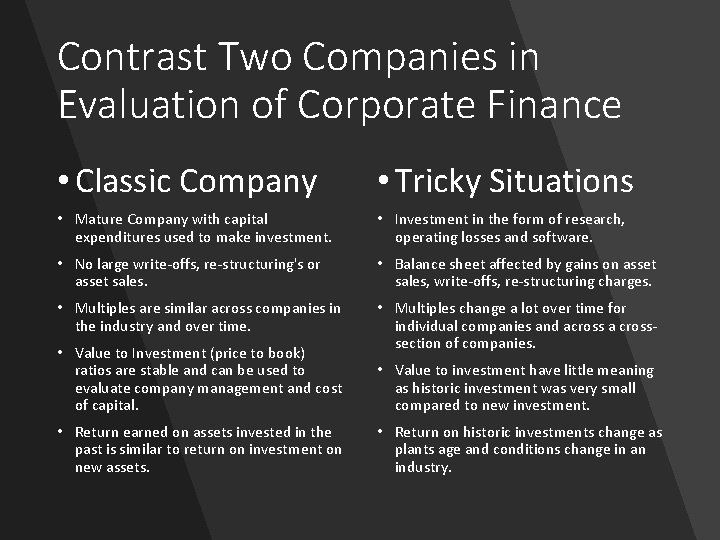
Contrast Two Companies in Evaluation of Corporate Finance • Classic Company • Tricky Situations • Mature Company with capital expenditures used to make investment. • Investment in the form of research, operating losses and software. • No large write-offs, re-structuring's or asset sales. • Balance sheet affected by gains on asset sales, write-offs, re-structuring charges. • Multiples are similar across companies in the industry and over time. • Multiples change a lot over time for individual companies and across a crosssection of companies. • Value to Investment (price to book) ratios are stable and can be used to evaluate company management and cost of capital. • Return earned on assets invested in the past is similar to return on investment on new assets. • Value to investment have little meaning as historic investment was very small compared to new investment. • Return on historic investments change as plants age and conditions change in an industry.
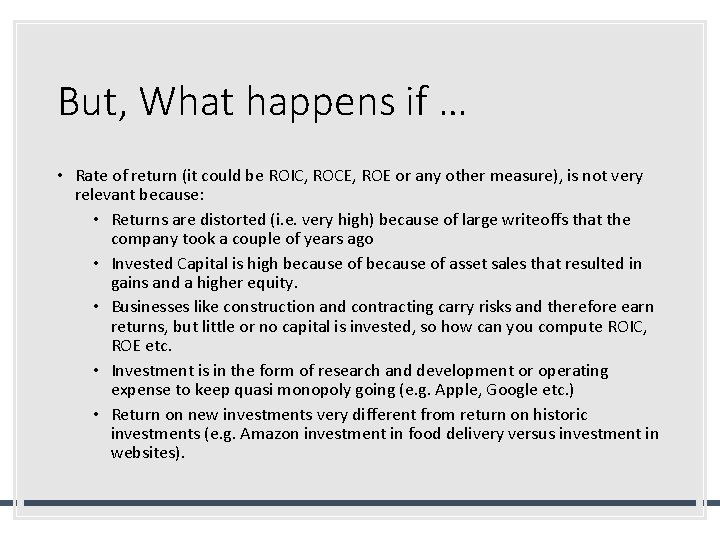
But, What happens if … • Rate of return (it could be ROIC, ROCE, ROE or any other measure), is not very relevant because: • Returns are distorted (i. e. very high) because of large writeoffs that the company took a couple of years ago • Invested Capital is high because of asset sales that resulted in gains and a higher equity. • Businesses like construction and contracting carry risks and therefore earn returns, but little or no capital is invested, so how can you compute ROIC, ROE etc. • Investment is in the form of research and development or operating expense to keep quasi monopoly going (e. g. Apple, Google etc. ) • Return on new investments very different from return on historic investments (e. g. Amazon investment in food delivery versus investment in websites).
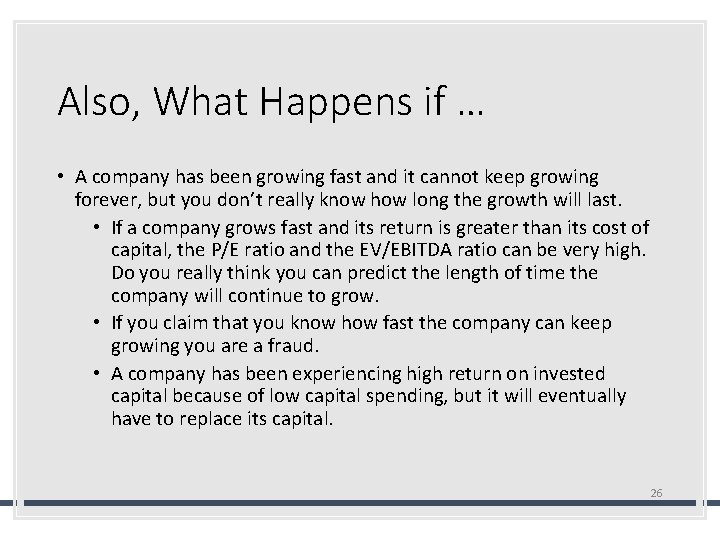
Also, What Happens if … • A company has been growing fast and it cannot keep growing forever, but you don’t really know how long the growth will last. • If a company grows fast and its return is greater than its cost of capital, the P/E ratio and the EV/EBITDA ratio can be very high. Do you really think you can predict the length of time the company will continue to grow. • If you claim that you know how fast the company can keep growing you are a fraud. • A company has been experiencing high return on invested capital because of low capital spending, but it will eventually have to replace its capital. 26
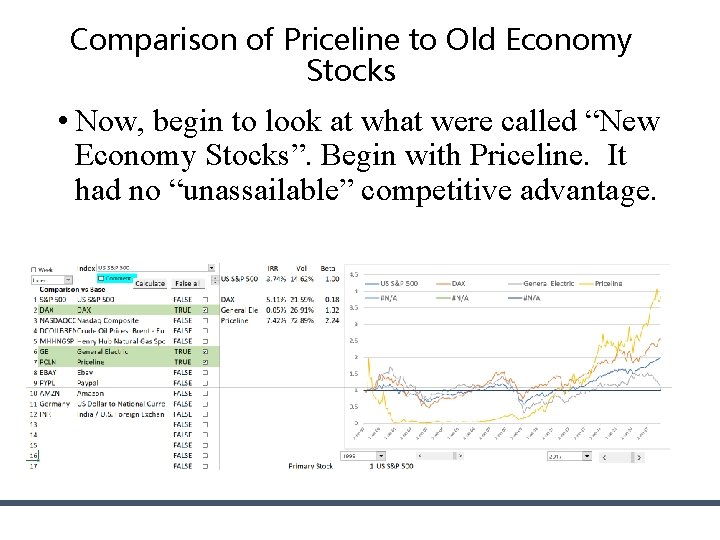
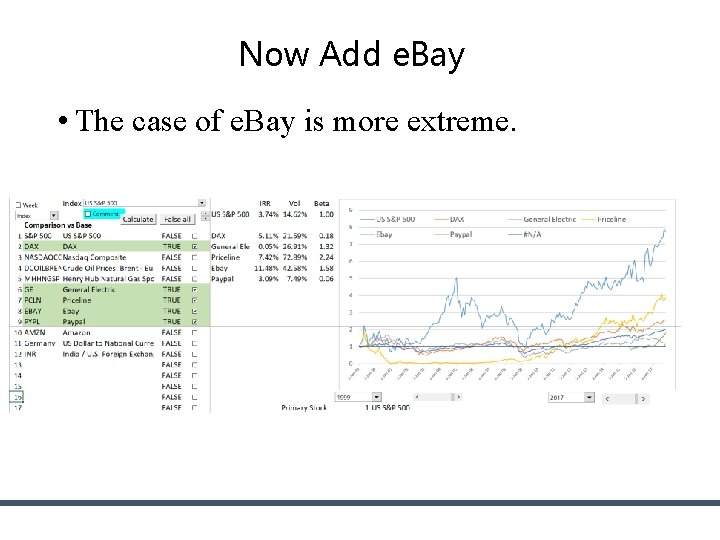
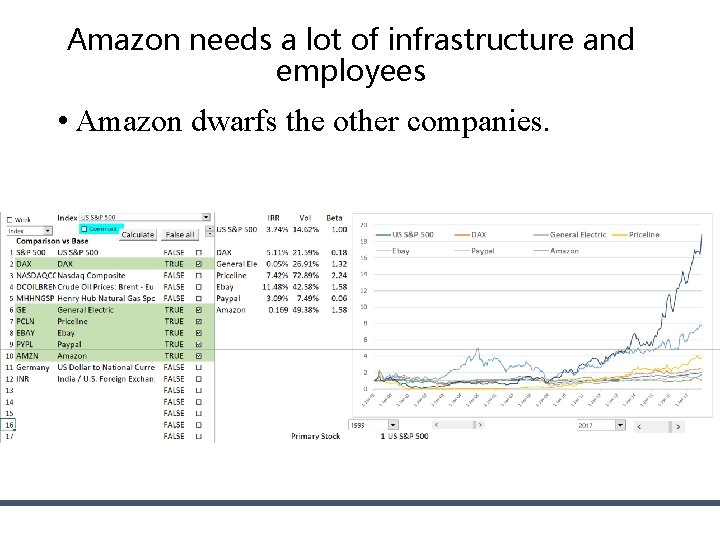
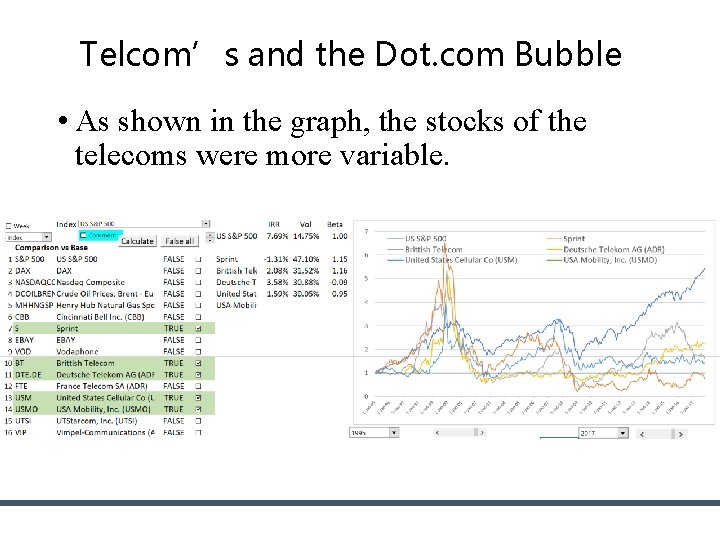
Were the “New Economy” Ideas Not So Stupid • The new economy concepts were that real options could be created if a company gains scale. These ideas were laughed at. But after 20 years, maybe some of the ideas were not so silly. • For example, “the extraordinarily high anticipated profits represented by stock prices during the Internet bubble never materialized, because there was no ‘new economy. ’” • Get data from the comprehensive stock price file. • The real thing that happened during the dot. com bubble was with telecom companies • Use Amazon, Priceline, Pay Pal, EBAY
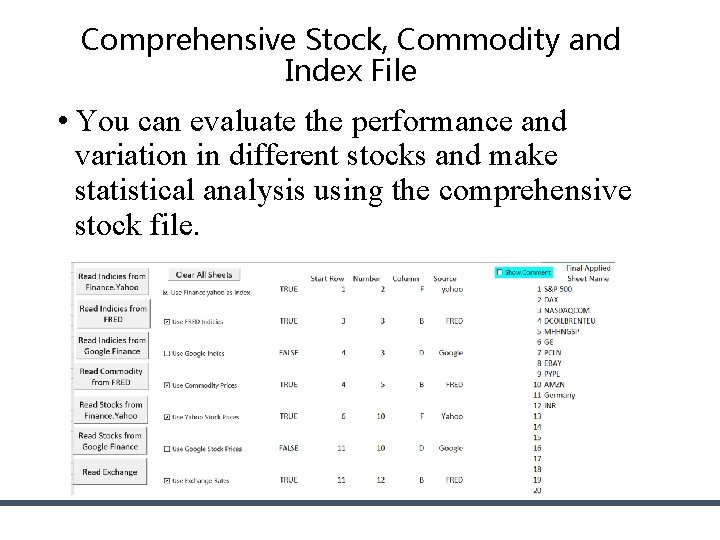
Comprehensive Stock, Commodity and Index File • You can evaluate the performance and variation in different stocks and make statistical analysis using the comprehensive stock file.
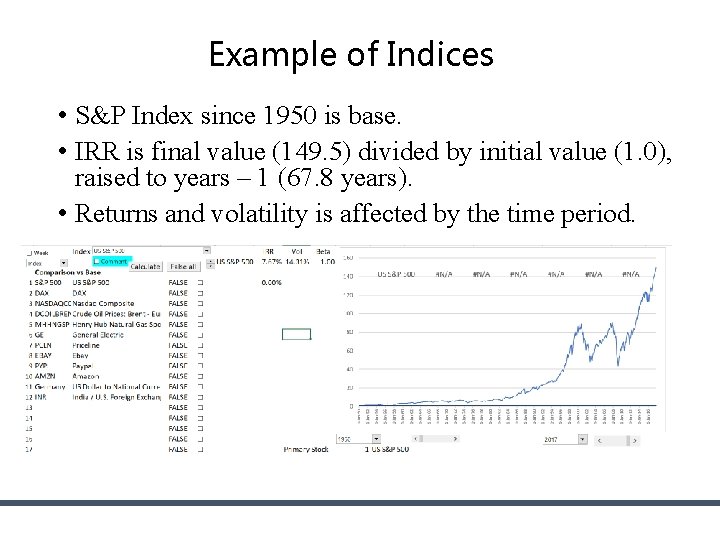
Example of Indices • S&P Index since 1950 is base. • IRR is final value (149. 5) divided by initial value (1. 0), raised to years – 1 (67. 8 years). • Returns and volatility is affected by the time period.
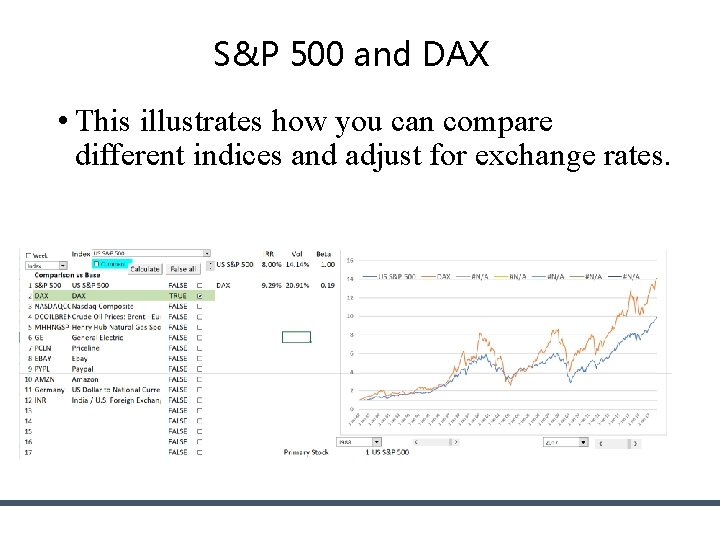
S&P 500 and DAX • This illustrates how you can compare different indices and adjust for exchange rates.
Fundamental Economic Question of Economic Growth and Stock Value Growth • Can stocks out-grow the overall economy in the long-run. • What has been the return on stocks (with dividend re-investment) relative overall economic growth. • If stocks do not grow faster than the economy, then investors are not compensated for taking risk.
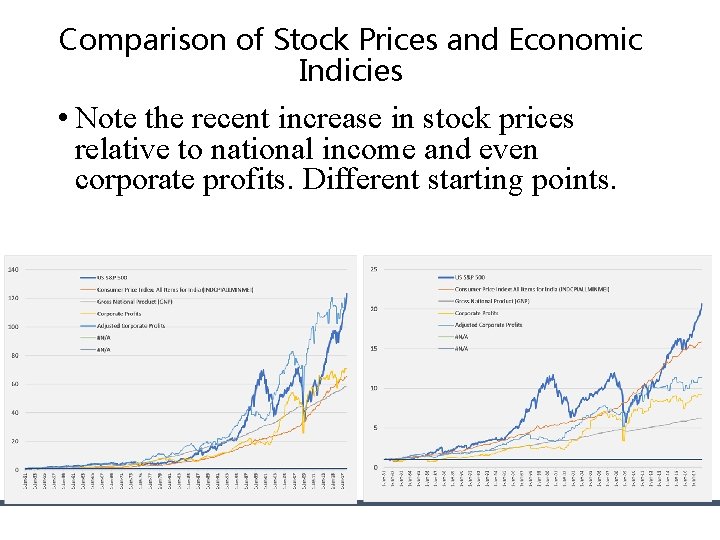
Comparison of Stock Prices and Economic Indicies • Note the recent increase in stock prices relative to national income and even corporate profits. Different starting points.
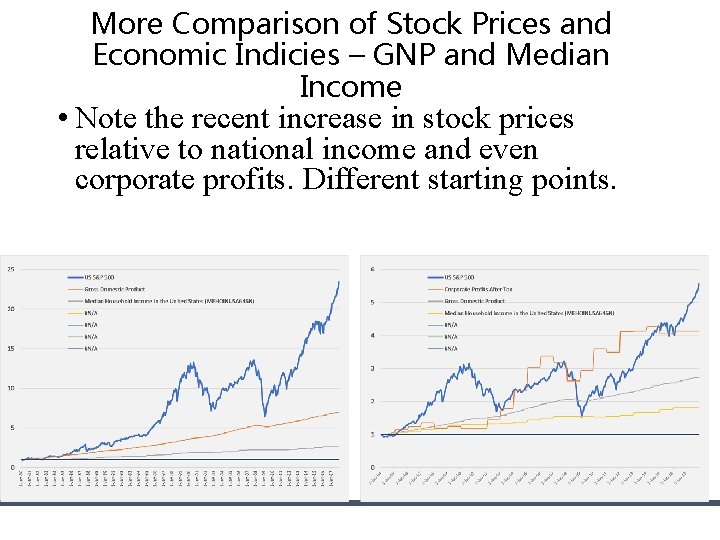
More Comparison of Stock Prices and Economic Indicies – GNP and Median Income • Note the recent increase in stock prices relative to national income and even corporate profits. Different starting points.
Stock Prices of New Economy Stocks versus Old Economy Stocks • During the Internet bubble, managers and investors lost sight of what drove return on invested capital (ROIC); indeed, many forgot the importance of this ratio entirely. Many executives and investors either forgot or threw out fundamental rules of economics in the rarefied air of the Internet revolution. • The notion of “winner take all” led companies and investors to believe naively that all that mattered was getting big fast, and that they could worry about creating an effective business model later. Increasing-returns logic was also mistakenly applied to online pet supplies and grocery delivery services, even though these firms had to invest (unsustainably, eventually) in more drivers, trucks, warehouses, and inventory when their customer base grew. When the laws of economics prevailed, as they always do, it was clear that many Internet businesses did not have the unassailable competitive advantages required to earn even modest returns on invested capital. • unassailable competitive advantages = addiction to products or creating a monopoly
Comparison of Priceline to Old Economy Stocks • Now, begin to look at what were called “New Economy Stocks”. Begin with Priceline. It had no “unassailable” competitive advantage.
Now Add e. Bay • The case of e. Bay is more extreme.
Amazon needs a lot of infrastructure and employees • Amazon dwarfs the other companies.
Telcom’s and the Dot. com Bubble • As shown in the graph, the stocks of the telecoms were more variable.
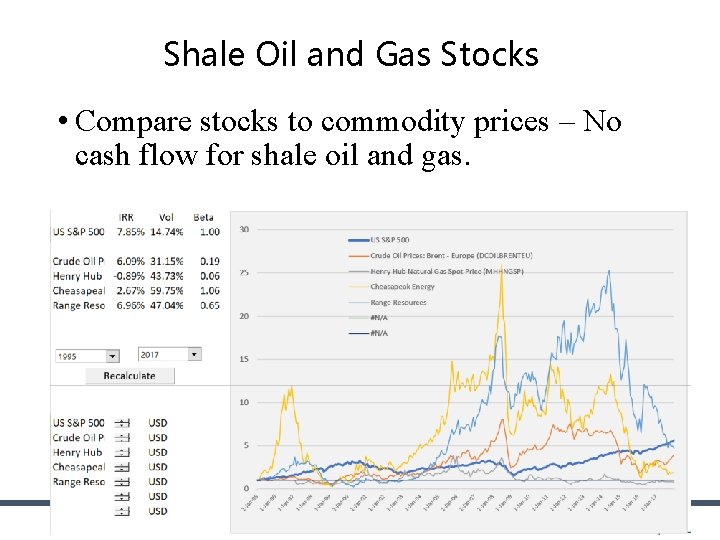
Shale Oil and Gas Stocks • Compare stocks to commodity prices – No cash flow for shale oil and gas. 39
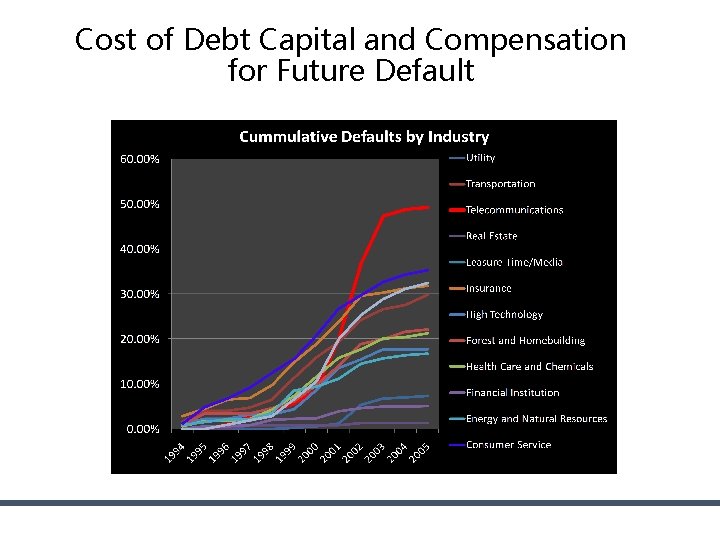
Cost of Debt Capital and Compensation for Future Default
Football Field Diagram and Alternative Valuation Approaches with Different Ranges in Value
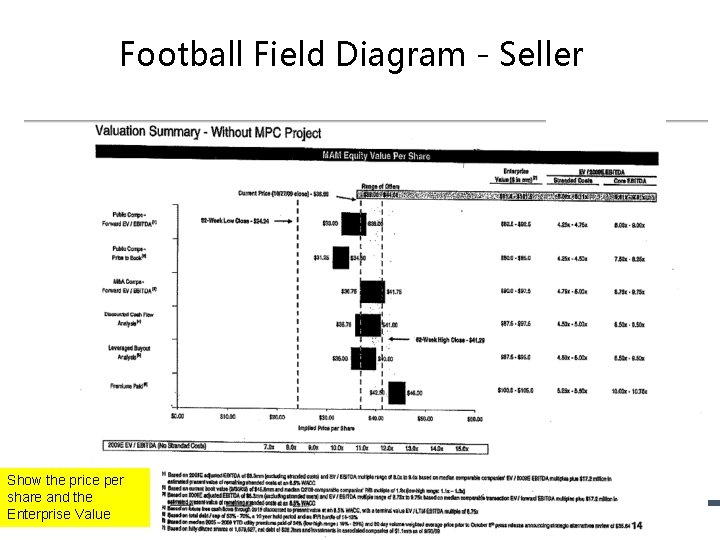
Football Field Diagram - Seller Show the price per share and the Enterprise Value
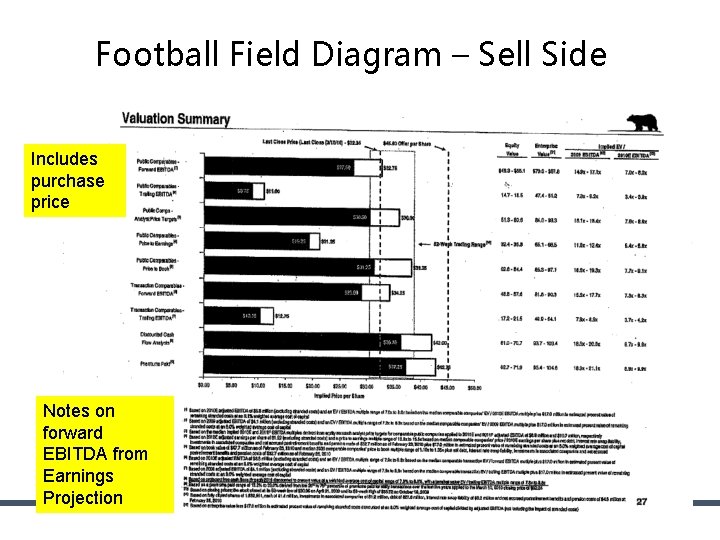
Football Field Diagram – Sell Side Includes purchase price Notes on forward EBITDA from Earnings Projection
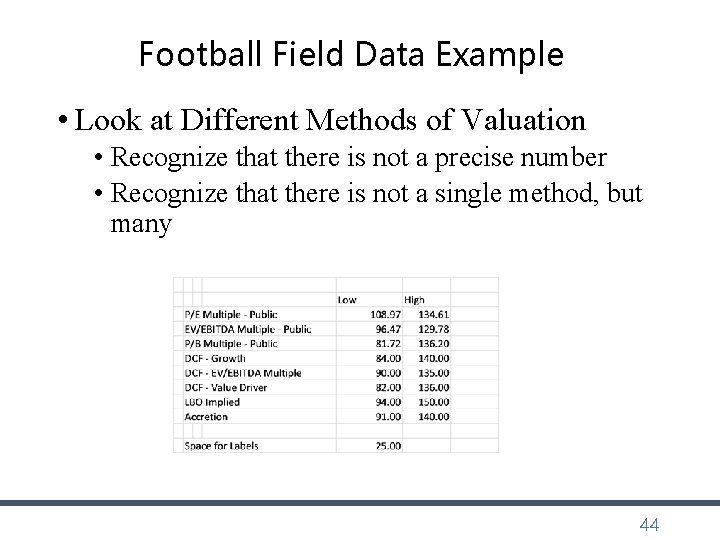
Football Field Data Example • Look at Different Methods of Valuation • Recognize that there is not a precise number • Recognize that there is not a single method, but many 44
Football Field Diagram in Exercise File • Example – tricky technical part is to create space for labels
What do Multiples Really Mean and Evaluation of History of Multiples
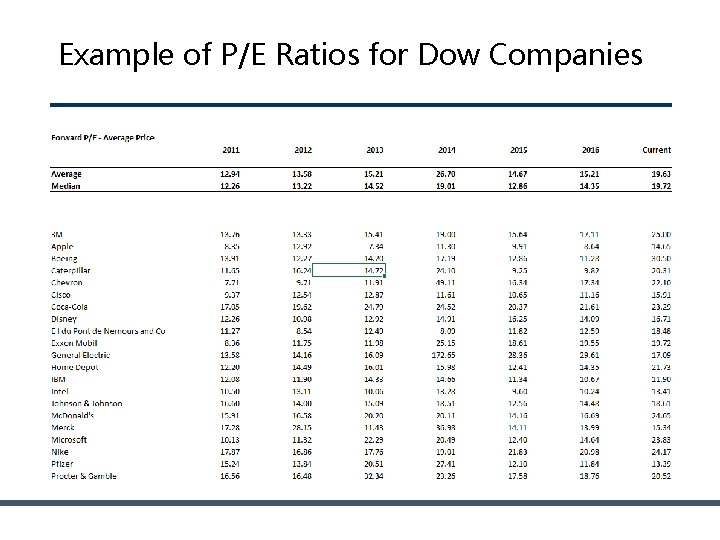
Example of P/E Ratios for Dow Companies
P/E Ratios for Selected Companies 48
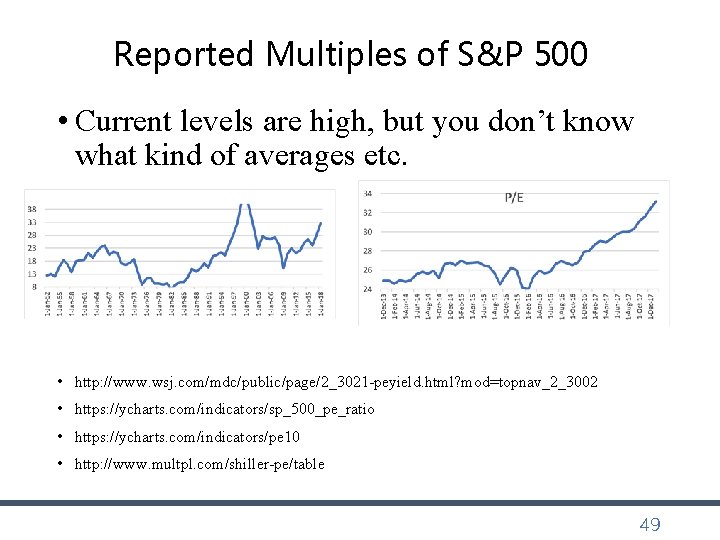
Reported Multiples of S&P 500 • Current levels are high, but you don’t know what kind of averages etc. • http: //www. wsj. com/mdc/public/page/2_3021 -peyield. html? mod=topnav_2_3002 • https: //ycharts. com/indicators/sp_500_pe_ratio • https: //ycharts. com/indicators/pe 10 • http: //www. multpl. com/shiller-pe/table 49
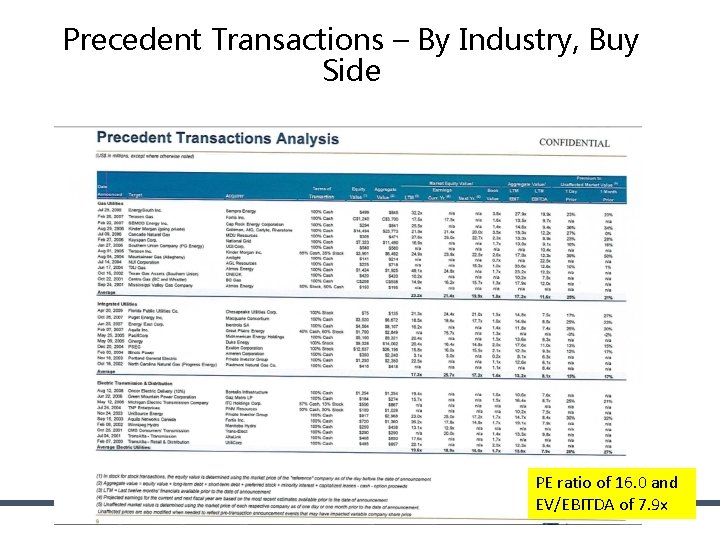
Precedent Transactions – By Industry, Buy Side PE ratio of 16. 0 and EV/EBITDA of 7. 9 x
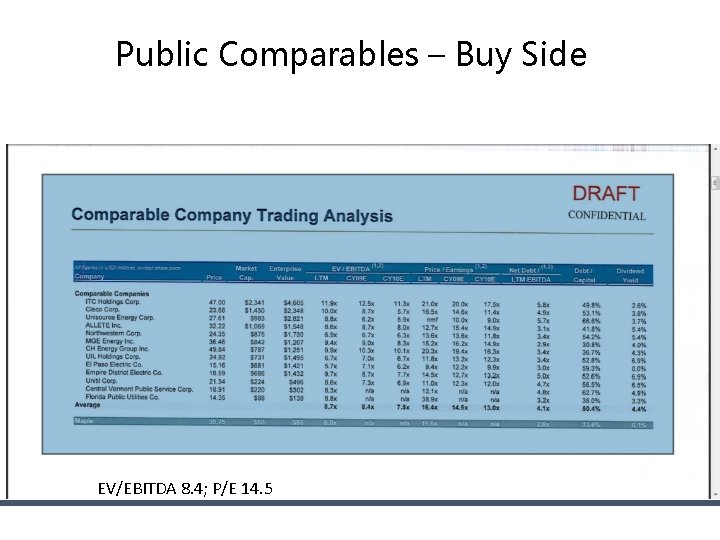
Public Comparables – Buy Side EV/EBITDA 8. 4; P/E 14. 5
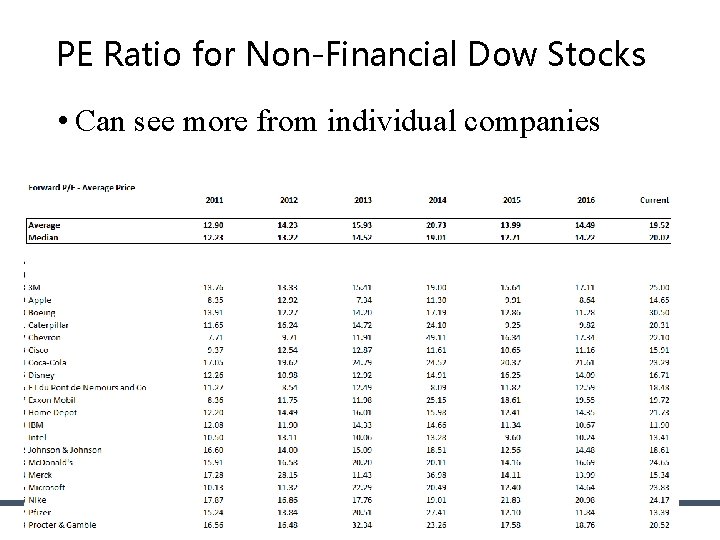
PE Ratio for Non-Financial Dow Stocks • Can see more from individual companies 52
P/E and EV/EBITDA for Apple • Note the Increase in P/E and EV/EBITDA for Apple 53
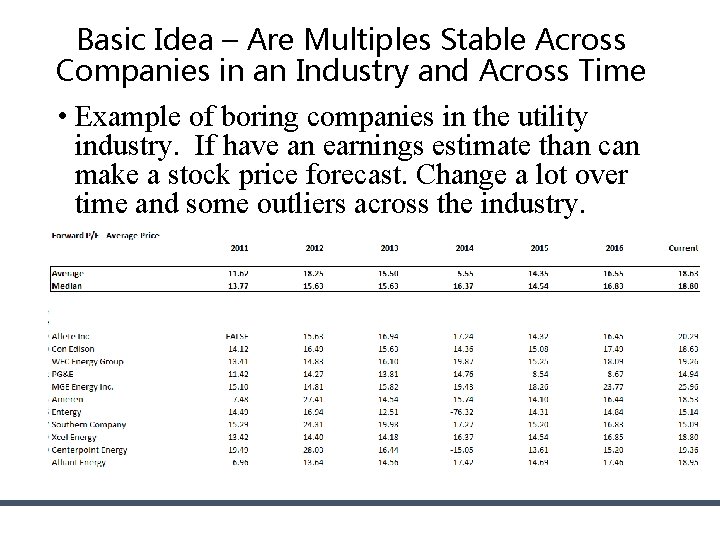
Basic Idea – Are Multiples Stable Across Companies in an Industry and Across Time • Example of boring companies in the utility industry. If have an earnings estimate than can make a stock price forecast. Change a lot over time and some outliers across the industry.
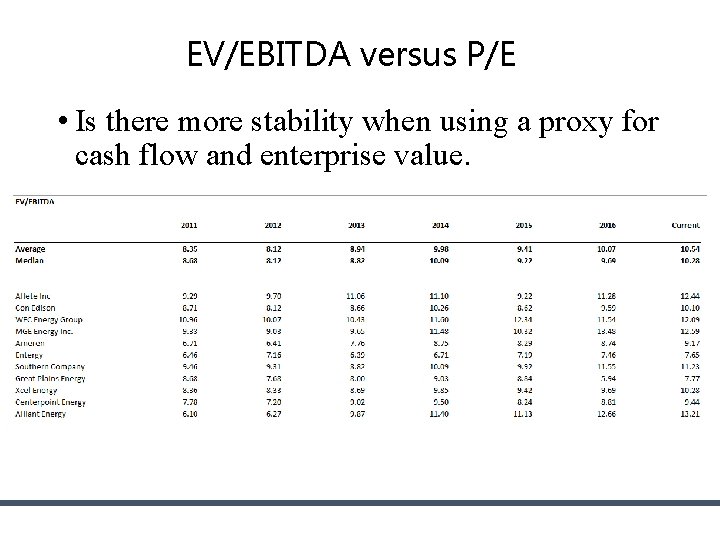
EV/EBITDA versus P/E • Is there more stability when using a proxy for cash flow and enterprise value.
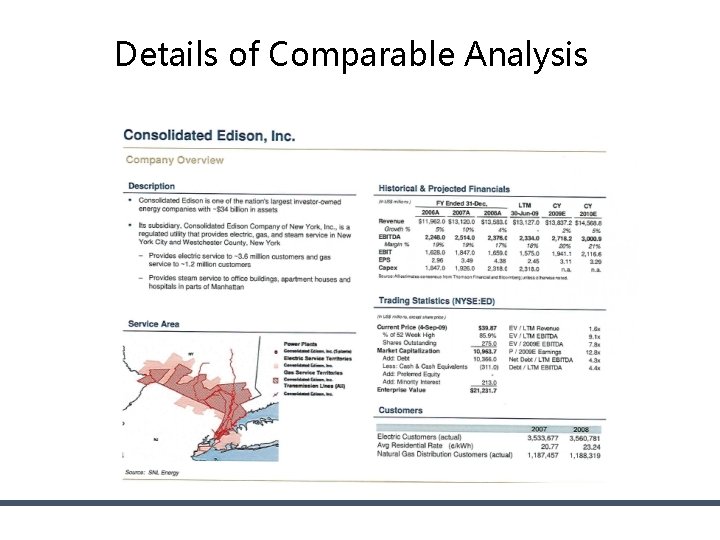
Details of Comparable Analysis
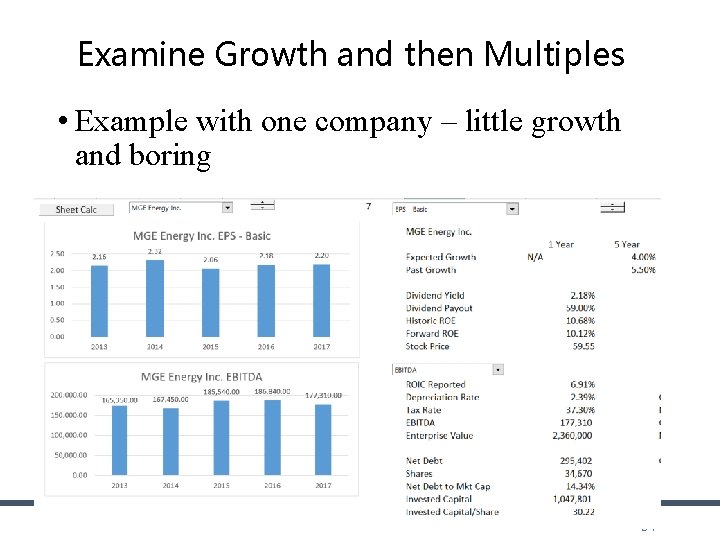
Examine Growth and then Multiples • Example with one company – little growth and boring 57
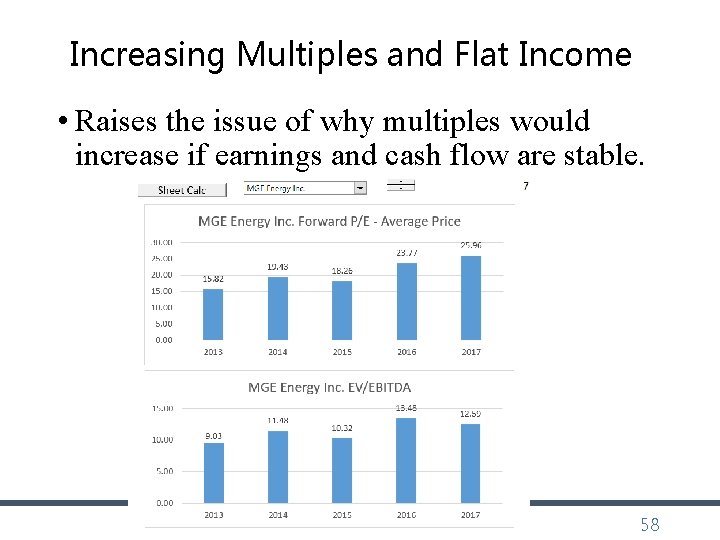
Increasing Multiples and Flat Income • Raises the issue of why multiples would increase if earnings and cash flow are stable. 58
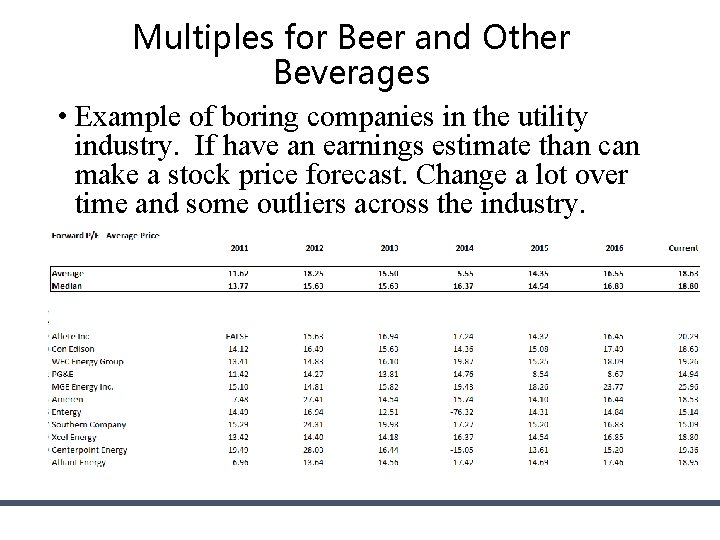
Multiples for Beer and Other Beverages • Example of boring companies in the utility industry. If have an earnings estimate than can make a stock price forecast. Change a lot over time and some outliers across the industry.
Why is the P/E Ratio Higher for One Company than Another Company • Reasons for Differences in P/E • Cost of equity capital and risk is higher for Apple than for Google • Future growth in earnings per share and ROE is lower for Apple than for Google • ROE for Apple with fall and ROE for Google will increase 60
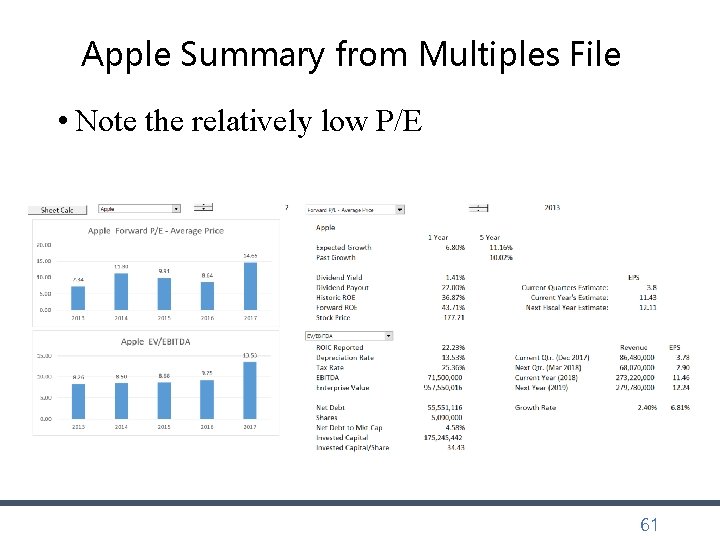
Apple Summary from Multiples File • Note the relatively low P/E 61
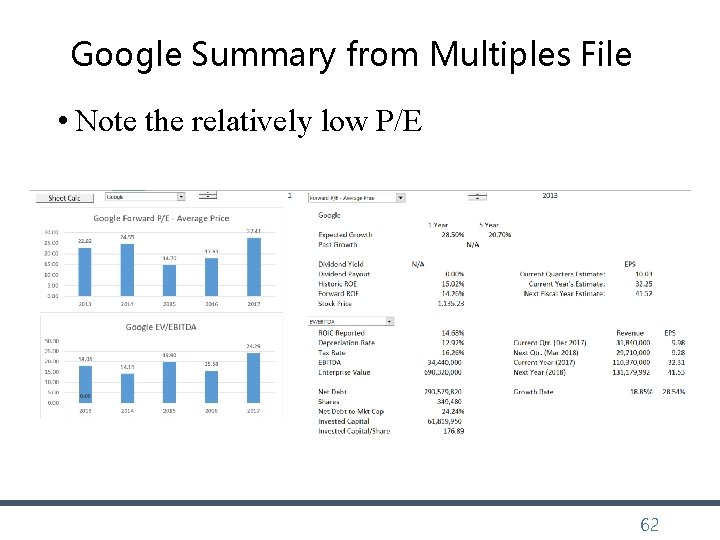
Google Summary from Multiples File • Note the relatively low P/E 62
Why is the EV/EBITDA different for Different Companies • EV/EBITDA will be lower for companies that need to replace assets more quickly. If the net investment is the same and the EBITDA is the same, the company with shorter lived assets will have to replace assets more quickly and have more capital expenditures for the same EBITDA. This means EV/EBITDA will be lower for companies with higher depreciation rates. • This means you cannot theoretically compare the EV/EBTIDA across different industries with different types of assets (and also within the industry)
Multiples and DCF • A leading sell-side analyst recently told us that he uses discounted cash flow to analyze and value companies but typically communicates his findings in terms of implied multiples. For example, an analyst might say Company X deserves a higher multiple than Company Y because it is expected to grow faster, earn higher margins, or generate more cash flow. Earnings multiples are also a useful sanity check for your valuation. • In practice, we always compare a company’s implied multiple based on our valuation with those of its peers to see if we can explain why its multiple is higher or lower in terms of its ROIC or growth rates.
Fundamental Valuation Ideas • Objective is to get monopoly profit and then to grow these profits (not making judgment about capitalism here). Value depends on the return from your investment. • ROIC • Growth • Cost of Capital • There is no question about theses basic ideas and one can think of valuation as forecasting movements in these three variables. • The most difficult thing to think about is what will happen to the rate of return. • If you do not make an investment, use of ROIC does not work anymore.
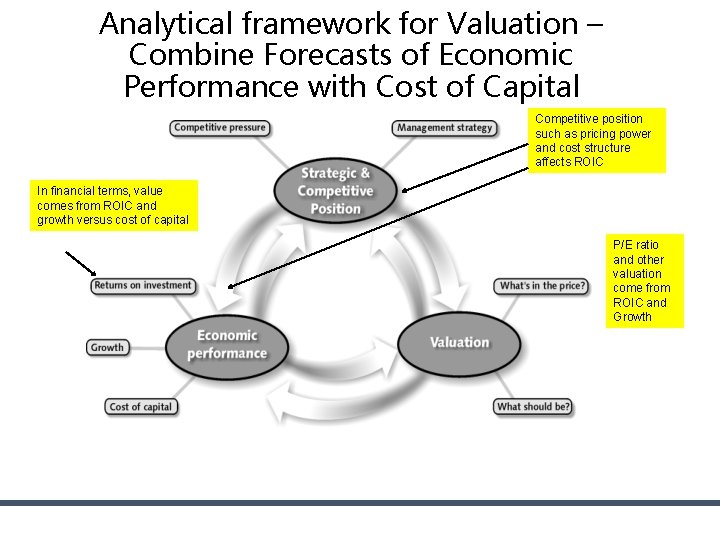
Analytical framework for Valuation – Combine Forecasts of Economic Performance with Cost of Capital Competitive position such as pricing power and cost structure affects ROIC In financial terms, value comes from ROIC and growth versus cost of capital P/E ratio and other valuation come from ROIC and Growth
Of Course You Should Invest when Return Exceeds Cost of Capital – This is NPV Rule • The interaction between growth and ROIC is a key factor to consider when assessing the likely impact of a particular investment on a company’s overall ROIC. For example, we’ve found that some very successful, high-ROIC companies in the United States are reluctant to invest in growth if it will reduce their ROICs. • One technology company had a 30 percent operating margin and ROIC of more than 50 percent, so it didn’t want to invest in projects that might earn only 25 percent returns, fearing this would dilute its average returns. • But as the first principle of value creation would lead you to expect, even an opportunity with a 25 percent return would still create value as long as the cost of capital was lower, despite the resulting decline in average ROIC.
Fundamental Idea about Investment Necessary to Generate Return • If you don’t make an investment, you cannot improve your life. • If you don’t make capital expenditures, you cannot get EBITDA. • If you don’t pay for a stock, you cannot get dividends. • Even when you gamble, you must put some money down on the table. • But, what about: • Uber: drivers make investment and all Uber has is a bit of software • Services: You make money from your reputation (Deloitte, Cap Gemini, GE, Siemens, Law Firms, etc. ) • Construction contracts: You make money by constructing a plant and the investment in tractors etc. is very minor.
Quote from Mc. Kinsey Valuation Book • We (Mc. Kinsey) explain the two core principles of value creation: • (1) the idea that return on invested capital and growth drive cash flow, which in turn drives value, and • (2) the conservation of value principle, which says that anything that doesn’t increase cash flow doesn’t create value (unless it reduces risk). • Led to ideas about measuring all performance with return versus cost of capital and books on (ROIC-WACC) * Capital Charge
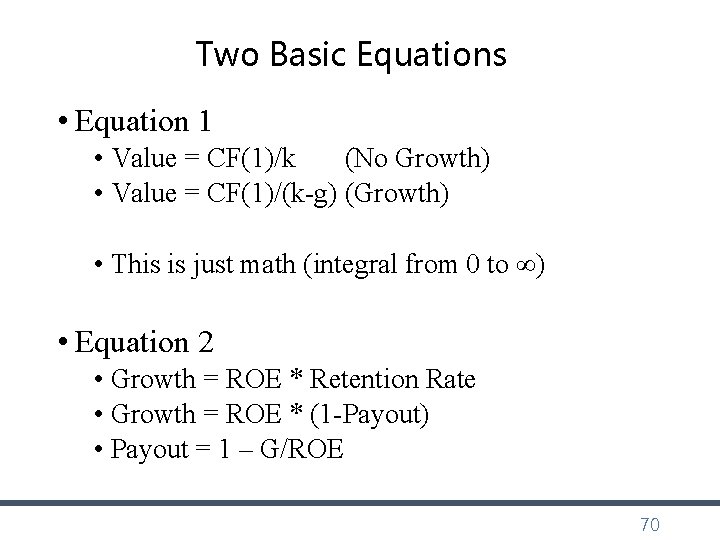
Two Basic Equations • Equation 1 • Value = CF(1)/k (No Growth) • Value = CF(1)/(k-g) (Growth) • This is just math (integral from 0 to ∞) • Equation 2 • Growth = ROE * Retention Rate • Growth = ROE * (1 -Payout) • Payout = 1 – G/ROE 70
For Equity, All you Have to Do is Substitute • Start with Basics • • Value = D 1/(k-g) Simple calculus DPO = (1 -g/ROE) Fundamental growth D 1 = E 1 * DPO Earnings Value = E 1 * (1 -g/ROE)/(k-g) • For P/E Ratio • Value/E 1 = (1 -g/ROE)/(k-g) • For P/B Ratio • E 1=Book Value * ROE 1 • Value = Book Value * ROE * (1 -g/ROE)/(k-g) • Value/Book Value = (ROE-g)/(k-g)
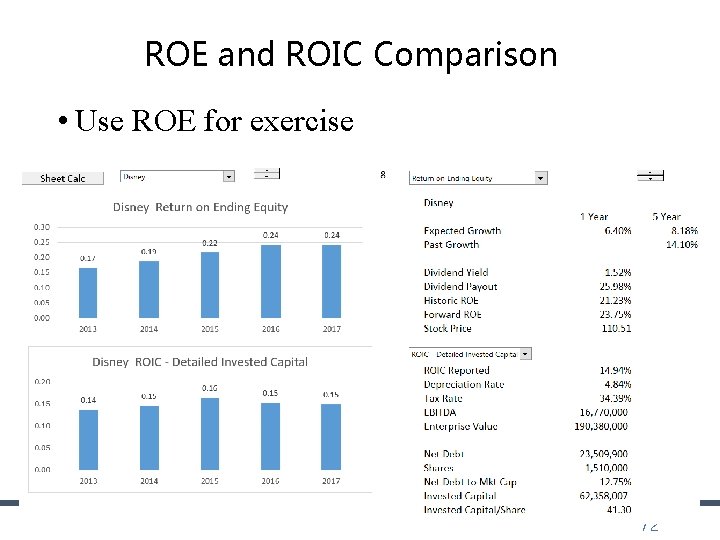
ROE and ROIC Comparison • Use ROE for exercise 72
Careful Calculation of ROIC • Long-term investments should be accounted for.
Growth Implication • If the growth is zero, the level of the return does not matter in the valuation formulas • This is not really true when growth rate changes. A change in return makes a big difference in any case.
Problems with These Formulas • Mc. Kinsey Discussion of the Formula: • This formula underpins the discounted-cash-flow (DCF) approach to valuation, and a variant of the equation lies behind the economic-profit approach (i. e. monopoly profit)…. You might go so far as to say that this formula represents all there is to valuation. Everything else is mere detail. ” • However, the formula is really not very good: • Only works when ROE and g and k are constant. • It does not work with inflation, because the value of the investment increases over time due to inflation. • It does not work if the return on new investments is different from the return on existing investments in cases such as high technology.
Case 1: Valuation with Constant ROE • Very simple case of valuation: • Return on equity and growth constant • No adjustment for inflation (assume no inflation) • In this case, you can use the valuation formula: Value = E x (1 -g/ROE)/(k-g) • You can also use the formula to evaluate implied cost of capital from P/E ratio, growth and assumed return on equity. • Silly to worry about ROE versus ROIC at this point. For now, can assume an all equity company with no net debt. 76
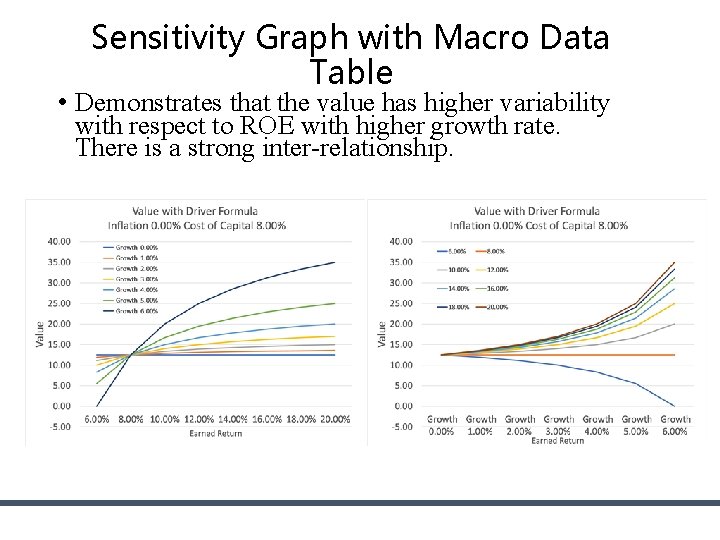
Valuation Sensitivity in Simple Case • Keep discount rate constant at 6% (the discount rate or the expected IRR is the biggest variable) • A graph of the data table demonstrates that the combination of variables makes the valuation change dramatically.
Sensitivity Graph with Macro Data Table • Demonstrates that the value has higher variability with respect to ROE with higher growth rate. There is a strong inter-relationship.
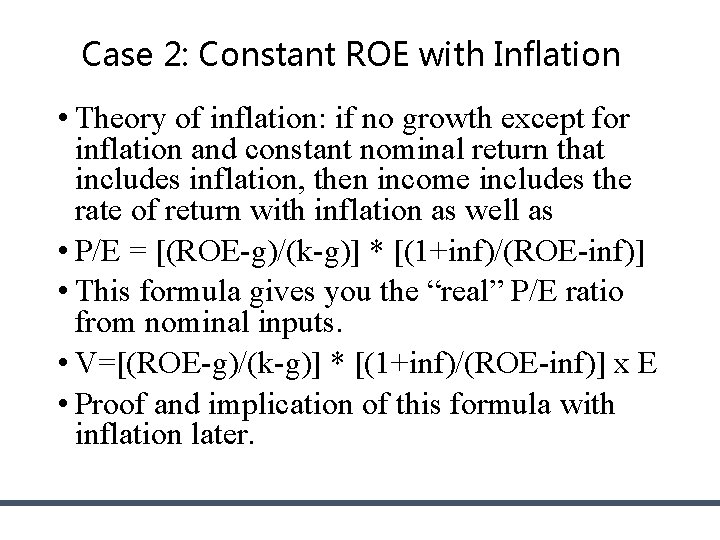
Case 2: Constant ROE with Inflation • Theory of inflation: if no growth except for inflation and constant nominal return that includes inflation, then income includes the rate of return with inflation as well as • P/E = [(ROE-g)/(k-g)] * [(1+inf)/(ROE-inf)] • This formula gives you the “real” P/E ratio from nominal inputs. • V=[(ROE-g)/(k-g)] * [(1+inf)/(ROE-inf)] x E • Proof and implication of this formula with inflation later.
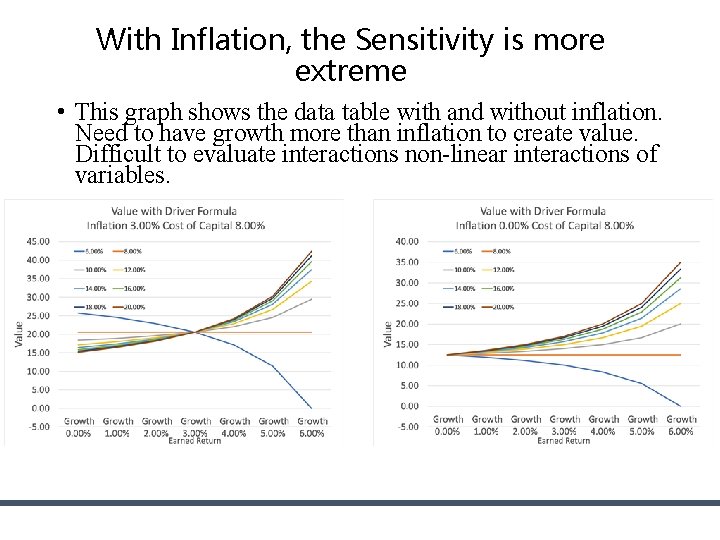
With Inflation, the Sensitivity is more extreme • This graph shows the data table with and without inflation. Need to have growth more than inflation to create value. Difficult to evaluate interactions non-linear interactions of variables.
With Inflation, the Sensitivity is more extreme • There is more sensitivity to ROE in the inflation case and the case with zero growth results in value that declines.
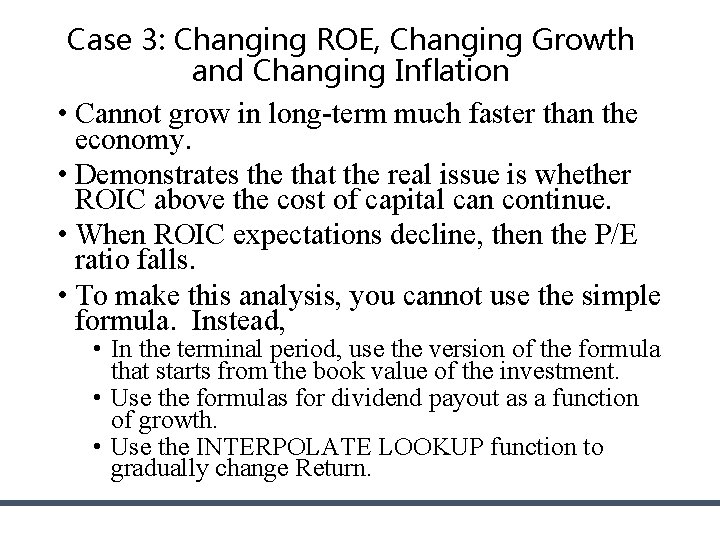
Case 3: Changing ROE, Changing Growth and Changing Inflation • Cannot grow in long-term much faster than the economy. • Demonstrates the that the real issue is whether ROIC above the cost of capital can continue. • When ROIC expectations decline, then the P/E ratio falls. • To make this analysis, you cannot use the simple formula. Instead, • In the terminal period, use the version of the formula that starts from the book value of the investment. • Use the formulas for dividend payout as a function of growth. • Use the INTERPOLATE LOOKUP function to gradually change Return.
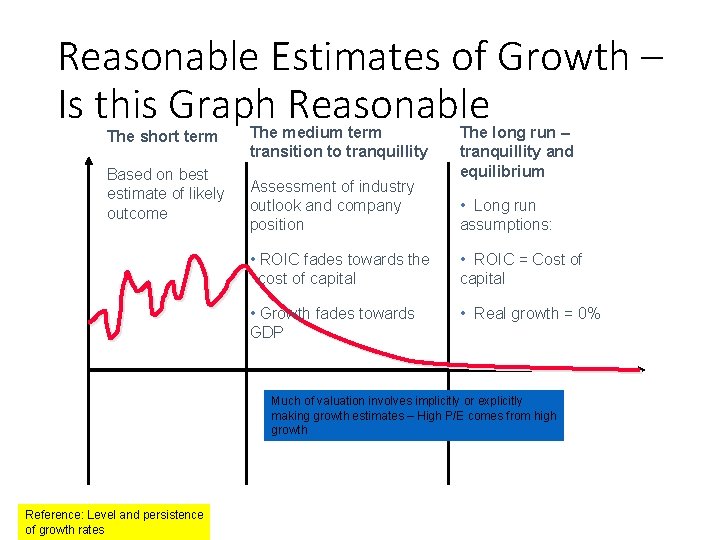
Reasonable Estimates of Growth – Is this Graph Reasonable The short term Based on best estimate of likely outcome The medium term transition to tranquillity Assessment of industry outlook and company position The long run – tranquillity and equilibrium • Long run assumptions: • ROIC fades towards the cost of capital • ROIC = Cost of capital • Growth fades towards GDP • Real growth = 0% Much of valuation involves implicitly or explicitly making growth estimates – High P/E comes from high growth Reference: Level and persistence of growth rates
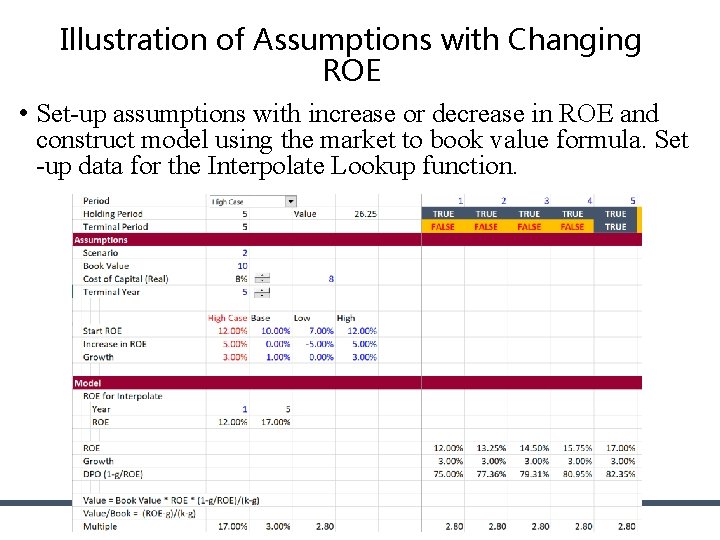
Illustration of Assumptions with Changing ROE • Set-up assumptions with increase or decrease in ROE and construct model using the market to book value formula. Set -up data for the Interpolate Lookup function.
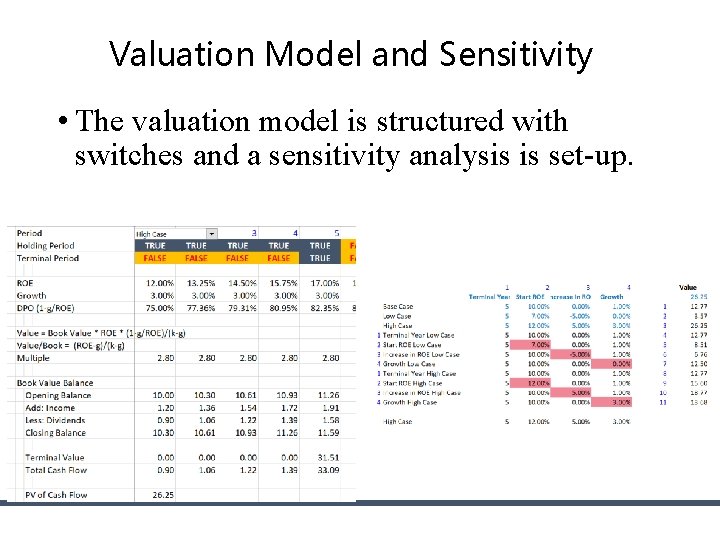
Valuation Model and Sensitivity • The valuation model is structured with switches and a sensitivity analysis is set-up.
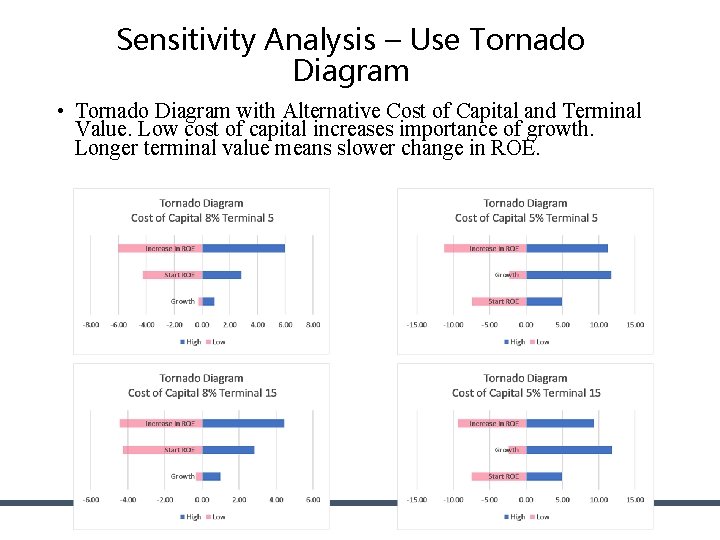
Sensitivity Analysis – Use Tornado Diagram • Tornado Diagram with Alternative Cost of Capital and Terminal Value. Low cost of capital increases importance of growth. Longer terminal value means slower change in ROE.
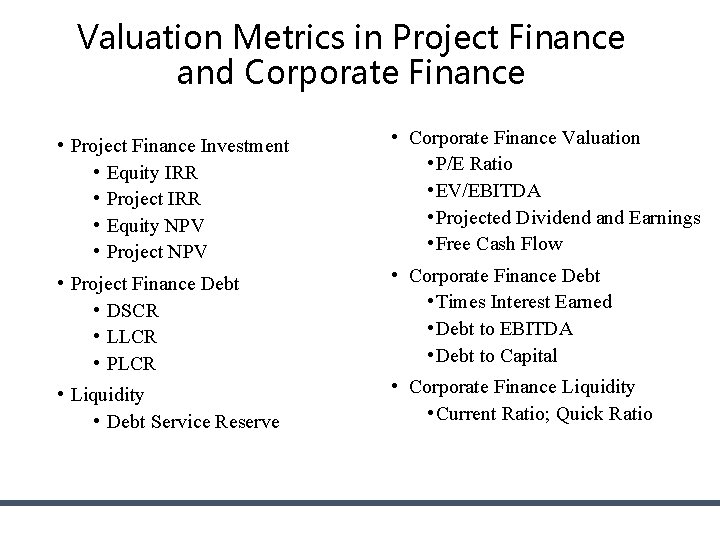
Valuation Metrics in Project Finance and Corporate Finance • Project Finance Investment • Equity IRR • Project IRR • Equity NPV • Project NPV • Corporate Finance Valuation • P/E Ratio • EV/EBITDA • Projected Dividend and Earnings • Free Cash Flow • Project Finance Debt • DSCR • LLCR • PLCR • Corporate Finance Debt • Times Interest Earned • Debt to EBITDA • Debt to Capital • Liquidity • Debt Service Reserve • Corporate Finance Liquidity • Current Ratio; Quick Ratio
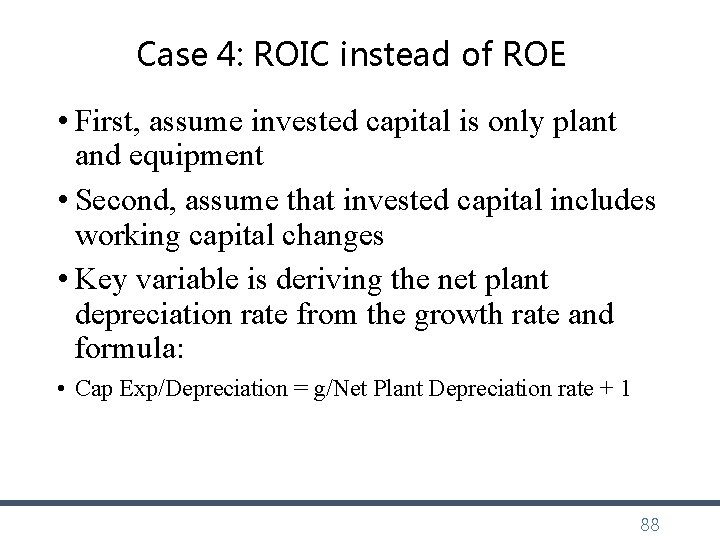
Case 4: ROIC instead of ROE • First, assume invested capital is only plant and equipment • Second, assume that invested capital includes working capital changes • Key variable is deriving the net plant depreciation rate from the growth rate and formula: • Cap Exp/Depreciation = g/Net Plant Depreciation rate + 1 88
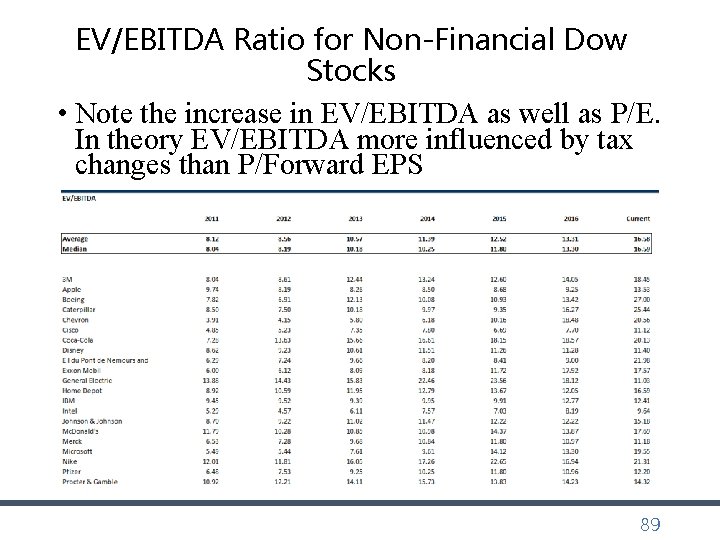
EV/EBITDA Ratio for Non-Financial Dow Stocks • Note the increase in EV/EBITDA as well as P/E. In theory EV/EBITDA more influenced by tax changes than P/Forward EPS 89
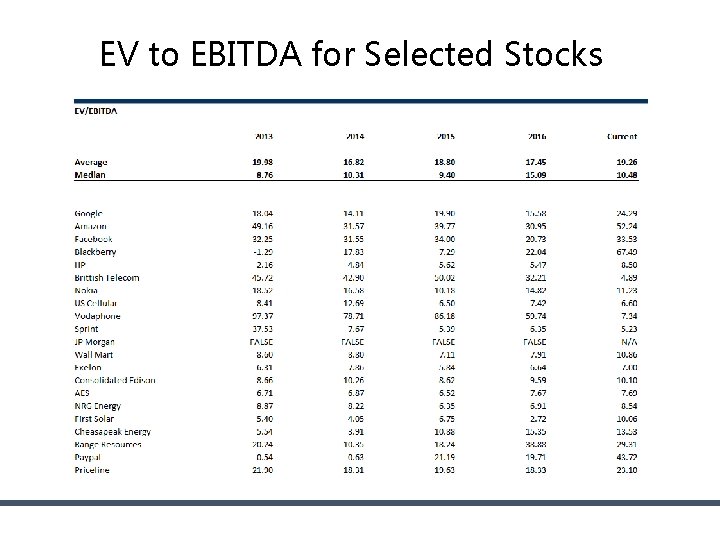
EV to EBITDA for Selected Stocks
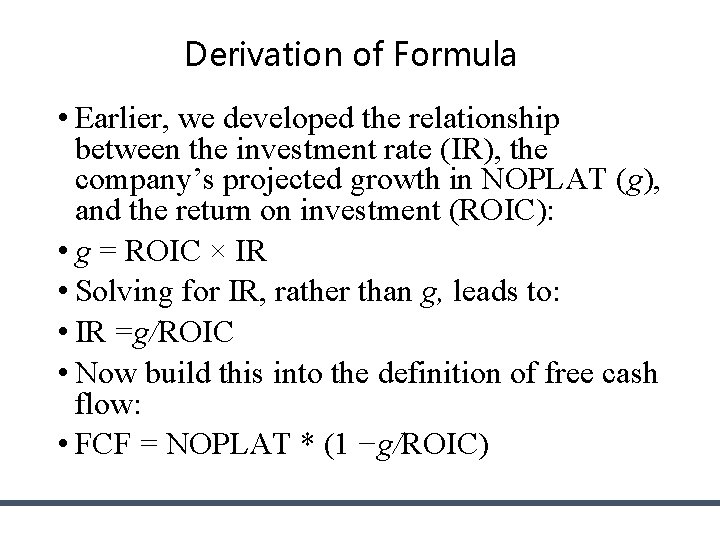
Derivation of Formula • Earlier, we developed the relationship between the investment rate (IR), the company’s projected growth in NOPLAT (g), and the return on investment (ROIC): • g = ROIC × IR • Solving for IR, rather than g, leads to: • IR =g/ROIC • Now build this into the definition of free cash flow: • FCF = NOPLAT * (1 −g/ROIC)
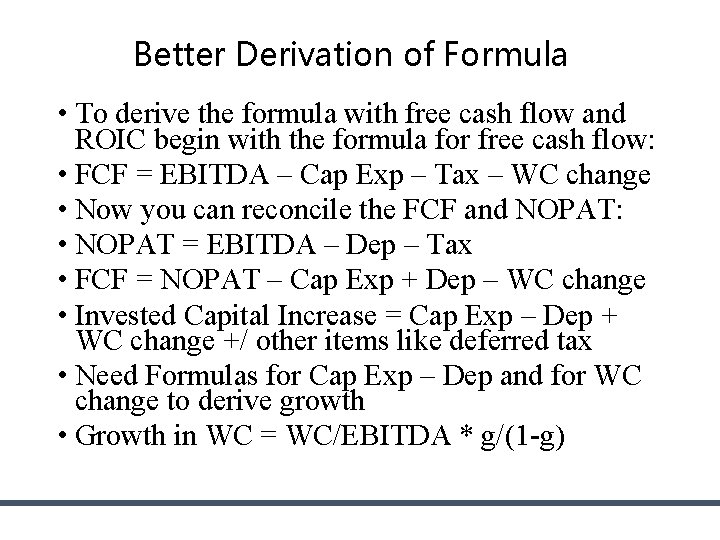
Better Derivation of Formula • To derive the formula with free cash flow and ROIC begin with the formula for free cash flow: • FCF = EBITDA – Cap Exp – Tax – WC change • Now you can reconcile the FCF and NOPAT: • NOPAT = EBITDA – Dep – Tax • FCF = NOPAT – Cap Exp + Dep – WC change • Invested Capital Increase = Cap Exp – Dep + WC change +/ other items like deferred tax • Need Formulas for Cap Exp – Dep and for WC change to derive growth • Growth in WC = WC/EBITDA * g/(1 -g)
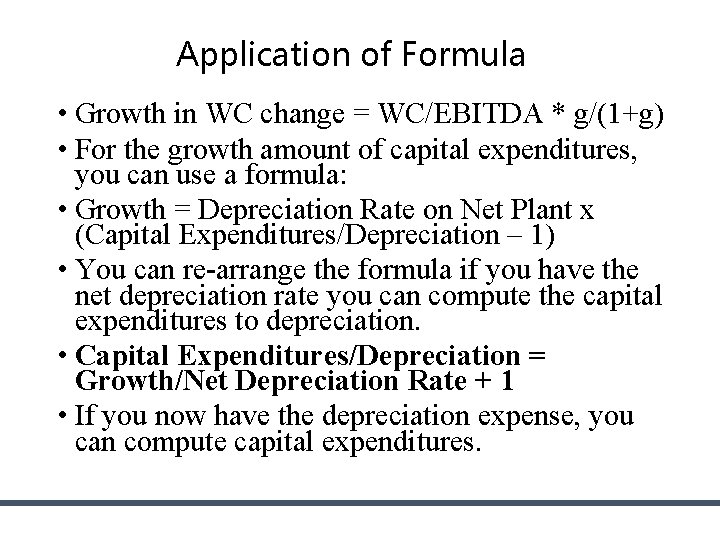
Application of Formula • Growth in WC change = WC/EBITDA * g/(1+g) • For the growth amount of capital expenditures, you can use a formula: • Growth = Depreciation Rate on Net Plant x (Capital Expenditures/Depreciation – 1) • You can re-arrange the formula if you have the net depreciation rate you can compute the capital expenditures to depreciation. • Capital Expenditures/Depreciation = Growth/Net Depreciation Rate + 1 • If you now have the depreciation expense, you can compute capital expenditures.
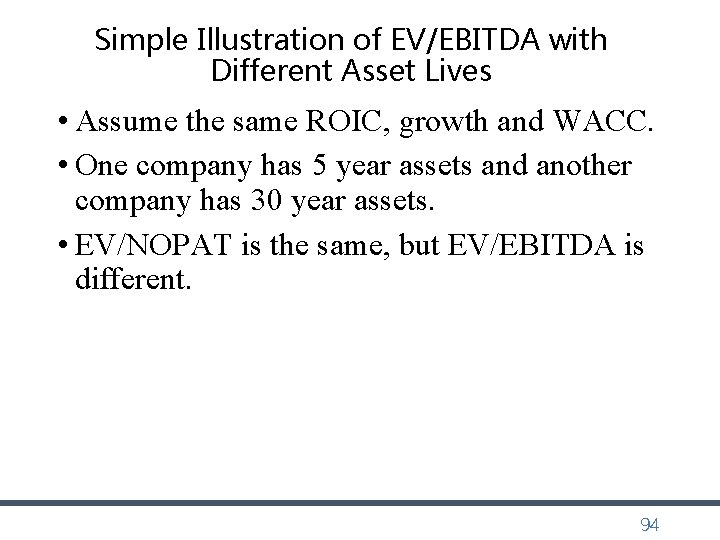
Simple Illustration of EV/EBITDA with Different Asset Lives • Assume the same ROIC, growth and WACC. • One company has 5 year assets and another company has 30 year assets. • EV/NOPAT is the same, but EV/EBITDA is different. 94
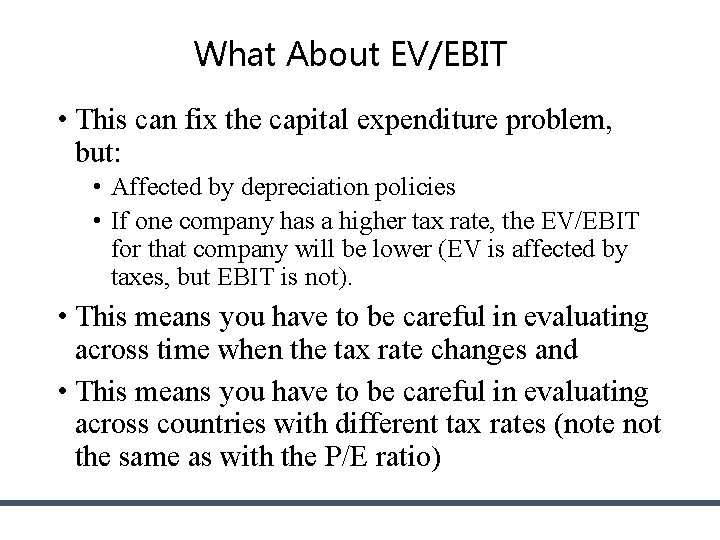
What About EV/EBIT • This can fix the capital expenditure problem, but: • Affected by depreciation policies • If one company has a higher tax rate, the EV/EBIT for that company will be lower (EV is affected by taxes, but EBIT is not). • This means you have to be careful in evaluating across time when the tax rate changes and • This means you have to be careful in evaluating across countries with different tax rates (note not the same as with the P/E ratio)
Are Multiples the Same Across Over Time • Depends on whether the following changed: • ROE prospects • Growth prospects • Cost of Capital – Should be real cost of capital and not a function of nominal interest rates that are related to inflation
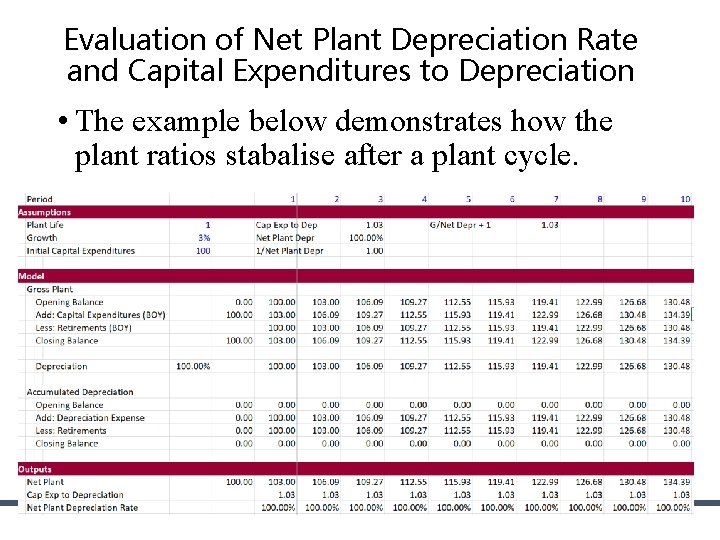
Evaluation of Net Plant Depreciation Rate and Capital Expenditures to Depreciation • The example below demonstrates how the plant ratios stabalise after a plant cycle.
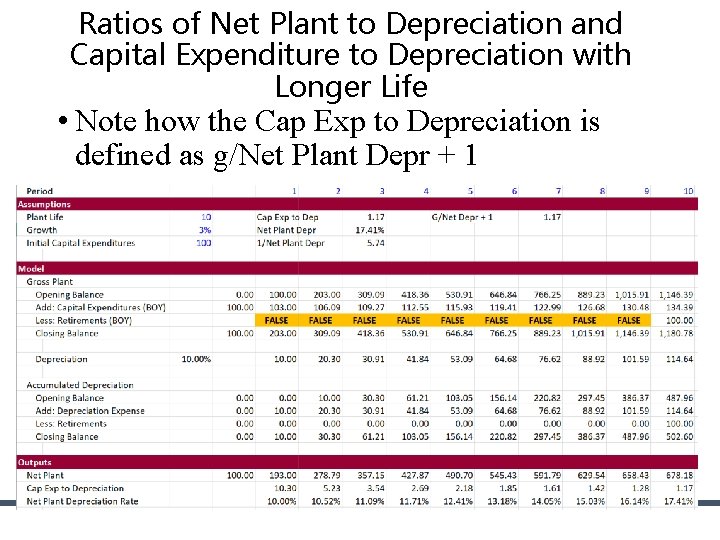
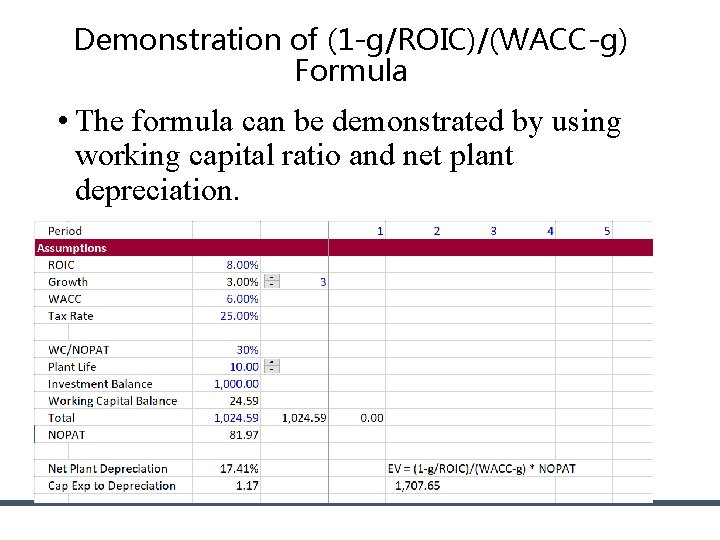
Ratios of Net Plant to Depreciation and Capital Expenditure to Depreciation with Longer Life • Note how the Cap Exp to Depreciation is defined as g/Net Plant Depr + 1 •
Demonstration of (1 -g/ROIC)/(WACC-g) Formula • The formula can be demonstrated by using working capital ratio and net plant depreciation.
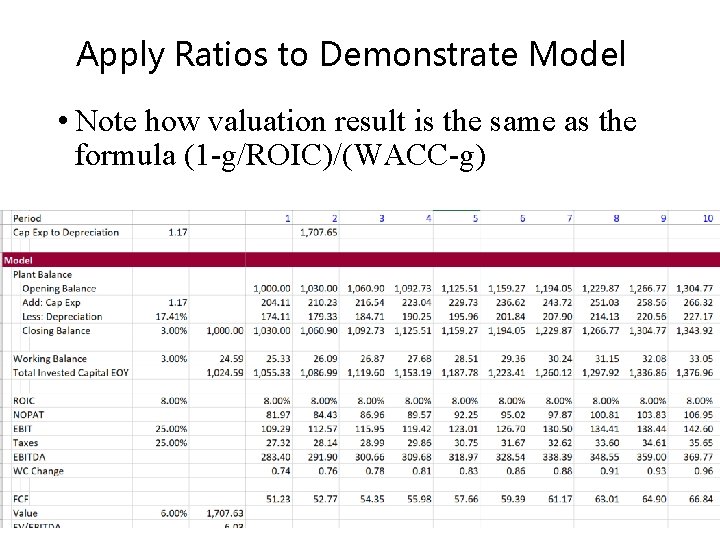
Apply Ratios to Demonstrate Model • Note how valuation result is the same as the formula (1 -g/ROIC)/(WACC-g)
Reasons for More Complex Formulas with Cap Exp to Depreciation, Working Capital etc. • Demonstration of EV/EBITDA ratio with different asset lives, tax rates and working capital ratios • Demonstration of how the value changes when growth and ROIC changes. When ROIC changes, the net cash flow changes and different amounts of money must be plowed back into the company.
Return on New Capital and Return on Existing Capital • Technically, we should use the return on new, or incremental, capital, but for simplicity here, we assume that the ROIC and incremental ROIC are equal. • Technically, this formula should use the return on new invested capital (RONIC), not the company’s return on all invested capital (ROIC). • What crap: when oil prices go down, you cannot say that existing projects still maintain their existing ROIC. When Uber destroys the taxi industry, you cannot say that only new taxies earn a lower return. When the internet kills advertising for newspaper companies, one cannot say that it is only new investments that suffer.
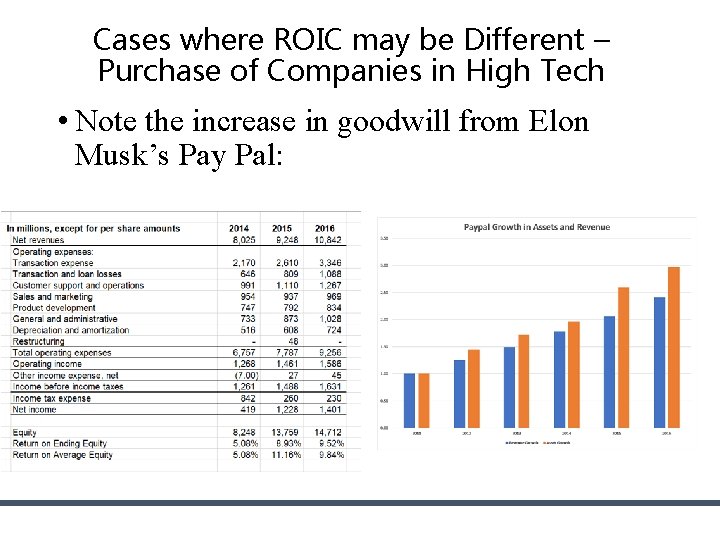
Cases where ROIC may be Different – Purchase of Companies in High Tech • Note the increase in goodwill from Elon Musk’s Pay Pal:
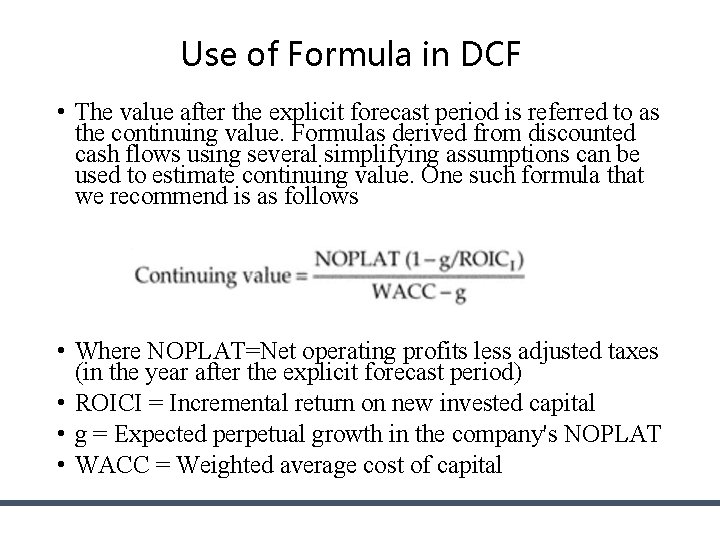
Use of Formula in DCF • The value after the explicit forecast period is referred to as the continuing value. Formulas derived from discounted cash flows using several simplifying assumptions can be used to estimate continuing value. One such formula that we recommend is as follows • Where NOPLAT=Net operating profits less adjusted taxes (in the year after the explicit forecast period) • ROICI = Incremental return on new invested capital • g = Expected perpetual growth in the company's NOPLAT • WACC = Weighted average cost of capital
Another Silly Mc. Kinsey Comment • We will show that high-ROIC companies typically create more value by focusing on growth, while lower-ROIC companies create more value by increasing ROIC. • Comment: Everybody of course wants high ROIC, which is just another word for monopoly profit and which is the driver of capitalist economies. If you are valuing a company you must assess the ability of a company to maintain or grow its monopoly position. That is the hard part. 105
Consultant Slide on Value Creation
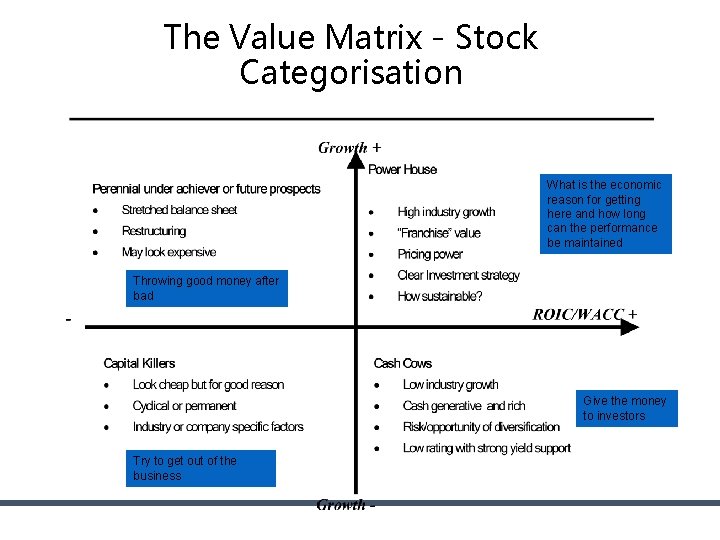
The Value Matrix - Stock Categorisation What is the economic reason for getting here and how long can the performance be maintained Throwing good money after bad Give the money to investors Try to get out of the business
Crazy Idea that ROIC = WACC in Long Run • According the Mc. Kinsey: Many forecasters assume that the rate of return on new invested capital equals the cost of capital in the continuing value period, but that the company will earn returns exceeding the cost of capital during the explicit forecast period.
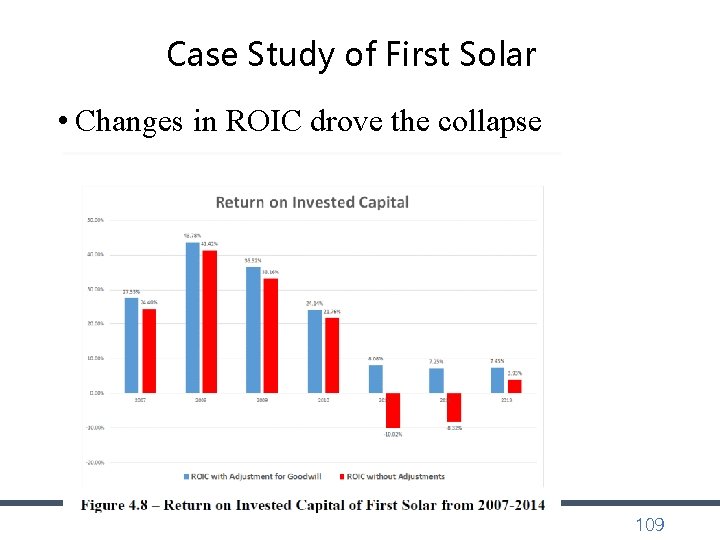
Case Study of First Solar • Changes in ROIC drove the collapse 109
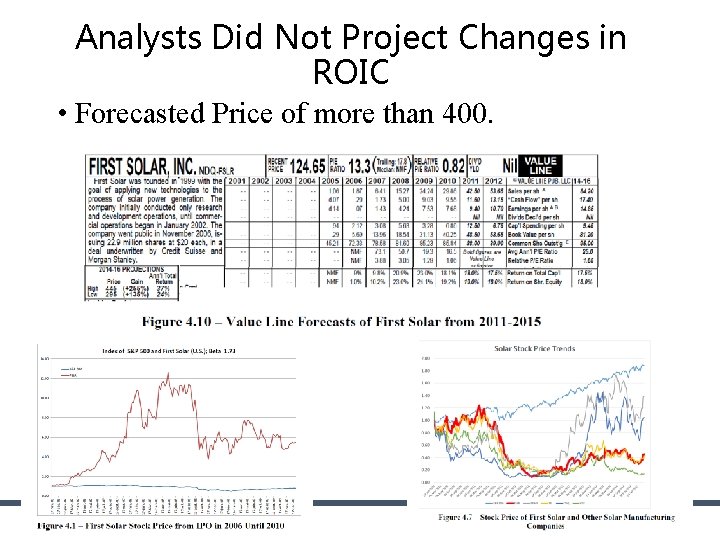
Analysts Did Not Project Changes in ROIC • Forecasted Price of more than 400.
Measuring the Return on Invested Capital is not Easy
What is the Cost of Capital • Formal Definition: The MINIMUM required return (i. e. the IRR) for an investment with the same risk. • If a Treasury Bond is assumed to have no risk, then the cost of capital for a risk free investment is the required IRR or the yield on a bond. • You can also call the cost of capital the target IRR on an investment (that should be affected by the risk of the investment).
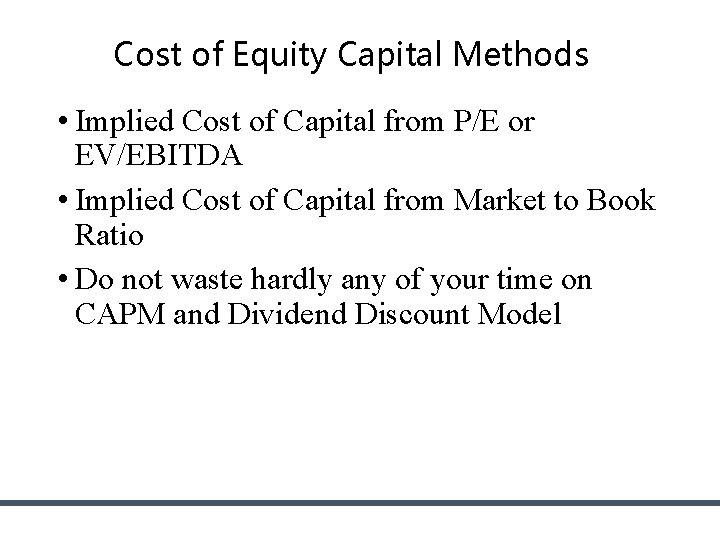
Cost of Equity Capital Methods • Implied Cost of Capital from P/E or EV/EBITDA • Implied Cost of Capital from Market to Book Ratio • Do not waste hardly any of your time on CAPM and Dividend Discount Model
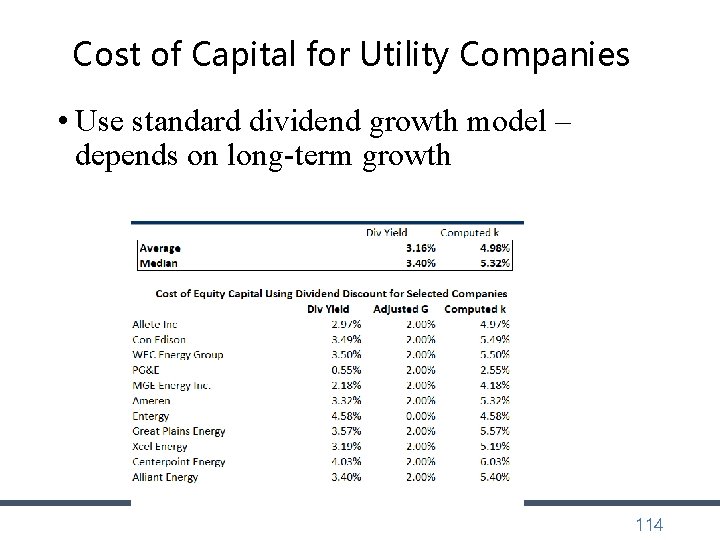
Cost of Capital for Utility Companies • Use standard dividend growth model – depends on long-term growth 114
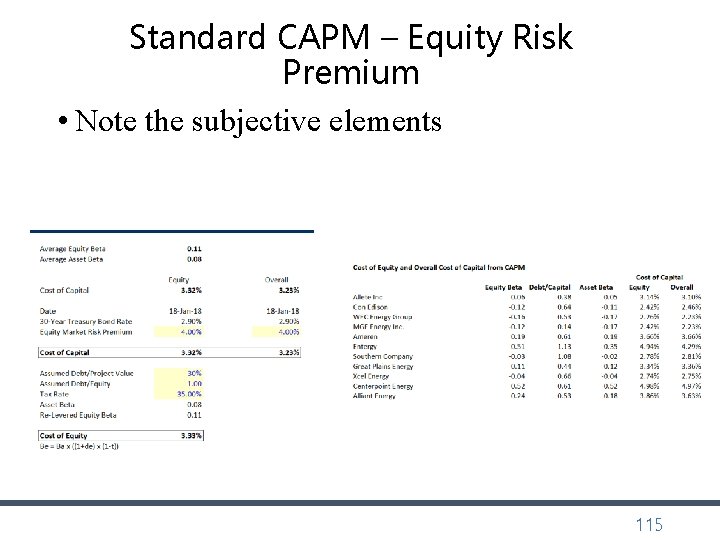
Standard CAPM – Equity Risk Premium • Note the subjective elements 115
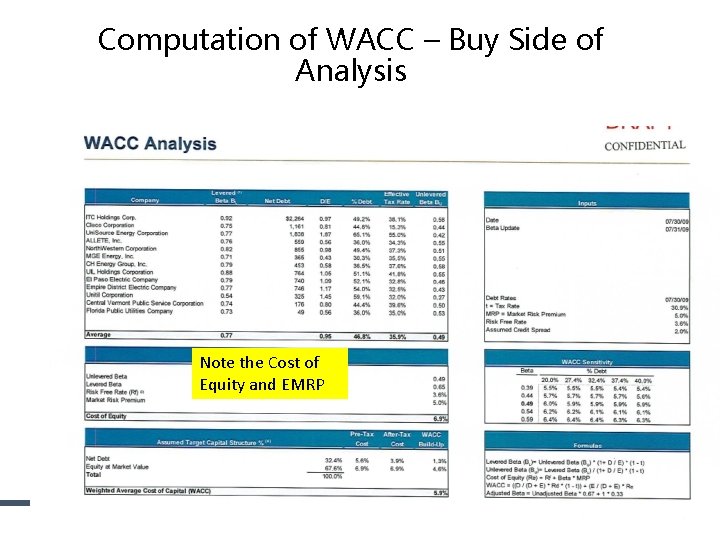
Computation of WACC – Buy Side of Analysis Note the Cost of Equity and EMRP
Using the Value Driver Formula to Compute the Cost of Capital • If ROE, k and g are constant, then: • P/E = (1 -g/ROE)/(k-g) • or • P/E x (k-g) = (1 -g/ROE) • k-g = (1 -g/ROE) / P/E • k = (1 -g/ROE) / P/E • But this has the inflation bias
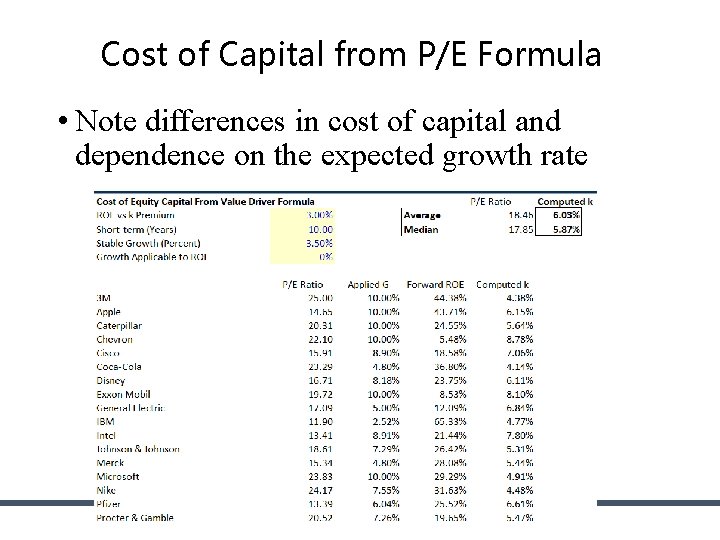
Cost of Capital from P/E Formula • Note differences in cost of capital and dependence on the expected growth rate
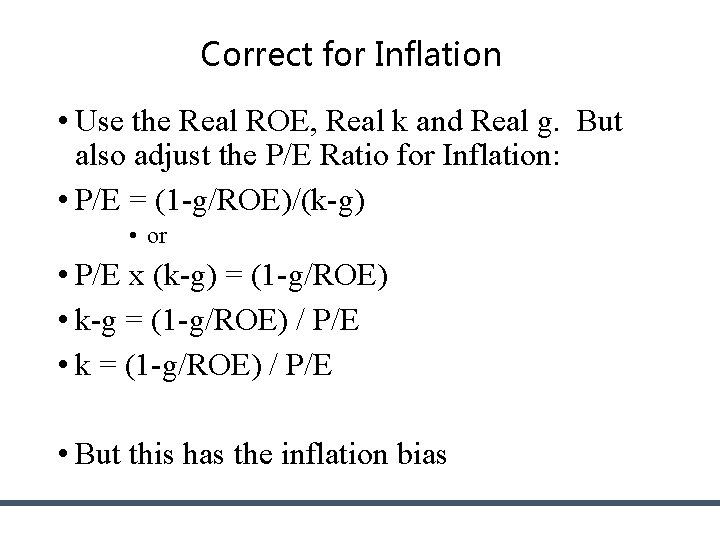
Correct for Inflation • Use the Real ROE, Real k and Real g. But also adjust the P/E Ratio for Inflation: • P/E = (1 -g/ROE)/(k-g) • or • P/E x (k-g) = (1 -g/ROE) • k-g = (1 -g/ROE) / P/E • k = (1 -g/ROE) / P/E • But this has the inflation bias
Sensitivity Analysis with Given Cost of Capital • Valuation can be measured with P/E. Growth and return in combination have combined effects on the P/E ratio. Need both variables and cannot use data table when making graphs.
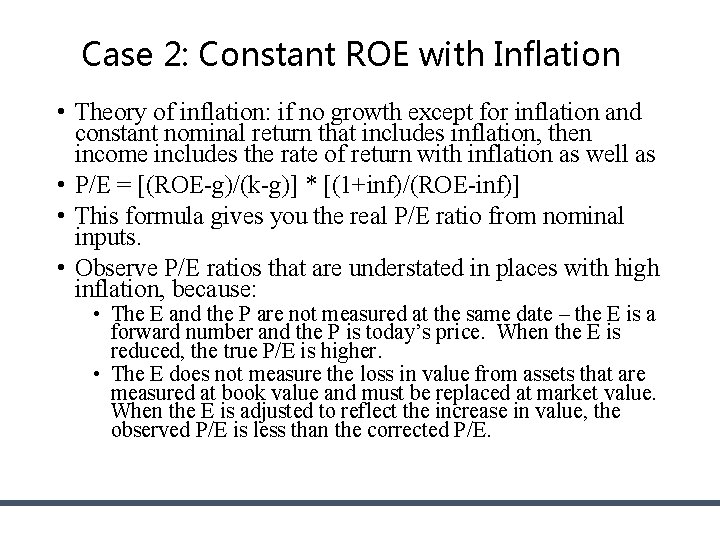
Case 2: Constant ROE with Inflation • Theory of inflation: if no growth except for inflation and constant nominal return that includes inflation, then income includes the rate of return with inflation as well as • P/E = [(ROE-g)/(k-g)] * [(1+inf)/(ROE-inf)] • This formula gives you the real P/E ratio from nominal inputs. • Observe P/E ratios that are understated in places with high inflation, because: • The E and the P are not measured at the same date – the E is a forward number and the P is today’s price. When the E is reduced, the true P/E is higher. • The E does not measure the loss in value from assets that are measured at book value and must be replaced at market value. When the E is adjusted to reflect the increase in value, the observed P/E is less than the corrected P/E.
Simple Proof that P/E should Reflect Values Adjusted for Inflation – Real Values • Say you have a company operating in a high inflation country and you measure returns, dividends and value. • Then, you simply re-state the earnings, cash flow and dividends into a hypothetical country where there is no inflation. • The re-stated dividends and the cost of capital for the no-inflation country provide the true P/E ratio. • You can compute all of your returns, dividends and book value for the inflated currency, but after you translate back with a Purchasing Power Parity exchange rate, the value of the dividends should be the same.
Inflation Can Be Tricky • The value driver does not work if there is inflation – even a little inflation. • Steps • Adjust the earnings for loss in investment value • Adjust the earnings for inflation • Use nominal ROE and Cost of Capital • Example: • • • P/E for S&P 500 is 25 Inflation is 2% Book Value per Share is 12. 5 EPS is 2 ROE is 16% Then the adjusted P/E for the analysis is: • First, adjust for loss in investment value 12. 5 *. 02 • Second, adjust for earnings in real terms • When you are finished, the corrected P/E
Observed and Computed P/E • Let’s say you observe a P/E ratio for a particular company or for the entire market or for a particular industry. This P/E ratio will be distorted by inflation. • When you put in your ROE, growth and cost of capital, you will come up with this distorted P/E ratio. • You could adjust the ROE, the growth rate and the cost of capital to real values and then you would come up with a higher P/E ratio that is correct. • Or, you could adjust the P/E ratio for inflation and re-derive the cost of capital.
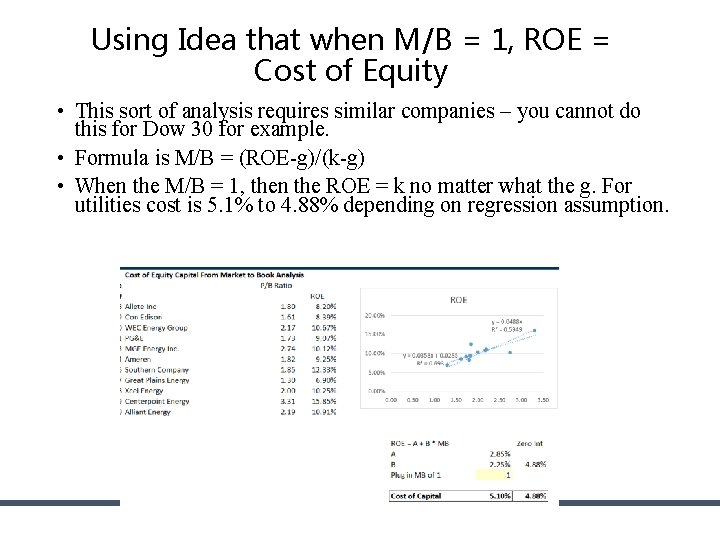
Using Idea that when M/B = 1, ROE = Cost of Equity • This sort of analysis requires similar companies – you cannot do this for Dow 30 for example. • Formula is M/B = (ROE-g)/(k-g) • When the M/B = 1, then the ROE = k no matter what the g. For utilities cost is 5. 1% to 4. 88% depending on regression assumption.
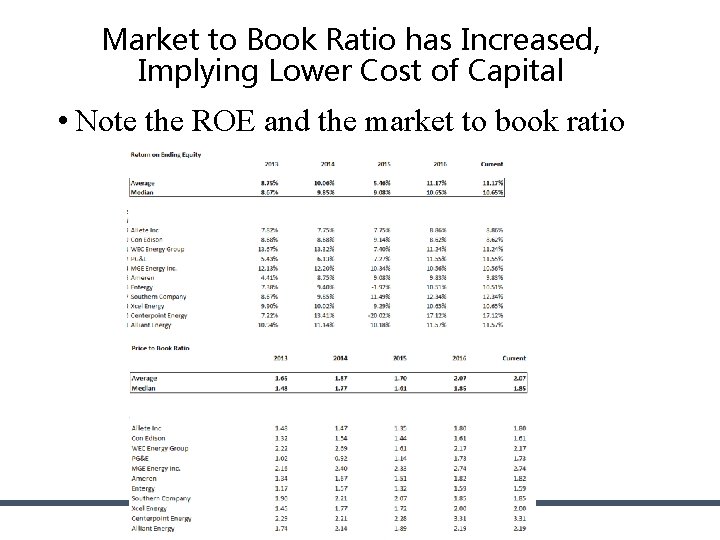
Market to Book Ratio has Increased, Implying Lower Cost of Capital • Note the ROE and the market to book ratio
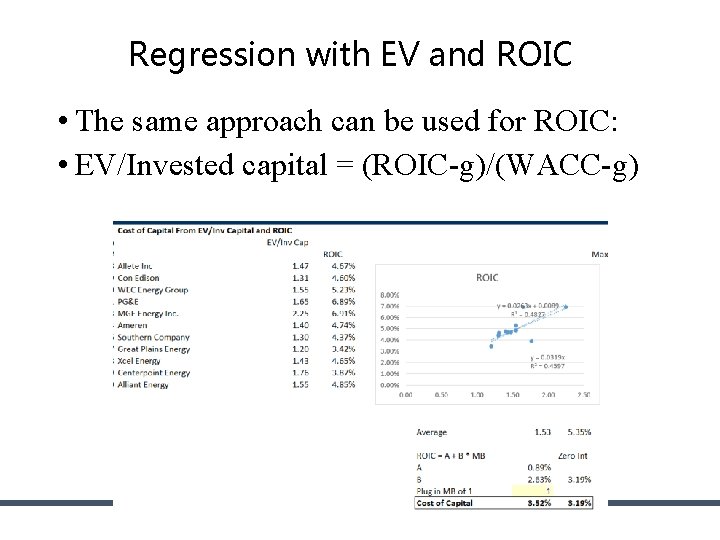
Regression with EV and ROIC • The same approach can be used for ROIC: • EV/Invested capital = (ROIC-g)/(WACC-g)
Historic Analysis and Measuring the Return on Invested Capital
Statement about U. S. and Asian Companies by Mc. Kinsey • The median large U. S. company earned a 19 percent ROIC in 2013, while the median large Asian company earned 8 percent. • But for the most part, Asian companies historically have focused more on growth than profitability or ROIC, which explains the large difference between their average valuation and that of U. S. companies. • Comment: Everybody of course wants a high monopoly profit. Very smart people are hired to create monopoly profits through marketing strategies (or making children and adults addicted to a product).
Use of Return on Invested Capital to Assess Model • The big question is what really goes into calculation of the invested capital. • The most obvious point is that surplus cash should not be in invested capital because the income associated with surplus cash is not in NOPAT.
You Need to Understand Not Bias Historical Analysis as the First Step in a Forecast • Forecasts from History • The most effective way to destroy people is to deny and obliterate their own understanding of their history. ” • Forecasts from History and Manipulating History in Financial Models • “Day by day and almost minute by minute the past was brought up to date. In this way every prediction made by the Party could be shown by documentary evidence to have been correct; nor was any item of news, or any expression of opinion, which conflicted with the needs of the moment, ever allowed to remain on record. All history was a palimpsest, scraped clean and reinscribed exactly as often as was necessary. ”
Illustration of History and Forecast – Old Fashion Value Line • Note all of the history and financial ratios in the reports – can assess forecasts with ROE and value from P/E Ratios. Note all of the history and that the target price is the forecast P/E x EPS
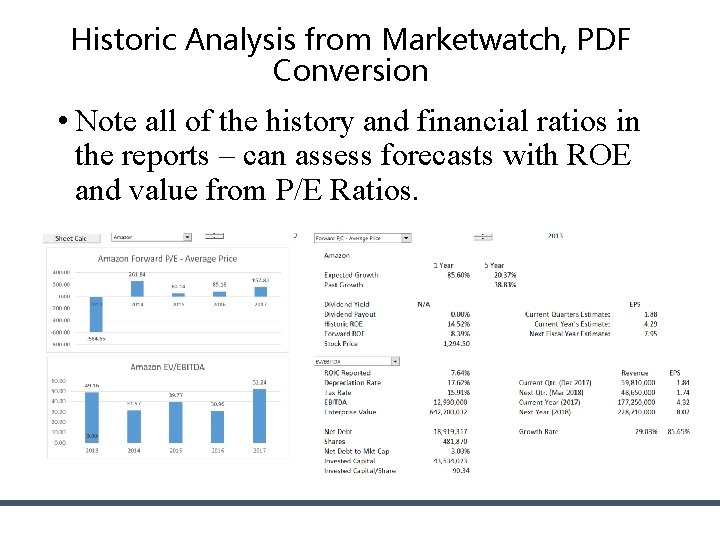
Historic Analysis from Marketwatch, PDF Conversion • Note all of the history and financial ratios in the reports – can assess forecasts with ROE and value from P/E Ratios.
Quarterly Historic Data 134
Using Historic Data to Develop Assumptions • Work through the income statement and balance sheet to develop ratios used for assumptions. 135
Forecasting Cash Flow and Fundamental Analysis of Risks and Value in Corporate Finance
Need to Answer Fundamental Questions about Demand Growth, Prices and Cost Structure • Demand Growth • Volatility of demand growth • Implications of demand volatility and capital intensity • Implications of demand volatility and fixed operating cost • Example: Airlines versus Retail • Price Levels and Return • How can sustain prices that lead to high return • Types of products (solar panels and cell phones) • First mover and scale (Disney and merchant electric plants) • Creating Loyalty (Coke and Fiber Optic Cable)
Need to Answer Fundamental Questions about Demand Growth, Prices and Cost Structure • • Fixed and Variable Costs Comparison of Costs with Competitors Sustainability of Cost Advantage Example: Shale Gas and High Cost of Replacement • Problems with Analysis • Very difficult to measure – some companies have sustained high ROIC • Product life cycle shortening – how long can maintain returns from innovation • Problems of obsolescence, changes in taste, fashion etc.
Still Volume and Price, But … • Have volume history from financial data, but need long-term data that covers business cycles. • Surplus capacity analysis may require knowledge of competitor capacity additions – there is no historic financial data that can be used for this. • Demand volatility is aggravated by operating leverage. It is difficult from financial statements to separate fixed and variable cost. Example of airlines and auto companies after 2000 and 2008.
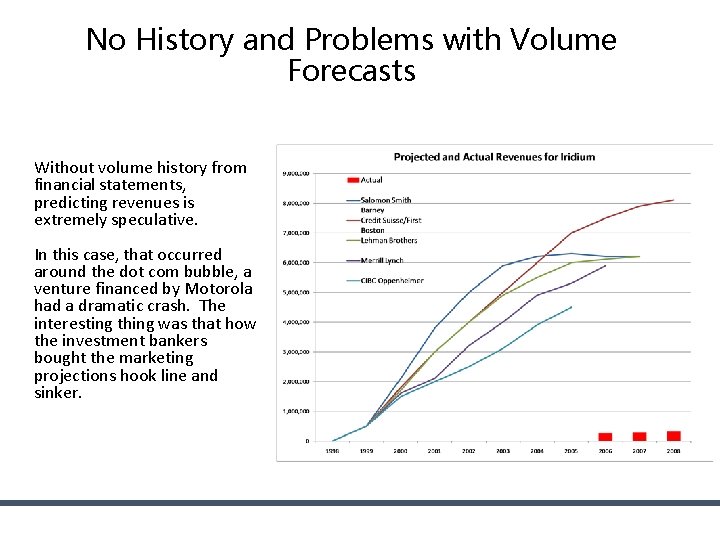
No History and Problems with Volume Forecasts Without volume history from financial statements, predicting revenues is extremely speculative. In this case, that occurred around the dot com bubble, a venture financed by Motorola had a dramatic crash. The interesting thing was that how the investment bankers bought the marketing projections hook line and sinker.
Understand Marginal Cost and Surplus Capacity Risk • High marginal cost shale gas and shale oil producers and bankruptcy because of breakeven oil price. 141
Obsolesce, Fashion, Uber • Very difficult to predict sudden changes in cost structure and/or price in an industry driven by new technology. Stock price of company that finances medallions in New York.
Cost of Capital
Free Cash Flow • Free cash flow or unleveraged cash flow: • Do not include any effects of interest expense in cash flow • Free Cash Flow • EBITDA • Less: Capital Expenditures • Less: Adjustment to EBITDA for changes in working capital • Less: Operating Taxes without interest – EBIT x Tax • FREE CASH FLOW
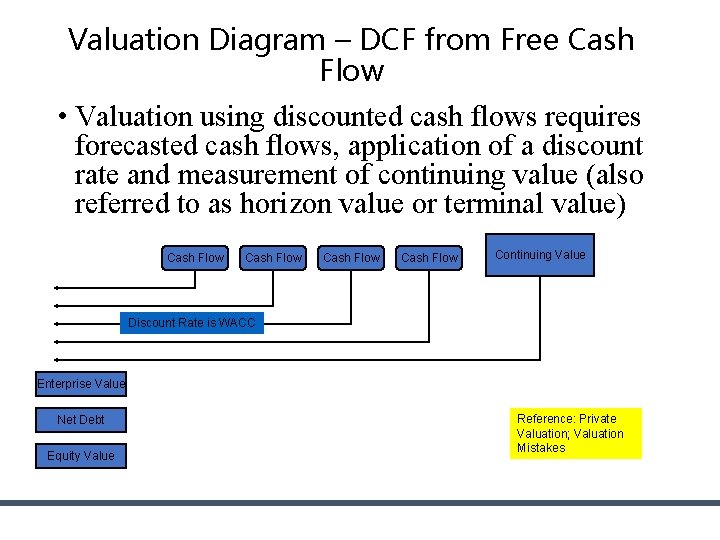
Valuation Diagram – DCF from Free Cash Flow • Valuation using discounted cash flows requires forecasted cash flows, application of a discount rate and measurement of continuing value (also referred to as horizon value or terminal value) Cash Flow Continuing Value Discount Rate is WACC Enterprise Value Net Debt Equity Value Reference: Private Valuation; Valuation Mistakes
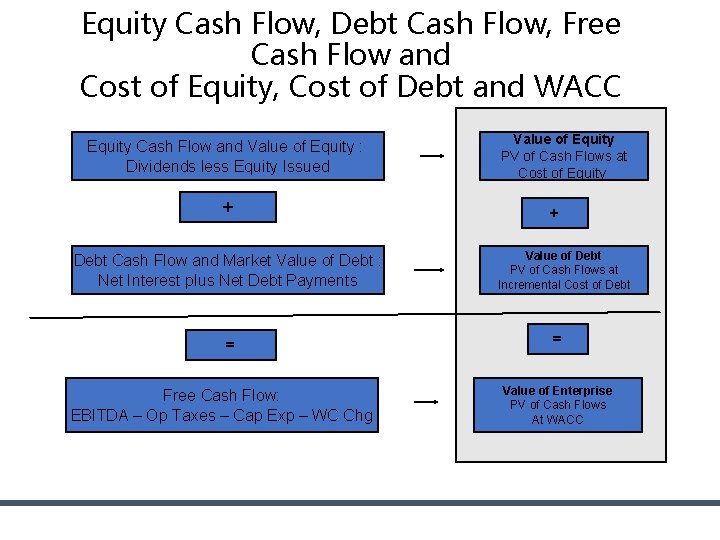
Equity Cash Flow, Debt Cash Flow, Free Cash Flow and Cost of Equity, Cost of Debt and WACC Equity Cash Flow and Value of Equity : Dividends less Equity Issued + Debt Cash Flow and Market Value of Debt : Net Interest plus Net Debt Payments = Free Cash Flow: EBITDA – Op Taxes – Cap Exp – WC Chg Value of Equity PV of Cash Flows at Cost of Equity + Value of Debt PV of Cash Flows at Incremental Cost of Debt = Value of Enterprise PV of Cash Flows At WACC
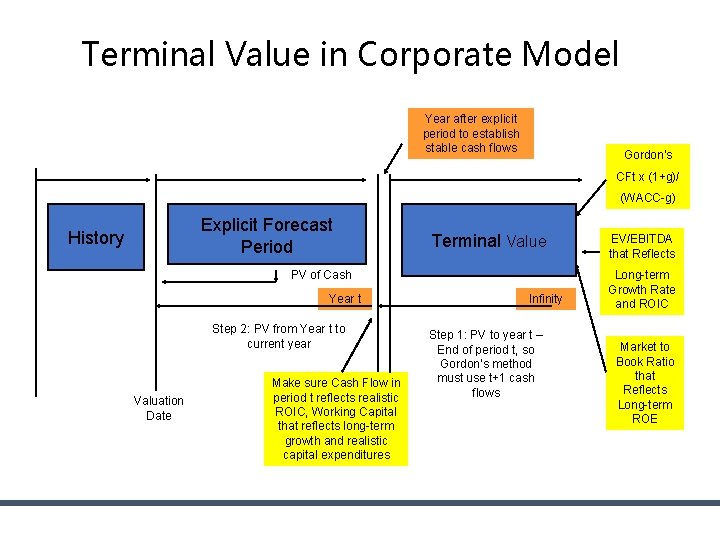
Terminal Value in Corporate Model Year after explicit period to establish stable cash flows Gordon’s CFt x (1+g)/ (WACC-g) Explicit Forecast Period History Terminal Value PV of Cash Year t Step 2: PV from Year t to current year Valuation Date Make sure Cash Flow in period t reflects realistic ROIC, Working Capital that reflects long-term growth and realistic capital expenditures Infinity Step 1: PV to year t – End of period t, so Gordon’s method must use t+1 cash flows EV/EBITDA that Reflects Long-term Growth Rate and ROIC Market to Book Ratio that Reflects Long-term ROE
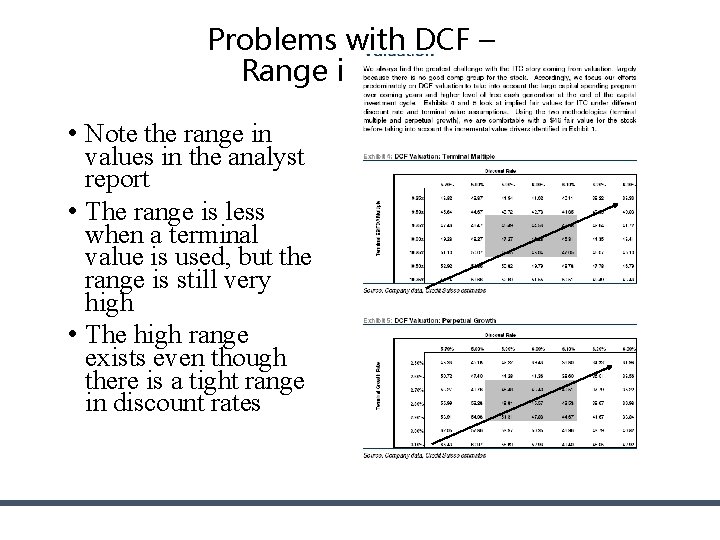
Problems with DCF – Range in Values • Note the range in values in the analyst report • The range is less when a terminal value is used, but the range is still very high • The high range exists even though there is a tight range in discount rates
Reconciliation of IRR and Return on Investment (Project IRR versus ROIC or Equity IRR versus ROE)
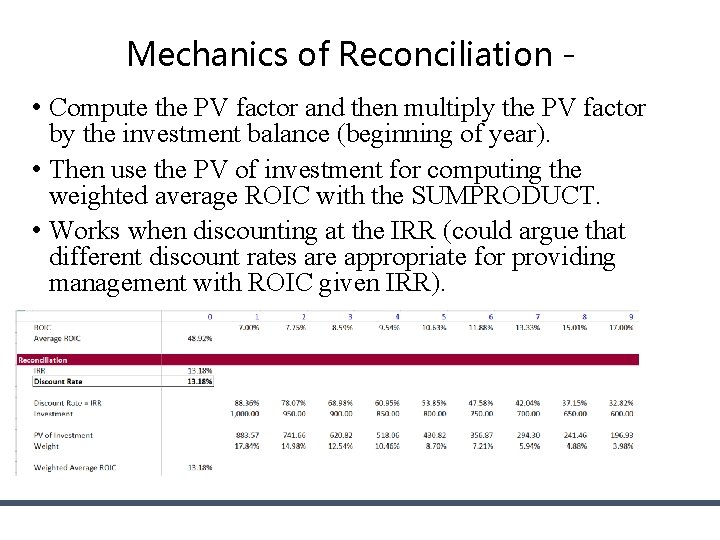
Basic Idea of Reconciliation • Weighted average rate of return is the same as the IRR, if: • The rate of return is weighted by the PV of the investment balance, and; • The discount rate applied to the year by year investment balance is the IRR itself. • This is analogous to the fundamental IRR problem where intermediate cash flows are assumed to be re-invested at the IRR itself.
Weighted ROIC versus MIRR • If the cost of capital is measured by something different from the IRR, the weighted average return will be different. • If the return is higher than the cost of capital, the weighted average return is higher than the IRR • If the return is lower than the cost of capital, the weighted average return is lower than the IRR • Use of MIRR does not solve the problem
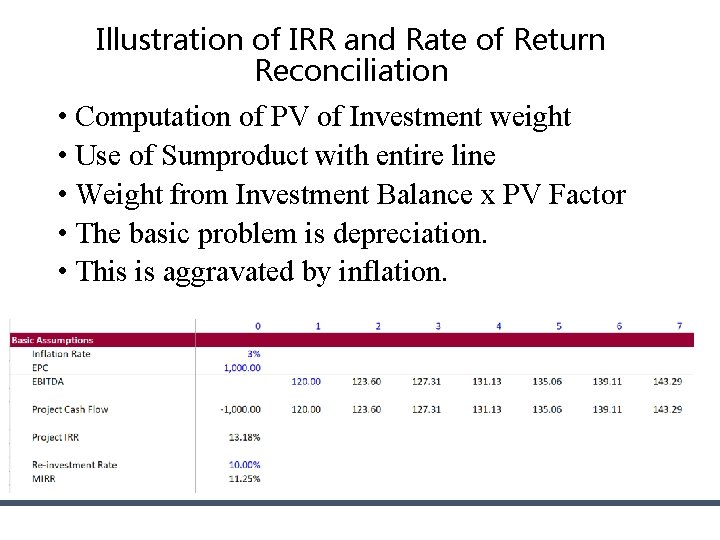
Illustration of IRR and Rate of Return Reconciliation • Computation of PV of Investment weight • Use of Sumproduct with entire line • Weight from Investment Balance x PV Factor • The basic problem is depreciation. • This is aggravated by inflation.
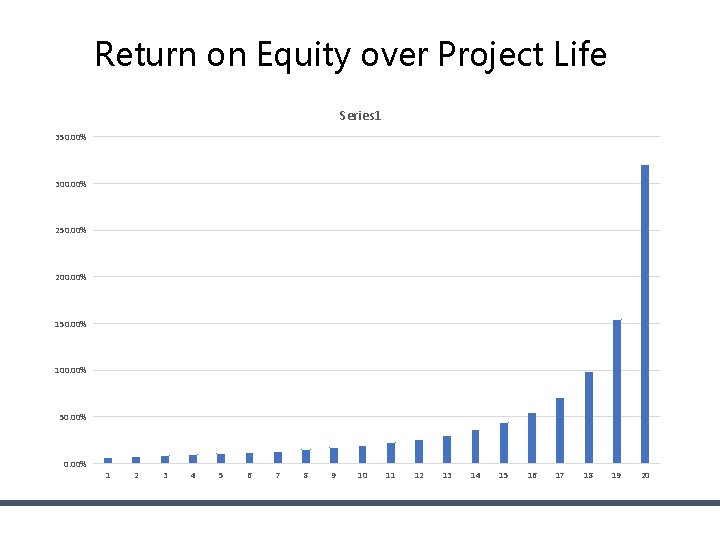
Return on Equity over Project Life Series 1 350. 00% 300. 00% 250. 00% 200. 00% 150. 00% 100. 00% 50. 00% 1 2 3 4 5 6 7 8 9 10 11 12 13 14 15 16 17 18 19 20
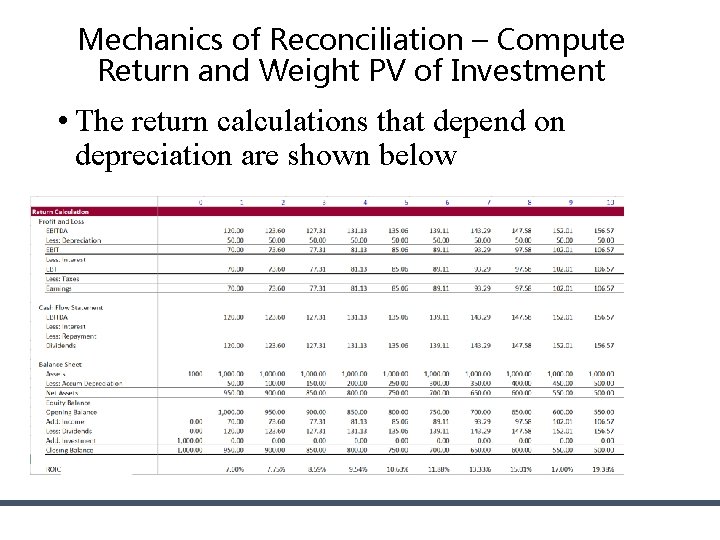
Mechanics of Reconciliation – Compute Return and Weight PV of Investment • The return calculations that depend on depreciation are shown below
Mechanics of Reconciliation • Compute the PV factor and then multiply the PV factor by the investment balance (beginning of year). • Then use the PV of investment for computing the weighted average ROIC with the SUMPRODUCT. • Works when discounting at the IRR (could argue that different discount rates are appropriate for providing management with ROIC given IRR).
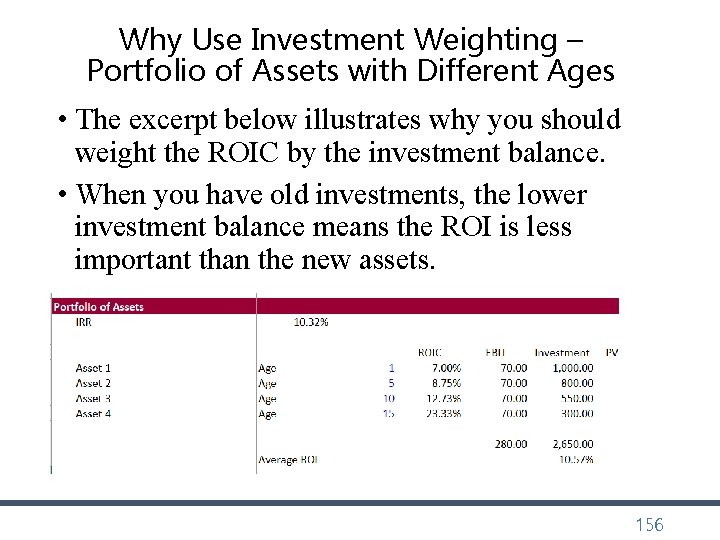
Why Use Investment Weighting – Portfolio of Assets with Different Ages • The excerpt below illustrates why you should weight the ROIC by the investment balance. • When you have old investments, the lower investment balance means the ROI is less important than the new assets. 156
Use of Economic Depreciation • You can compute an alternative depreciation rate and then the ROIC will equal the IRR • If you use the economic depreciation, you can use a discount rate that equals the IRR. • You could theoretically use the economic depreciation rate and then evaluate the performance of an project finance investment over time.
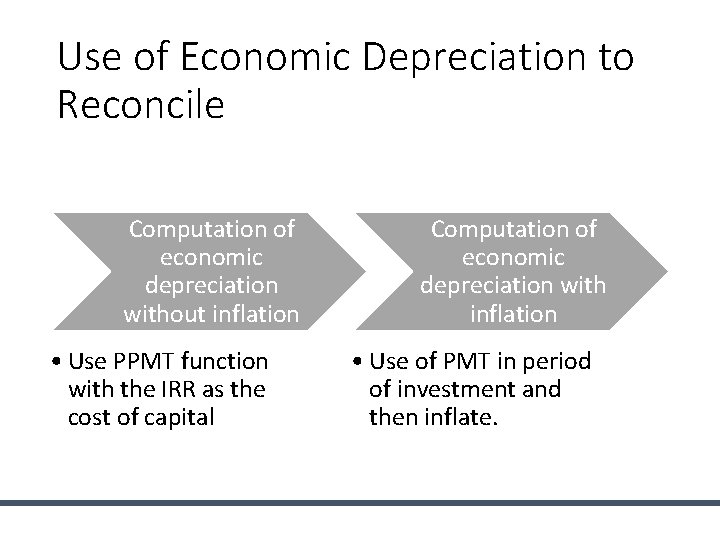
Use of Economic Depreciation to Reconcile Computation of economic depreciation without inflation • Use PPMT function with the IRR as the cost of capital Computation of economic depreciation with inflation • Use of PMT in period of investment and then inflate.
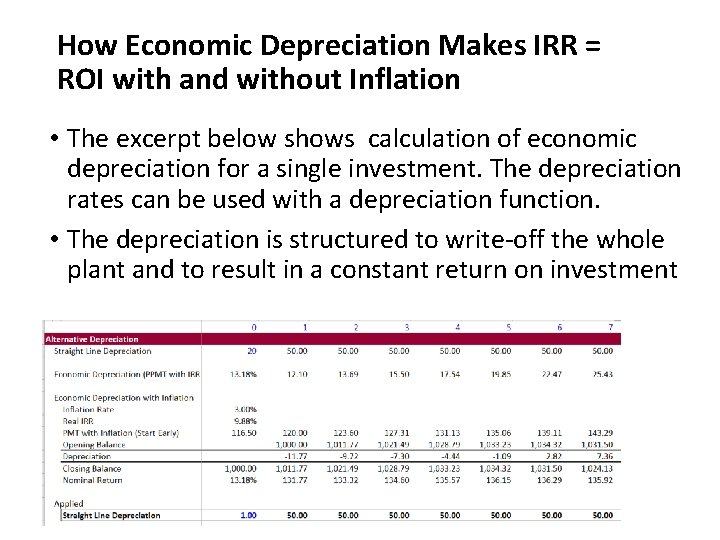
How Economic Depreciation Makes IRR = ROI with and without Inflation • The excerpt below shows calculation of economic depreciation for a single investment. The depreciation rates can be used with a depreciation function. • The depreciation is structured to write-off the whole plant and to result in a constant return on investment
Implications of Economic Depreciation • There is no way companies will implement economic depreciation and allow measurement of true returns • Without economic depreciation it is very difficult to measure the true economic return • The true return can be used to evaluate the value of a company. The PV of cash flows at the true IRR as the discount rate is zero. • The IRR for a corporation is like the yield to maturity on a bond. Valuation could be computed as the [Investment x Yield]/Disc Rate
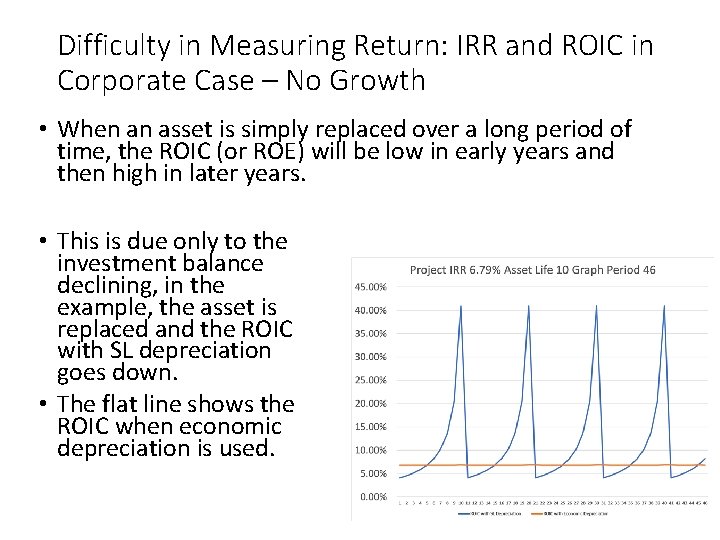
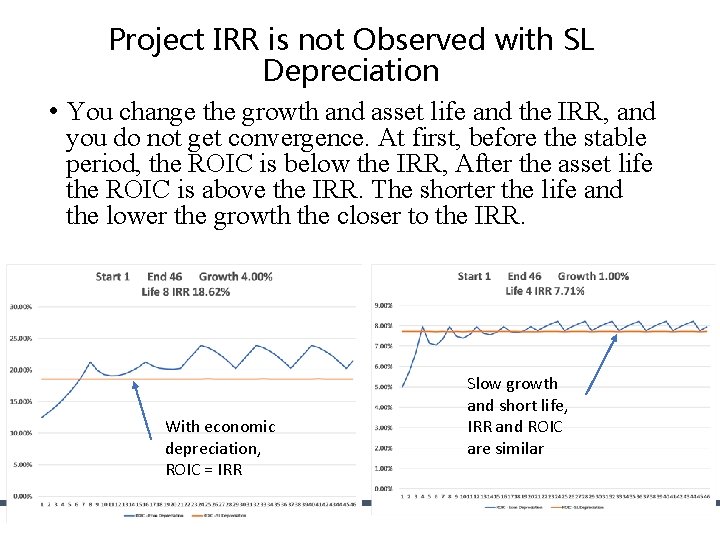
Difficulty in Measuring Return: IRR and ROIC in Corporate Case – No Growth • When an asset is simply replaced over a long period of time, the ROIC (or ROE) will be low in early years and then high in later years. • This is due only to the investment balance declining, in the example, the asset is replaced and the ROIC with SL depreciation goes down. • The flat line shows the ROIC when economic depreciation is used.
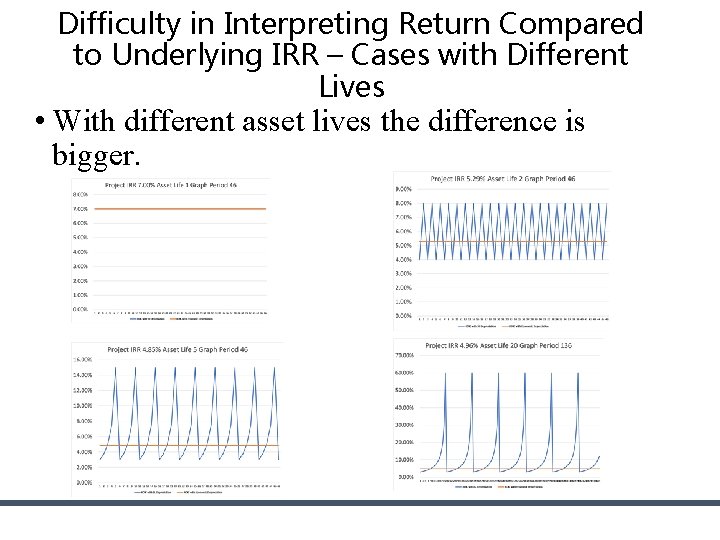
Difficulty in Interpreting Return Compared to Underlying IRR – Cases with Different Lives • With different asset lives the difference is bigger.
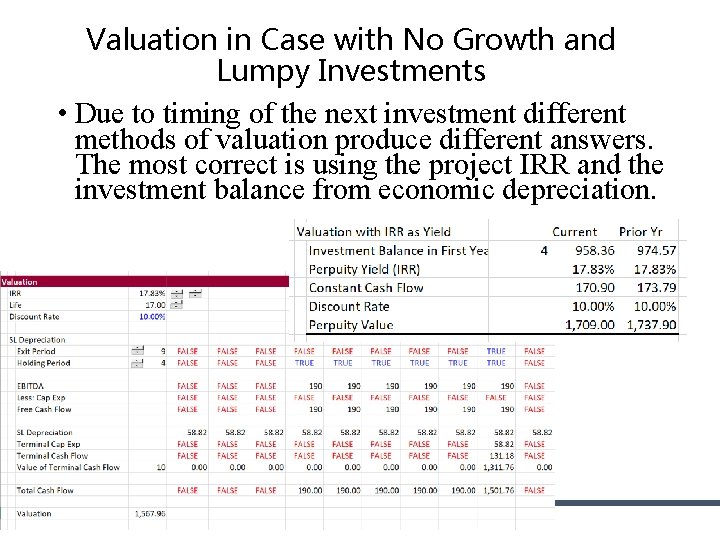
Valuation in Case with No Growth and Lumpy Investments • Due to timing of the next investment different methods of valuation produce different answers. The most correct is using the project IRR and the investment balance from economic depreciation.
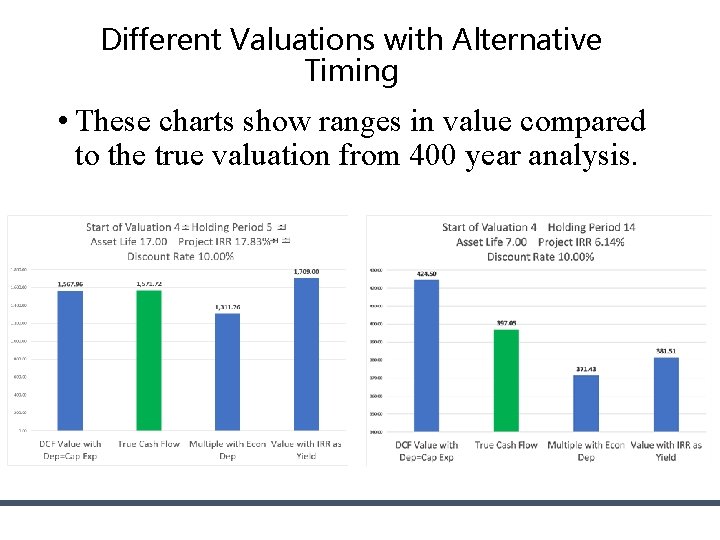
Different Valuations with Alternative Timing • These charts show ranges in value compared to the true valuation from 400 year analysis.
Case With Growth • In this case assume that you start with some capital expenditures, and the capital expenditures continue to increase each year. In the first case assume that the EBITDA generated by the investment does not increase. • Looking for ROIC = IRR after constant growth, but this does not happen • If apply Value = Income x (1 -G/ROIC)/(WACCg), what level of ROIC should you use – the ROIC or IRR. • If apply Value/Investment = (ROIC-g)/(WACCg) what level of investment and ROIC should you use.
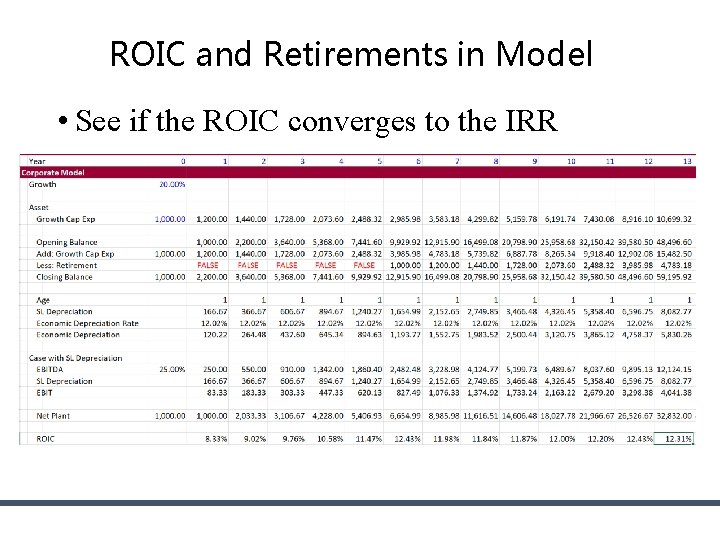
Mechanics of Model with Growth • Retirements are replaced with similar assets (no inflation). Begin with project IRR and economic depreciation on a single asset.
ROIC and Retirements in Model • See if the ROIC converges to the IRR •
Project IRR is not Observed with SL Depreciation • You change the growth and asset life and the IRR, and you do not get convergence. At first, before the stable period, the ROIC is below the IRR, After the asset life the ROIC is above the IRR. The shorter the life and the lower the growth the closer to the IRR. With economic depreciation, ROIC = IRR Slow growth and short life, IRR and ROIC are similar
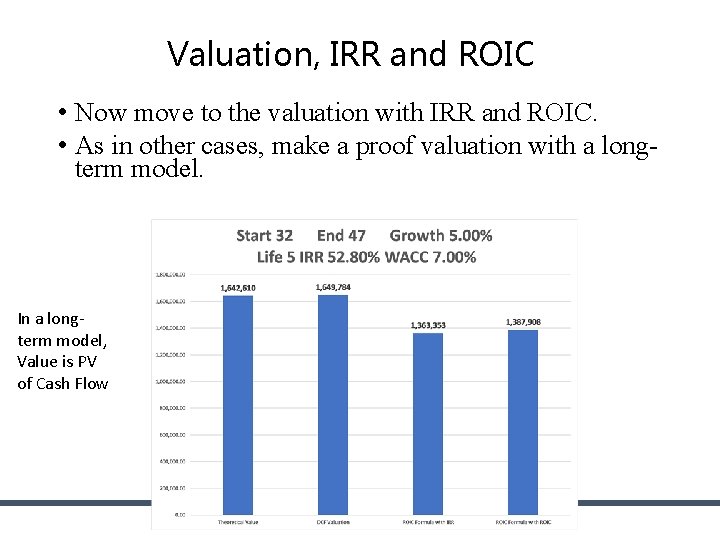
Valuation, IRR and ROIC • Now move to the valuation with IRR and ROIC. • As in other cases, make a proof valuation with a longterm model. In a longterm model, Value is PV of Cash Flow
Demonstration of Errors • Say a company just finished embarking on a large expansion. In this case, the return will be low and it will look like the company is earning less than its cost of capital.
Case Study – Kitty Hawk Freight Airline Company • Summary of Case • Company embarking on purchase of new planes • Even though assets new, the return on equity was high • Basic question: How could you continue to earn high returns in a very competitive business.
DCF Analysis with Terminal Value
Fundamental Ideas • Objective is to get monopoly profit and then to grow these profits (not making judgment about capitalism here). • ROIC • Growth • Cost of Capital • Quote from Mc. Kinsey Book • Quote from Damoradan Book
Now, Evaluate the Sources and with Growth • In theory, growth comes from population growth and increase in productivity driven by new innovation. Say the real growth in the economy is 2. 5% from these two factors. (Of course, it is just about impossible to define productivity growth). • Growth in Spending in Economy • Consumption • Government Spending • Investment by Corporations (Cap Exp) • Growth in Sources of Funds • Salaries • Taxes • Profit Earned by Corporations • If the growth in profit earned by corporations exceeds the growth in the economy, then somebody has to be worse off. If growth is compounded, the situation keeps getting worse.
Finally, Consider the Case where Returns Exceed the Cost of Capital and Keep Growing • Say the growth in the economy is 2. 5%. If profits are 8%, then we can start with a base year where everything is somehow magically stable and move forward for 10, 20 and 100 years. • The little analysis demonstrates what happens when the cost of capital is over-stated by people getting MBA degrees from Columbia or Harvard. • Of course, there is a profit incentive necessary to provide incentives and grow the economy. But the question of who gets paid for risk is much more difficult.
Now, Evaluate who Takes Risks in an Economy • Using fundamental principles that risk can be allocated but not prevented, the basic economic equation can be presented in terms of risk: • Growth in Spending in Economy (Defined Level of Risk) • Consumption • Government Spending • Investment by Corporations (Cap Exp) • Growth in Sources of Funds (Same Level of Risk) • Salaries (Value Reduced with Risk) • Taxes • Profit Earned by Corporations (Returns Increase with Risk) • If the growth in profit earned by corporations exceeds the growth in the economy, then somebody has to be worse off. If growth is compounded, the situation keeps getting worse.
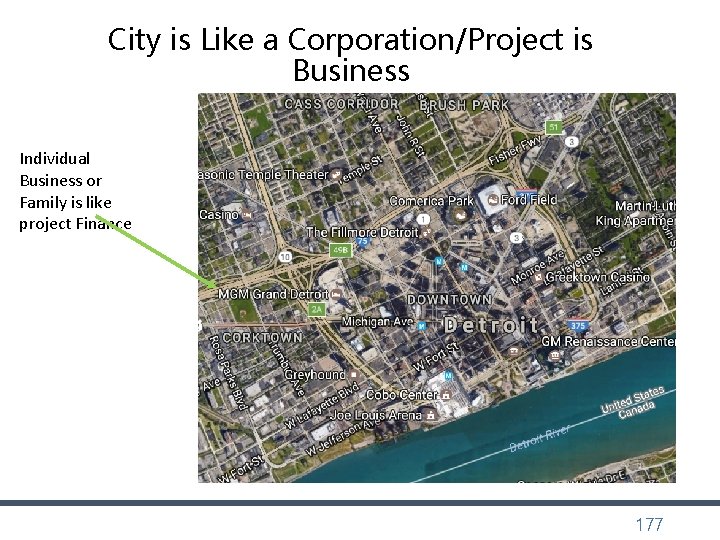
City is Like a Corporation/Project is Business Individual Business or Family is like project Finance 177
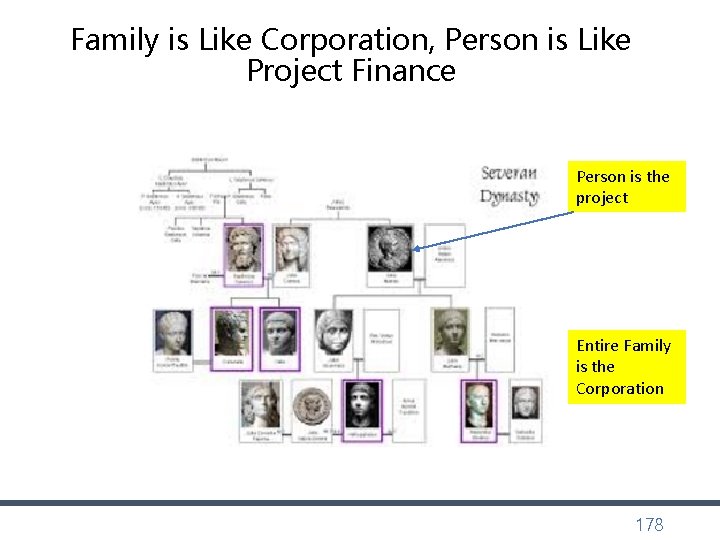
Family is Like Corporation, Person is Like Project Finance Person is the project Entire Family is the Corporation 178
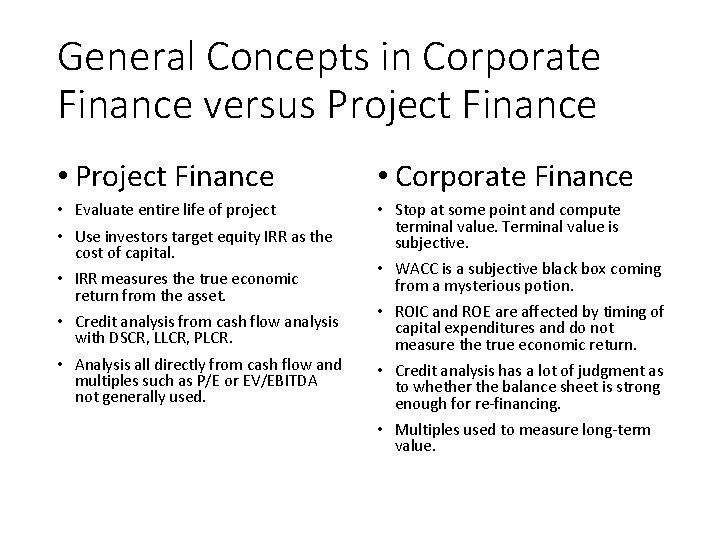
General Concepts in Corporate Finance versus Project Finance • Project Finance • Corporate Finance • Evaluate entire life of project • Stop at some point and compute terminal value. Terminal value is subjective. • Use investors target equity IRR as the cost of capital. • IRR measures the true economic return from the asset. • Credit analysis from cash flow analysis with DSCR, LLCR, PLCR. • Analysis all directly from cash flow and multiples such as P/E or EV/EBITDA not generally used. • WACC is a subjective black box coming from a mysterious potion. • ROIC and ROE are affected by timing of capital expenditures and do not measure the true economic return. • Credit analysis has a lot of judgment as to whether the balance sheet is strong enough for re-financing. • Multiples used to measure long-term value.
Use of Project Finance Ideas in Corporate Finance Understanding of Projects and IRR that makes-up Corporate Return Understanding how Rate of Return can Fluctuate due to Age of Projects Understanding Risk Changes and IRR in Corporate Finance (e. g. Synergies Risk Different from Base Assets) Notion of Cost of Capital as Minimum Required IRR 180