
CHAPTER 1 2 6 Financial Strategy CHAPTER 6
- Slides: 22
CHAPTER 1 2 6 Financial Strategy CHAPTER 6 Retailing Management 8 e © The Mc. Graw-Hill Companies, All rights reserved. 6 -
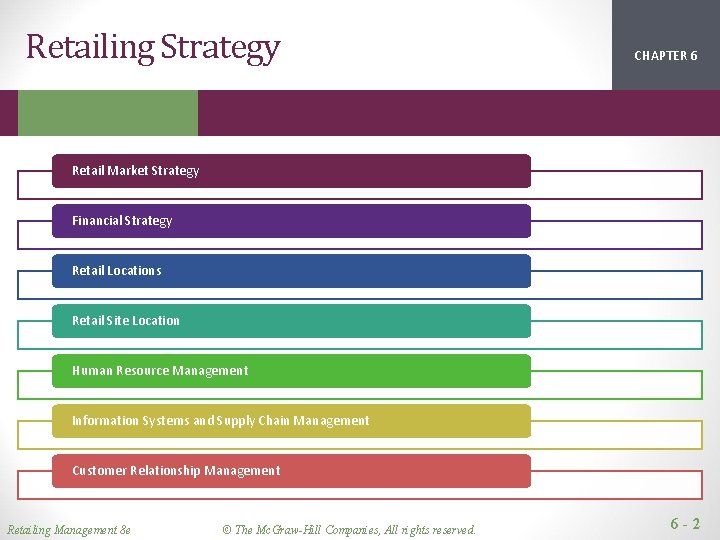
Retailing Strategy CHAPTER 1 2 6 Retail Market Strategy Financial Strategy Retail Locations Retail Site Location Human Resource Management Information Systems and Supply Chain Management Customer Relationship Management Retailing Management 8 e © The Mc. Graw-Hill Companies, All rights reserved. 6 -2
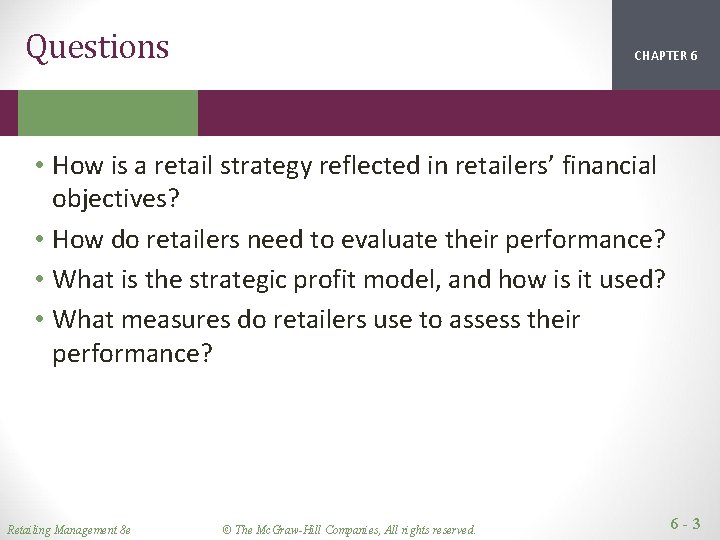
Questions CHAPTER 1 2 6 • How is a retail strategy reflected in retailers’ financial objectives? • How do retailers need to evaluate their performance? • What is the strategic profit model, and how is it used? • What measures do retailers use to assess their performance? Retailing Management 8 e © The Mc. Graw-Hill Companies, All rights reserved. 6 -3
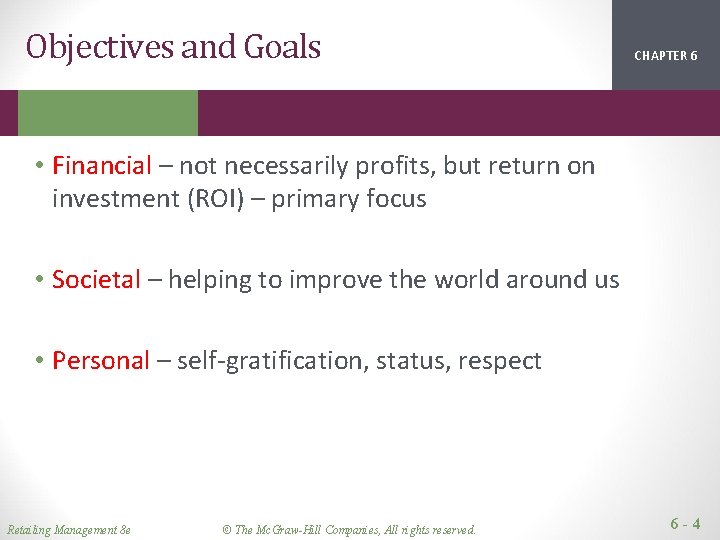
Objectives and Goals CHAPTER 1 2 6 • Financial – not necessarily profits, but return on investment (ROI) – primary focus • Societal – helping to improve the world around us • Personal – self-gratification, status, respect Retailing Management 8 e © The Mc. Graw-Hill Companies, All rights reserved. 6 -4
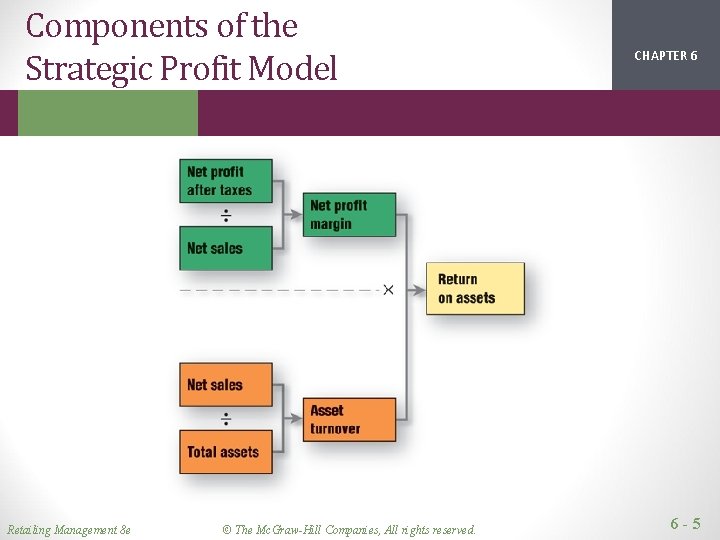
Components of the Strategic Profit Model Retailing Management 8 e © The Mc. Graw-Hill Companies, All rights reserved. CHAPTER 1 2 6 6 -5
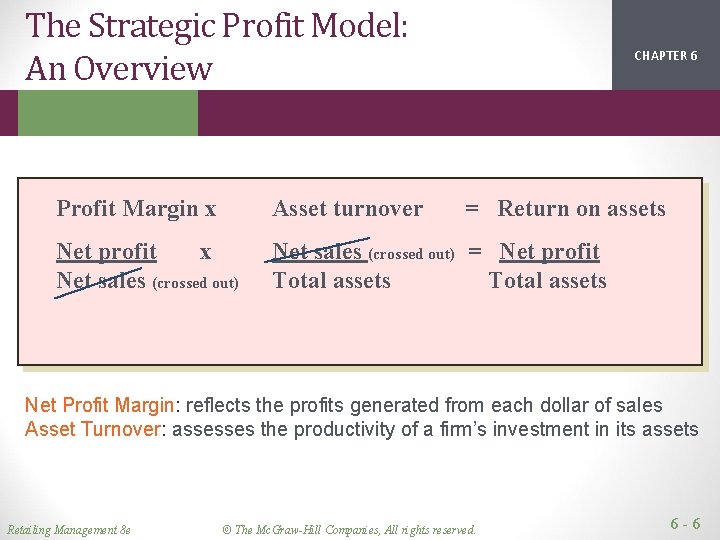
The Strategic Profit Model: An Overview CHAPTER 1 2 6 Profit Margin x Asset turnover = Return on assets Net profit x Net sales (crossed out) = Net profit Total assets Net Profit Margin: reflects the profits generated from each dollar of sales Asset Turnover: assesses the productivity of a firm’s investment in its assets Retailing Management 8 e © The Mc. Graw-Hill Companies, All rights reserved. 6 -6
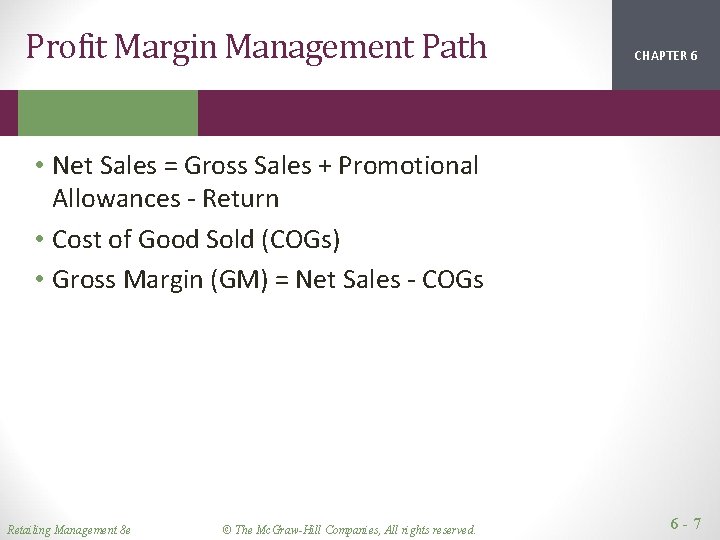
Profit Margin Management Path CHAPTER 1 2 6 • Net Sales = Gross Sales + Promotional Allowances - Return • Cost of Good Sold (COGs) • Gross Margin (GM) = Net Sales - COGs Retailing Management 8 e © The Mc. Graw-Hill Companies, All rights reserved. 6 -7
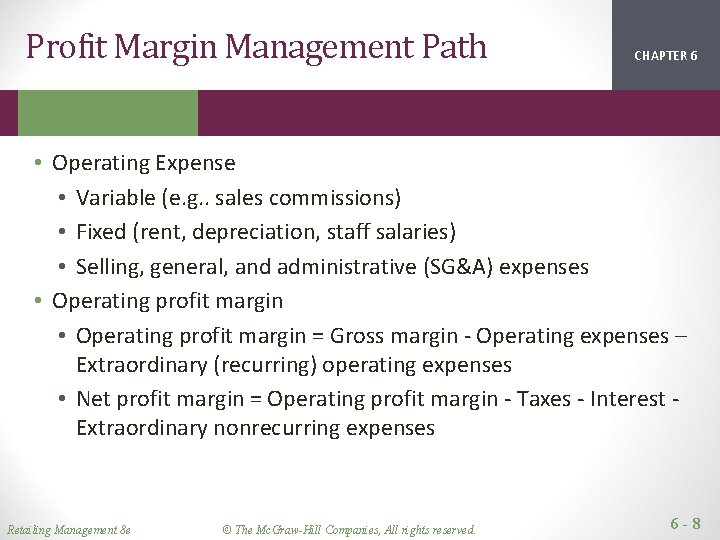
Profit Margin Management Path CHAPTER 1 2 6 • Operating Expense • Variable (e. g. . sales commissions) • Fixed (rent, depreciation, staff salaries) • Selling, general, and administrative (SG&A) expenses • Operating profit margin = Gross margin - Operating expenses – Extraordinary (recurring) operating expenses • Net profit margin = Operating profit margin - Taxes - Interest Extraordinary nonrecurring expenses Retailing Management 8 e © The Mc. Graw-Hill Companies, All rights reserved. 6 -8
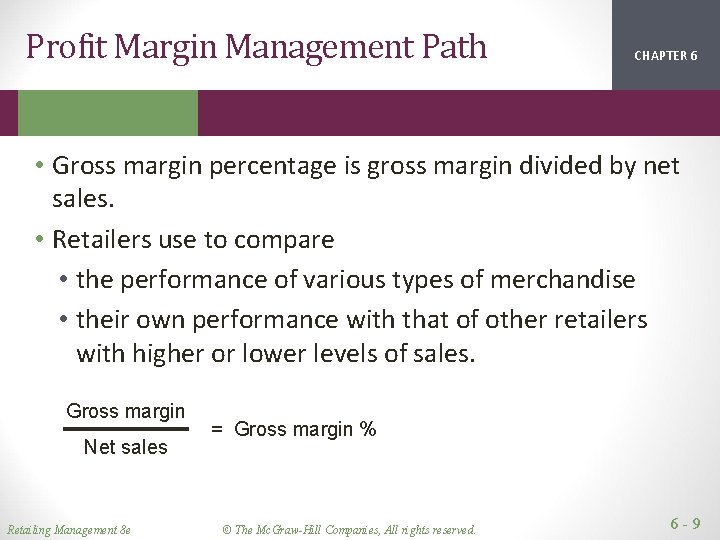
Profit Margin Management Path CHAPTER 1 2 6 • Gross margin percentage is gross margin divided by net sales. • Retailers use to compare • the performance of various types of merchandise • their own performance with that of other retailers with higher or lower levels of sales. Gross margin Net sales Retailing Management 8 e = Gross margin % © The Mc. Graw-Hill Companies, All rights reserved. 6 -9
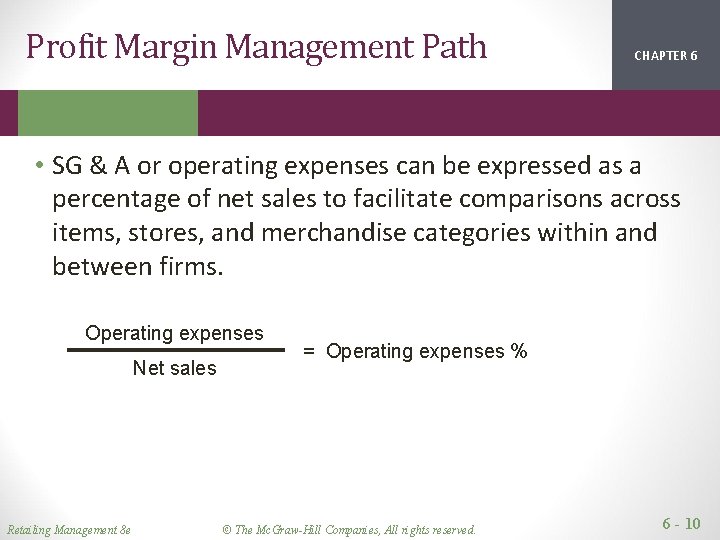
Profit Margin Management Path CHAPTER 1 2 6 • SG & A or operating expenses can be expressed as a percentage of net sales to facilitate comparisons across items, stores, and merchandise categories within and between firms. Operating expenses Net sales Retailing Management 8 e = Operating expenses % © The Mc. Graw-Hill Companies, All rights reserved. 6 - 10
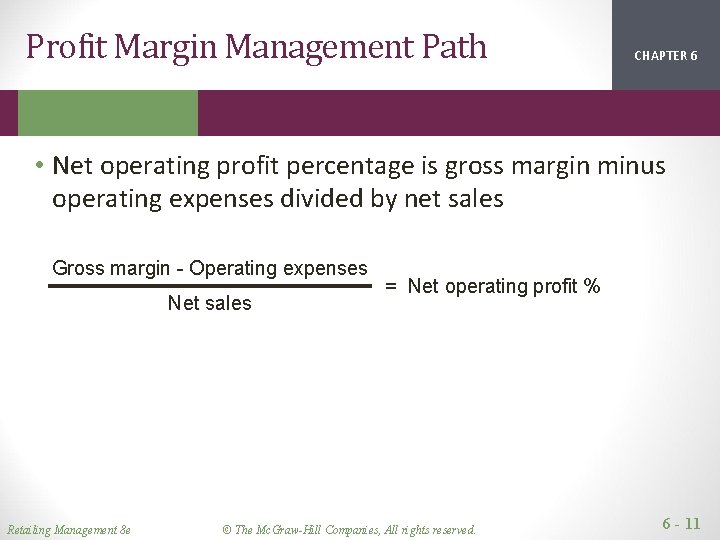
Profit Margin Management Path CHAPTER 1 2 6 • Net operating profit percentage is gross margin minus operating expenses divided by net sales Gross margin - Operating expenses Net sales Retailing Management 8 e = Net operating profit % © The Mc. Graw-Hill Companies, All rights reserved. 6 - 11
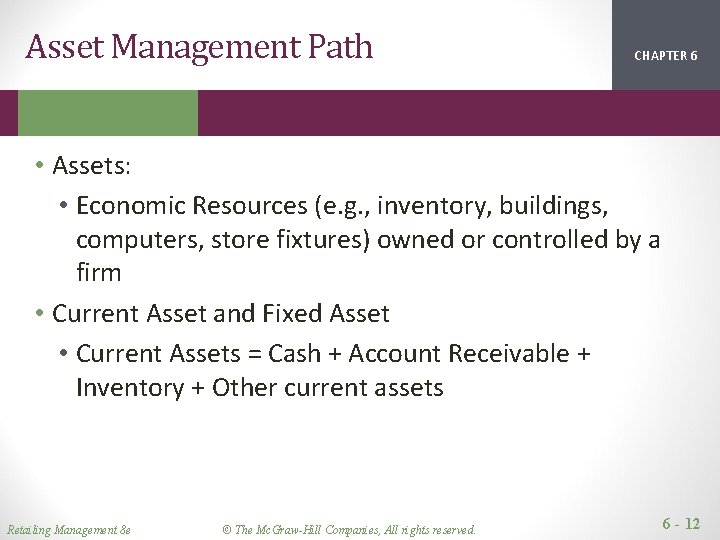
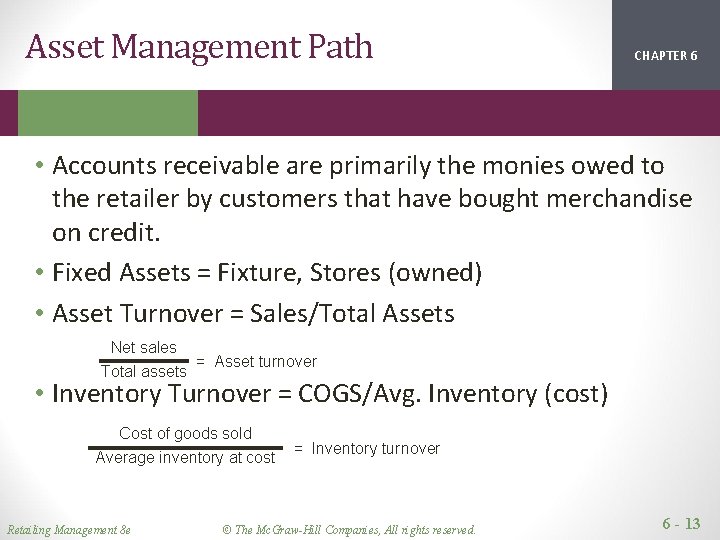
Asset Management Path CHAPTER 1 2 6 • Assets: • Economic Resources (e. g. , inventory, buildings, computers, store fixtures) owned or controlled by a firm • Current Asset and Fixed Asset • Current Assets = Cash + Account Receivable + Inventory + Other current assets Retailing Management 8 e © The Mc. Graw-Hill Companies, All rights reserved. 6 - 12
Asset Management Path CHAPTER 1 2 6 • Accounts receivable are primarily the monies owed to the retailer by customers that have bought merchandise on credit. • Fixed Assets = Fixture, Stores (owned) • Asset Turnover = Sales/Total Assets Net sales = Asset turnover Total assets • Inventory Turnover = COGS/Avg. Inventory (cost) Cost of goods sold Average inventory at cost Retailing Management 8 e = Inventory turnover © The Mc. Graw-Hill Companies, All rights reserved. 6 - 13
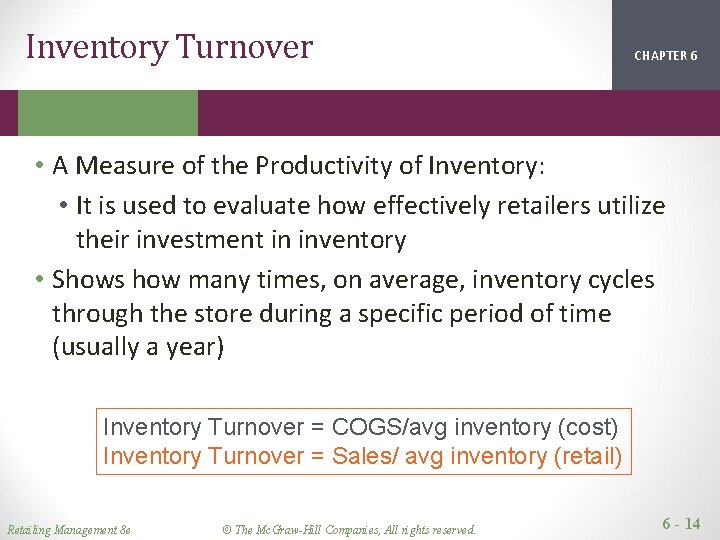
Inventory Turnover CHAPTER 1 2 6 • A Measure of the Productivity of Inventory: • It is used to evaluate how effectively retailers utilize their investment in inventory • Shows how many times, on average, inventory cycles through the store during a specific period of time (usually a year) Inventory Turnover = COGS/avg inventory (cost) Inventory Turnover = Sales/ avg inventory (retail) Retailing Management 8 e © The Mc. Graw-Hill Companies, All rights reserved. 6 - 14
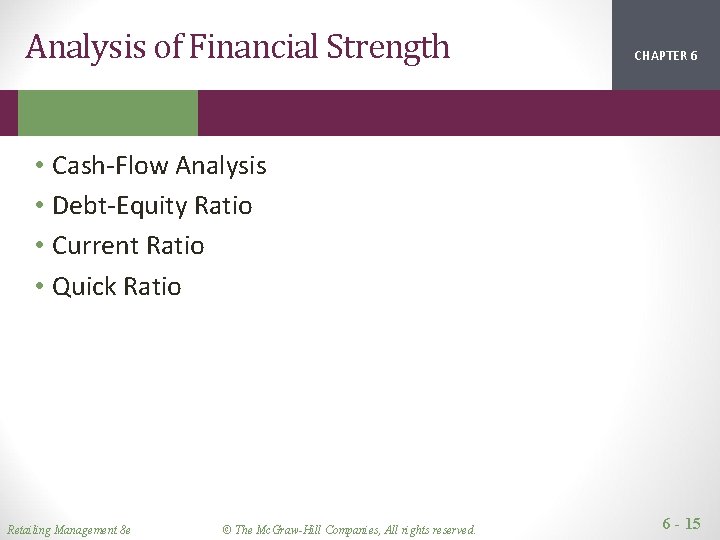
Analysis of Financial Strength CHAPTER 1 2 6 • Cash-Flow Analysis • Debt-Equity Ratio • Current Ratio • Quick Ratio Retailing Management 8 e © The Mc. Graw-Hill Companies, All rights reserved. 6 - 15
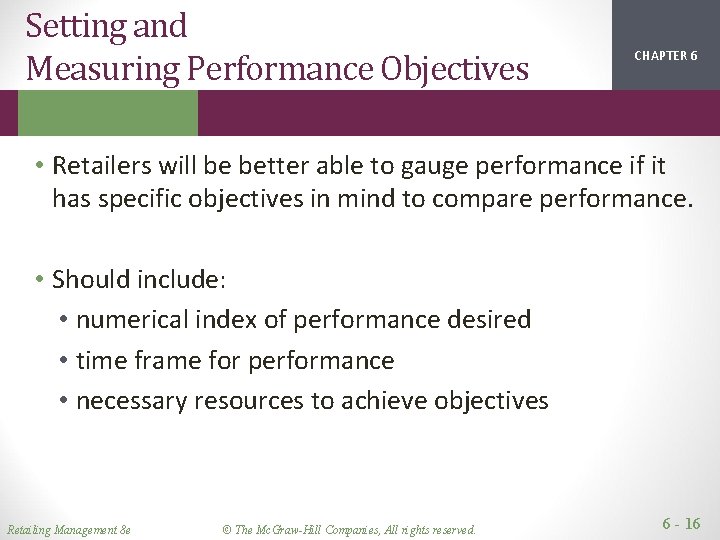
Setting and Measuring Performance Objectives CHAPTER 1 2 6 • Retailers will be better able to gauge performance if it has specific objectives in mind to compare performance. • Should include: • numerical index of performance desired • time frame for performance • necessary resources to achieve objectives Retailing Management 8 e © The Mc. Graw-Hill Companies, All rights reserved. 6 - 16
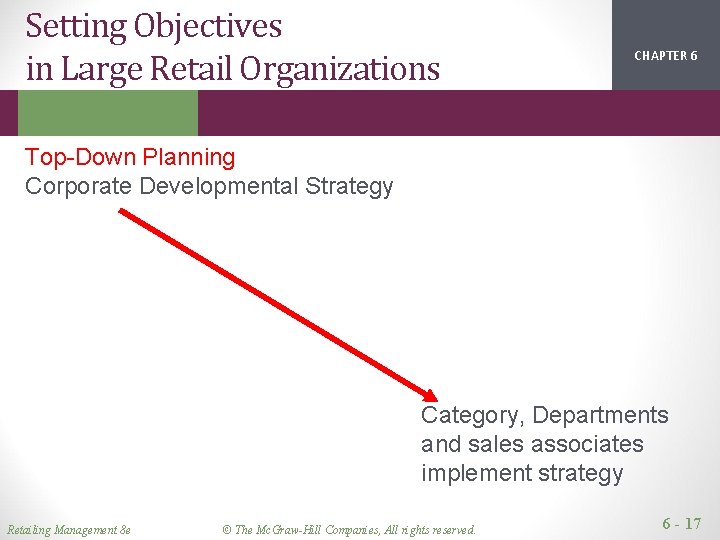
Setting Objectives in Large Retail Organizations CHAPTER 1 2 6 Top-Down Planning Corporate Developmental Strategy Category, Departments and sales associates implement strategy Retailing Management 8 e © The Mc. Graw-Hill Companies, All rights reserved. 6 - 17
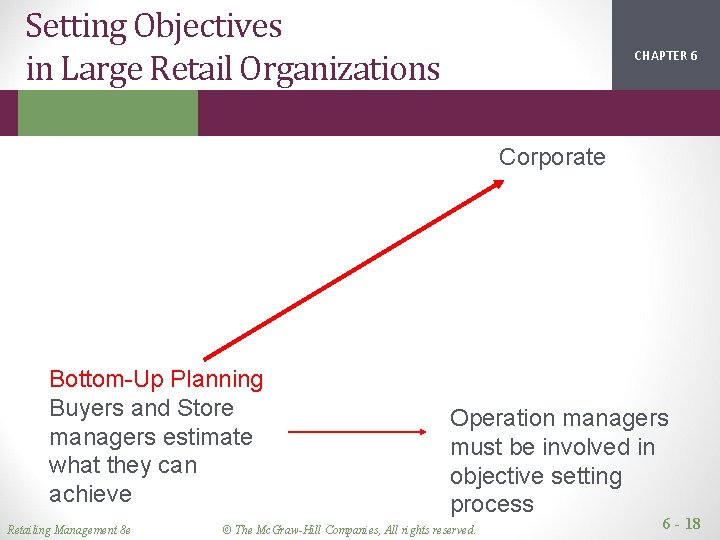
Setting Objectives in Large Retail Organizations CHAPTER 1 2 6 Corporate Bottom-Up Planning Buyers and Store managers estimate what they can achieve Retailing Management 8 e Operation managers must be involved in objective setting process © The Mc. Graw-Hill Companies, All rights reserved. 6 - 18
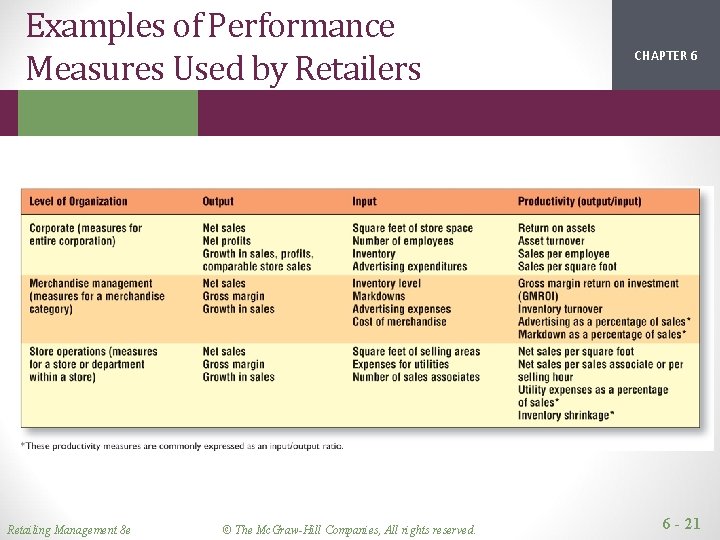
Productivity Measures CHAPTER 1 2 6 Input Measures – assess the amount of resources or money used by the retailer to achieve outputs such as sales Output measures – asses the results of a retailer’s investment decisions Productivity measure – determines how effectively retailers use their resource – what return (e. g. , profits) they get on their investments (e. g. , expenses) Retailing Management 8 e © The Mc. Graw-Hill Companies, All rights reserved. 6 - 19
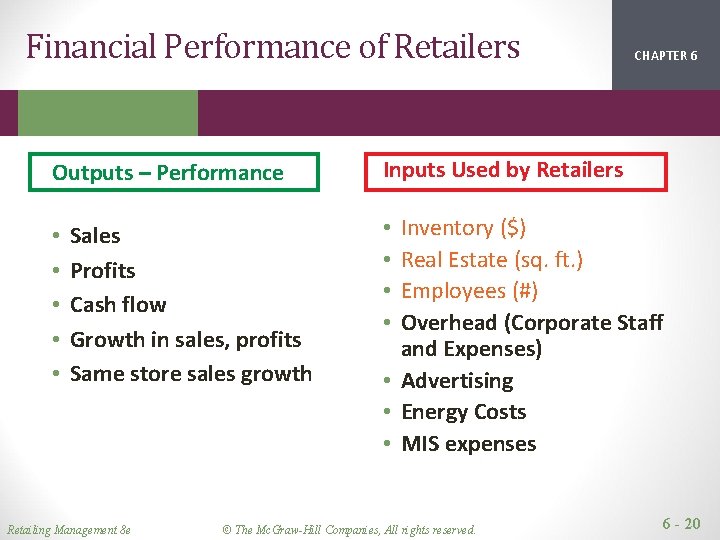
Financial Performance of Retailers Outputs – Performance • • • Sales Profits Cash flow Growth in sales, profits Same store sales growth Retailing Management 8 e CHAPTER 1 2 6 Inputs Used by Retailers Inventory ($) Real Estate (sq. ft. ) Employees (#) Overhead (Corporate Staff and Expenses) • Advertising • Energy Costs • MIS expenses • • © The Mc. Graw-Hill Companies, All rights reserved. 6 - 20
Examples of Performance Measures Used by Retailers Retailing Management 8 e © The Mc. Graw-Hill Companies, All rights reserved. CHAPTER 1 2 6 6 - 21
Assessing Performance CHAPTER 1 2 6 • Growth in Stockholder Value – Stock Price • Accounting Measures – ROA (Risk adjusted) • Benchmark • Performance Over Time • Compare performance indicator for three years • Performance Compared to Competitors • Compare performance indicators with major competitors for one year, most recent Retailing Management 8 e © The Mc. Graw-Hill Companies, All rights reserved. 6 - 22