
Chapman Greek Life Summary Greek Life membership data
Chapman Greek Life
Summary Ø Greek Life membership data was gathered through an End of Semester Report in December 2017 and May 2018 Ø As of December 2017, there were 1, 630 unique students involved in 16 different Greek organizations during the 2017 -2018 academic year Ø Delta Sigma Phi was colonized in the Spring of 2018 and will participate in recruitment beginning Fall 2018. Ø Greek Demographics, GPA, Recruitment, Chapter Excellence Assessment, Presidents Meeting, and additional Greek programming information are included in this report.
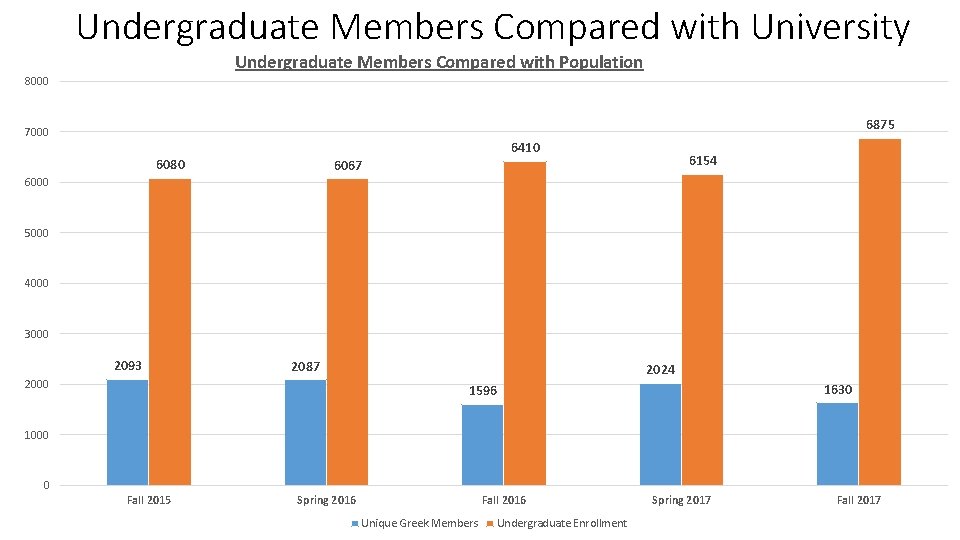
Undergraduate Members Compared with University Undergraduate Members Compared with Population 8000 6875 7000 6410 6080 6154 6067 6000 5000 4000 3000 2093 2087 2000 2024 1630 1596 1000 0 Fall 2015 Spring 2016 Fall 2016 Unique Greek Members Undergraduate Enrollment Spring 2017 Fall 2017
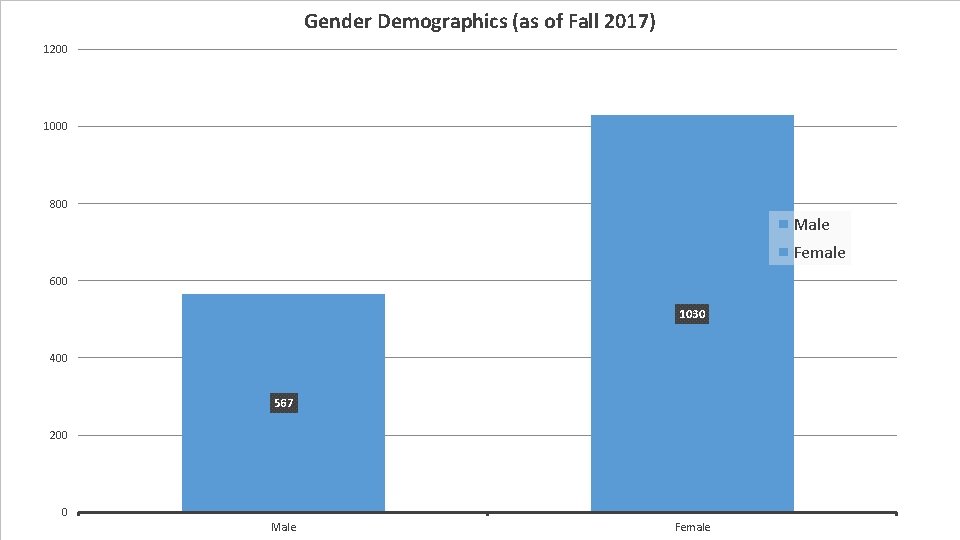
Gender Demographics (as of Fall 2017) 1200 1000 800 Male Female 600 1030 400 567 200 0 Male Female
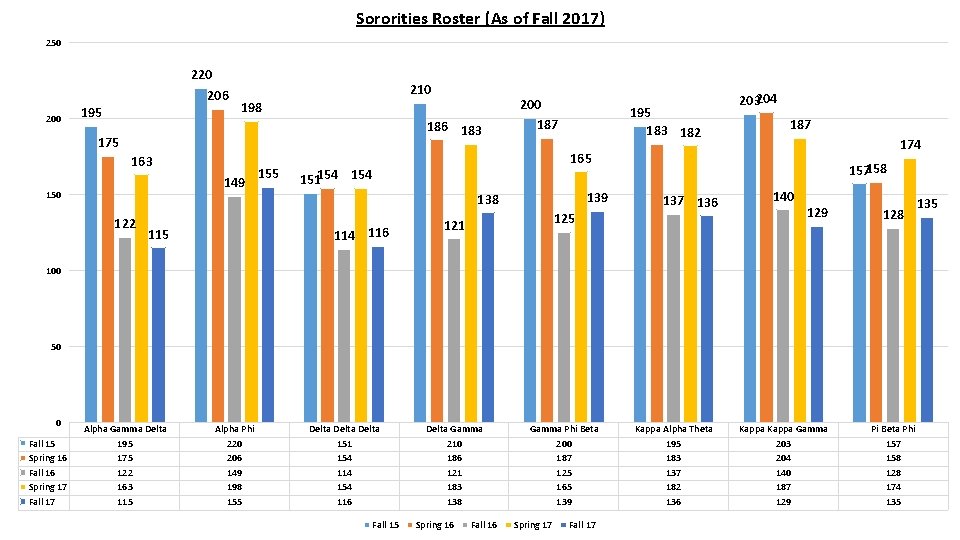
Sororities Roster (As of Fall 2017) 250 220 206 195 210 198 186 183 175 163 149 150 122 155 195 183 182 203204 187 174 165 151154 139 138 114 116 115 200 187 125 121 157158 137 136 140 129 128 100 50 0 Fall 15 Spring 16 Fall 16 Spring 17 Fall 17 Alpha Gamma Delta 195 175 122 163 115 Alpha Phi 220 206 149 198 155 Delta 151 154 114 154 116 Fall 15 Delta Gamma 210 186 121 183 138 Spring 16 Fall 16 Gamma Phi Beta 200 187 125 165 139 Spring 17 Fall 17 Kappa Alpha Theta 195 183 137 182 136 Kappa Gamma 203 204 140 187 129 Pi Beta Phi 157 158 128 174 135
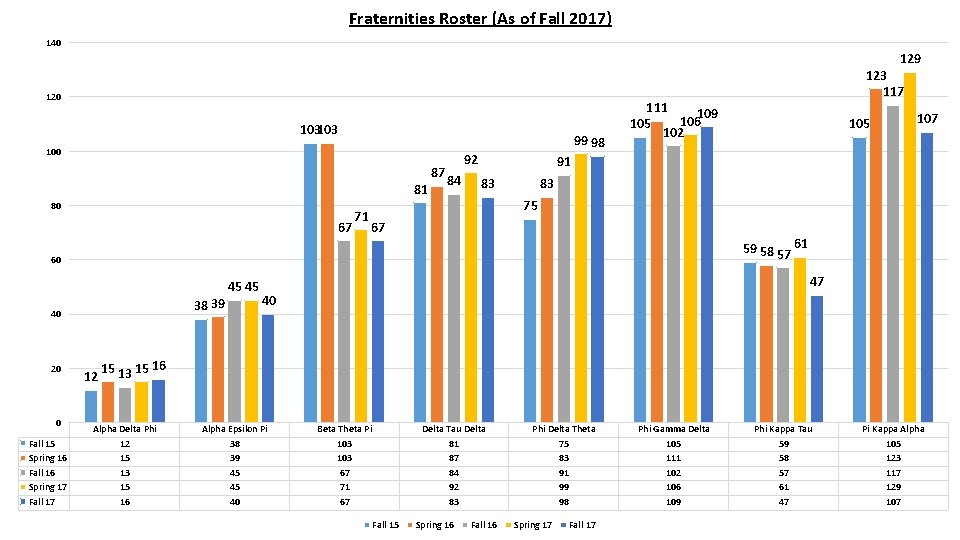
Fraternities Roster (As of Fall 2017) 140 129 120 103103 100 81 80 67 71 87 99 98 92 84 111 109 106 105 102 38 39 40 20 0 Fall 15 Spring 16 Fall 16 Spring 17 Fall 17 12 105 107 91 83 83 75 67 59 58 57 61 60 45 45 123 117 47 40 15 13 15 16 Alpha Delta Phi 12 15 13 15 16 Alpha Epsilon Pi 38 39 45 45 40 Beta Theta Pi 103 67 71 67 Fall 15 Delta Tau Delta 81 87 84 92 83 Spring 16 Fall 16 Phi Delta Theta 75 83 91 99 98 Spring 17 Fall 17 Phi Gamma Delta 105 111 102 106 109 Phi Kappa Tau 59 58 57 61 47 Pi Kappa Alpha 105 123 117 129 107
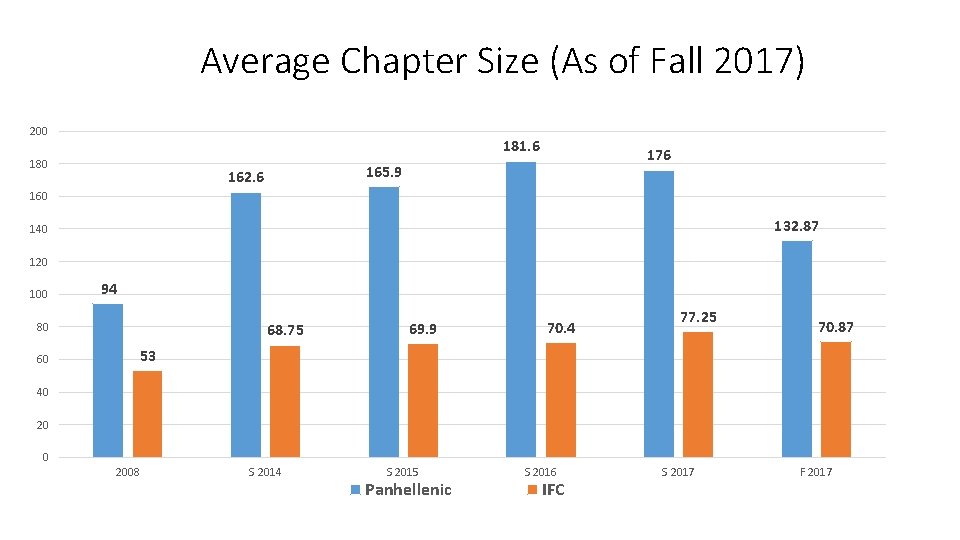
Average Chapter Size (As of Fall 2017) 200 181. 6 180 176 165. 9 162. 6 160 132. 87 140 120 100 94 80 60 68. 75 69. 9 70. 4 77. 25 70. 87 53 40 2008 S 2014 S 2015 Panhellenic S 2016 IFC S 2017 F 2017
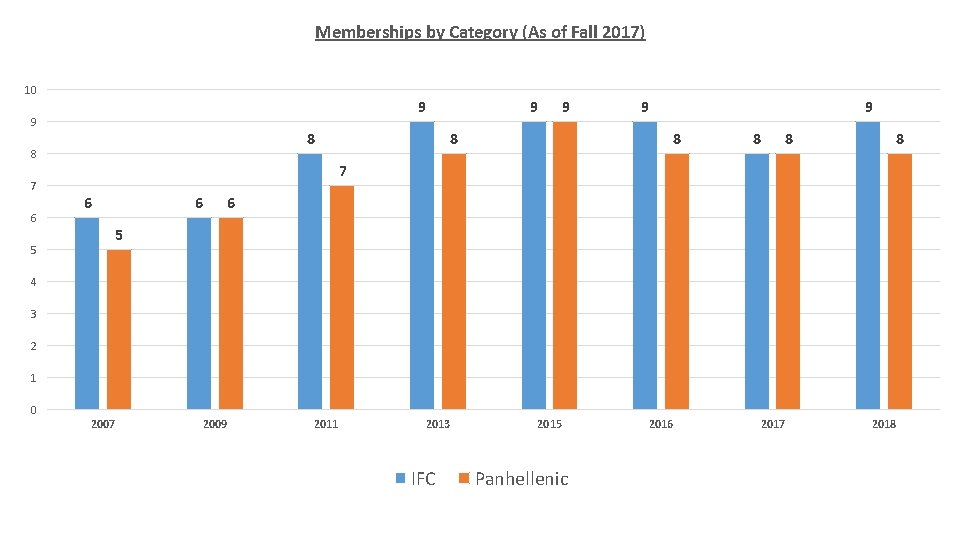
Memberships by Category (As of Fall 2017) 10 9 9 8 8 7 6 9 9 9 8 8 8 8 7 6 6 6 5 5 4 3 2 1 0 2007 2009 2011 2013 IFC 2015 Panhellenic 2016 2017 2018
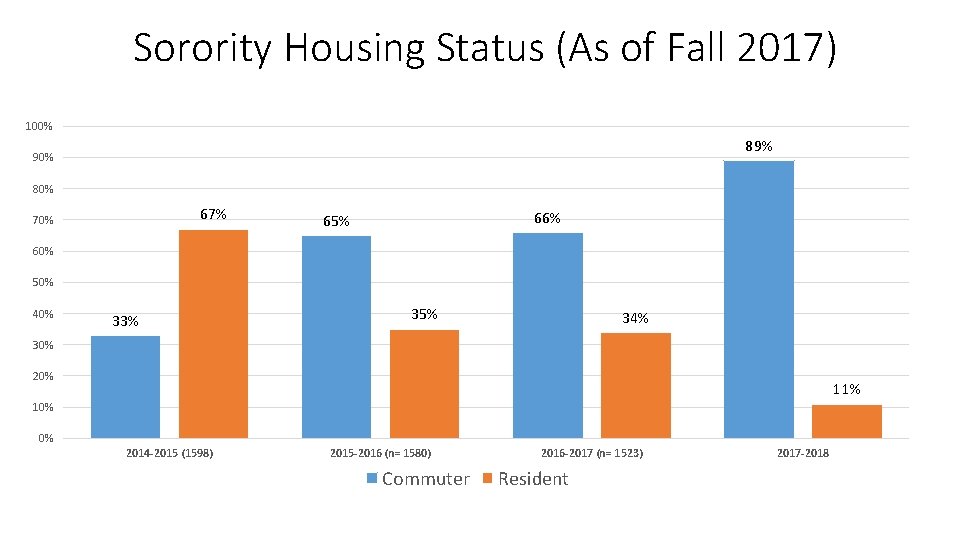
Sorority Housing Status (As of Fall 2017) 100% 89% 90% 80% 67% 70% 66% 65% 60% 50% 40% 33% 35% 34% 30% 20% 11% 10% 0% 2014 -2015 (1598) 2015 -2016 (n= 1580) Commuter 2016 -2017 (n= 1523) Resident 2017 -2018
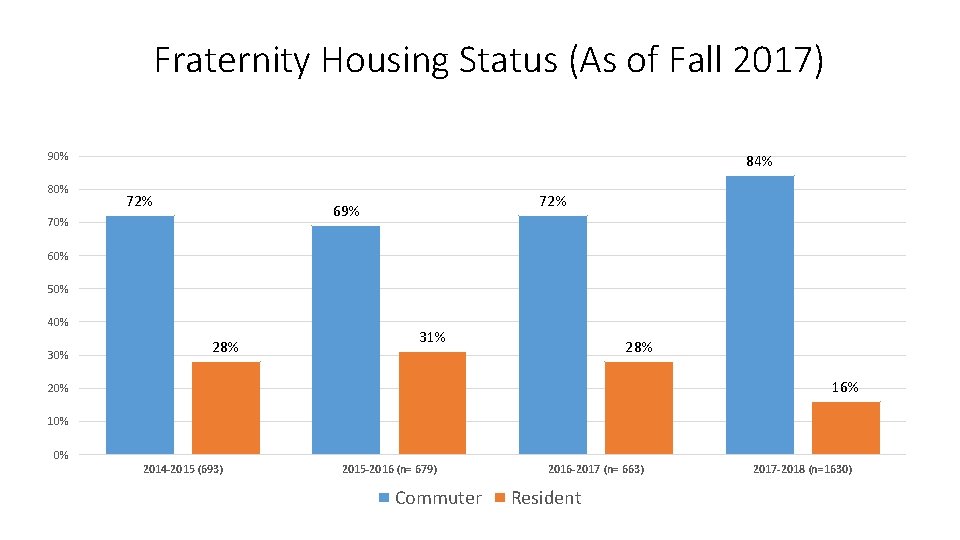
Fraternity Housing Status (As of Fall 2017) 90% 84% 72% 69% 70% 60% 50% 40% 30% 28% 31% 28% 16% 20% 10% 0% 2014 -2015 (693) 2015 -2016 (n= 679) Commuter 2016 -2017 (n= 663) Resident 2017 -2018 (n=1630)
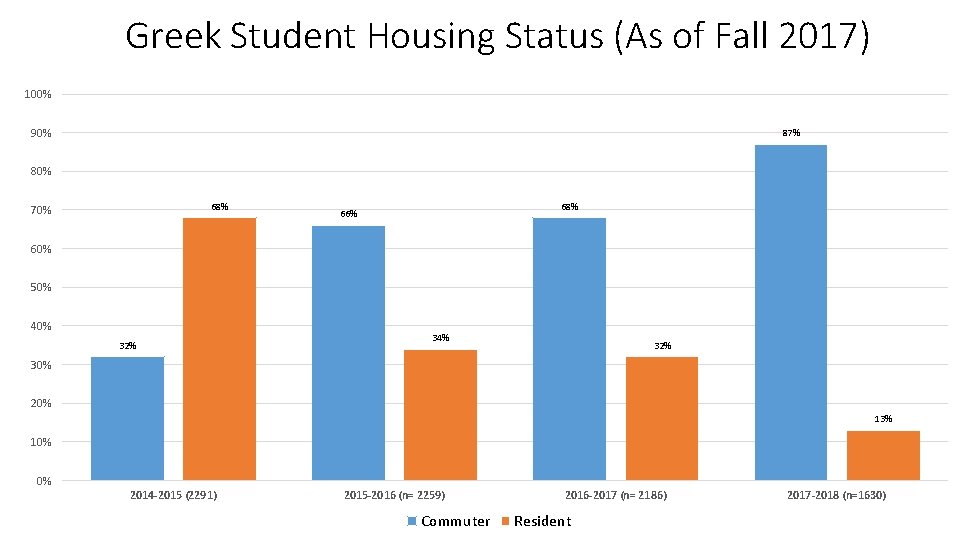
Greek Student Housing Status (As of Fall 2017) 100% 90% 87% 80% 68% 70% 68% 66% 60% 50% 40% 32% 34% 32% 30% 20% 13% 10% 0% 2014 -2015 (2291) 2015 -2016 (n= 2259) Commuter 2016 -2017 (n= 2186) Resident 2017 -2018 (n=1630)
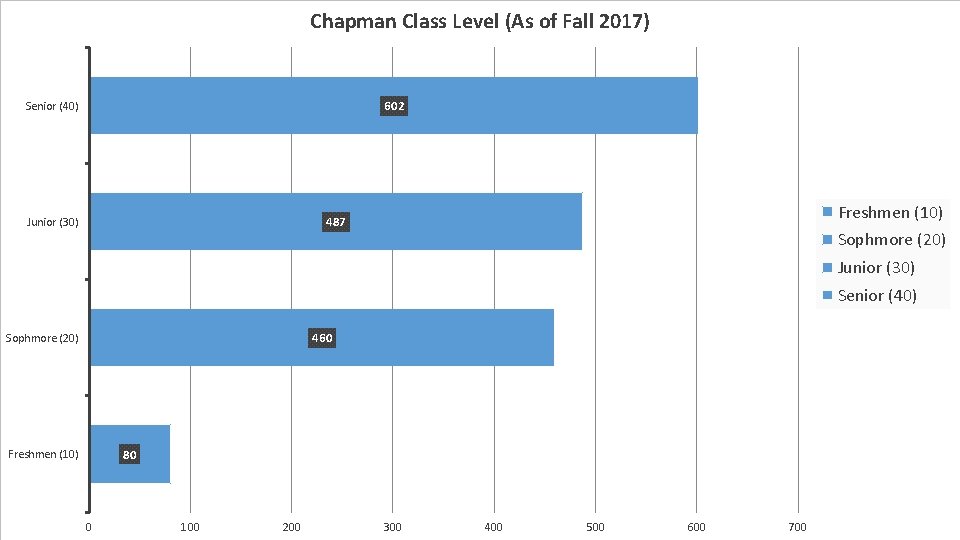
Chapman Class Level (As of Fall 2017) 602 Senior (40) Freshmen (10) 487 Junior (30) Sophmore (20) Junior (30) Senior (40) 460 Sophmore (20) 80 Freshmen (10) 0 100 200 300 400 500 600 700
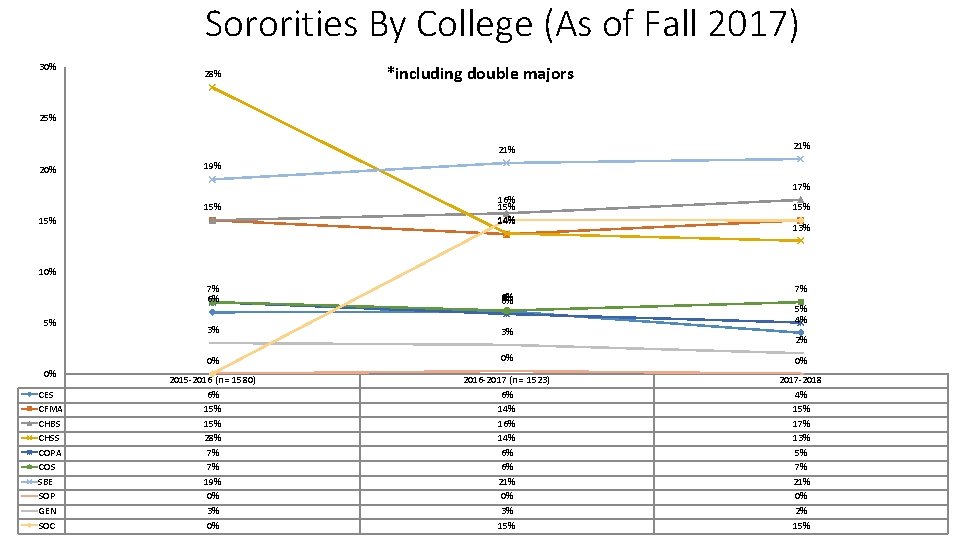
Sororities By College (As of Fall 2017) 30% 28% *including double majors 25% 21% 20% 21% 19% 17% 15% 16% 15% 14% 15% 13% 10% 5% 0% CES CFMA CHBS CHSS COPA COS SBE SOP GEN SOC 7% 6% 6% 6% 7% 3% 3% 0% 0% 0% 2015 -2016 (n = 1580) 6% 15% 28% 7% 7% 19% 0% 3% 0% 2016 -2017 (n = 1523) 6% 14% 16% 14% 6% 6% 21% 0% 3% 15% 2017 -2018 4% 15% 17% 13% 5% 7% 21% 0% 2% 15% 5% 4% 2%
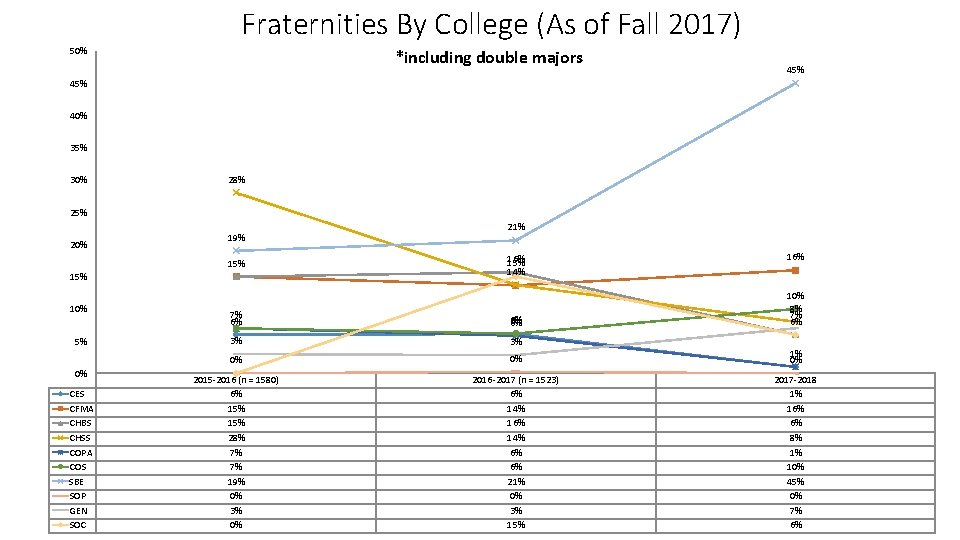
Fraternities By College (As of Fall 2017) 50% *including double majors 45% 40% 35% 30% 28% 25% 20% 19% 15% 10% 5% 0% CES CFMA CHBS CHSS COPA COS SBE SOP GEN SOC 21% 16% 15% 14% 16% 10% 8% 7% 6% 6% 6% 3% 3% 0% 0% 1% 0% 2015 -2016 (n = 1580) 6% 15% 28% 7% 7% 19% 0% 3% 0% 2016 -2017 (n = 1523) 6% 14% 16% 14% 6% 6% 21% 0% 3% 15% 2017 -2018 1% 16% 6% 8% 1% 10% 45% 0% 7% 6%
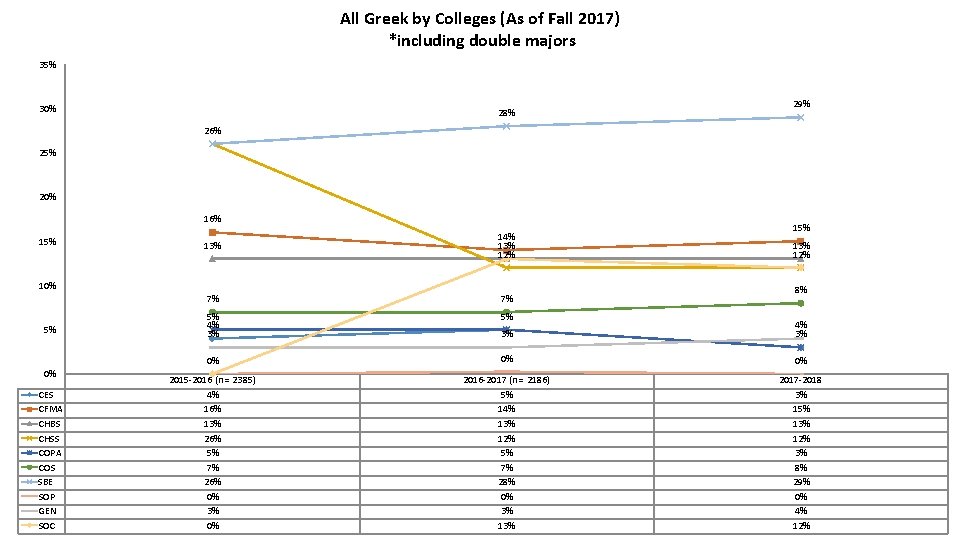
All Greek by Colleges (As of Fall 2017) *including double majors 35% 30% 28% 29% 26% 25% 20% 16% 15% 13% 7% 7% 5% 4% 3% 5% 3% 4% 3% 0% 0% 0% 2015 -2016 (n = 2385) 4% 16% 13% 26% 5% 7% 26% 0% 3% 0% 2016 -2017 (n = 2186) 5% 14% 13% 12% 5% 7% 28% 0% 3% 13% 2017 -2018 3% 15% 13% 12% 3% 8% 29% 0% 4% 12% 10% 5% 0% CES CFMA CHBS CHSS COPA COS SBE SOP GEN SOC 15% 14% 13% 12% 8%
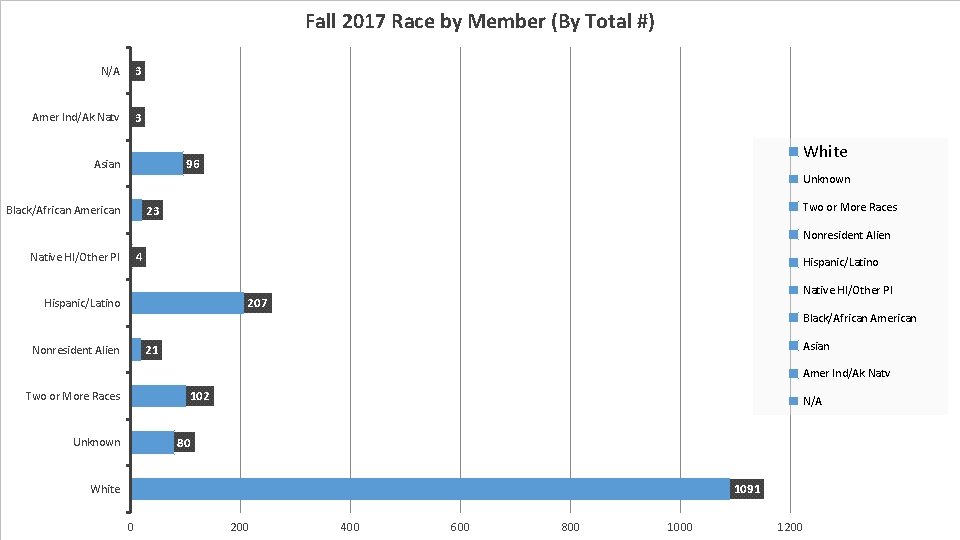
Fall 2017 Race by Member (By Total #) N/A 3 Amer Ind/Ak Natv 3 White 96 Asian Unknown Two or More Races 23 Black/African American Nonresident Alien 4 Native HI/Other PI Hispanic/Latino Native HI/Other PI 207 Hispanic/Latino Black/African American Asian 21 Nonresident Alien Amer Ind/Ak Natv 102 Two or More Races N/A 80 Unknown 1091 White 0 200 400 600 800 1000 1200
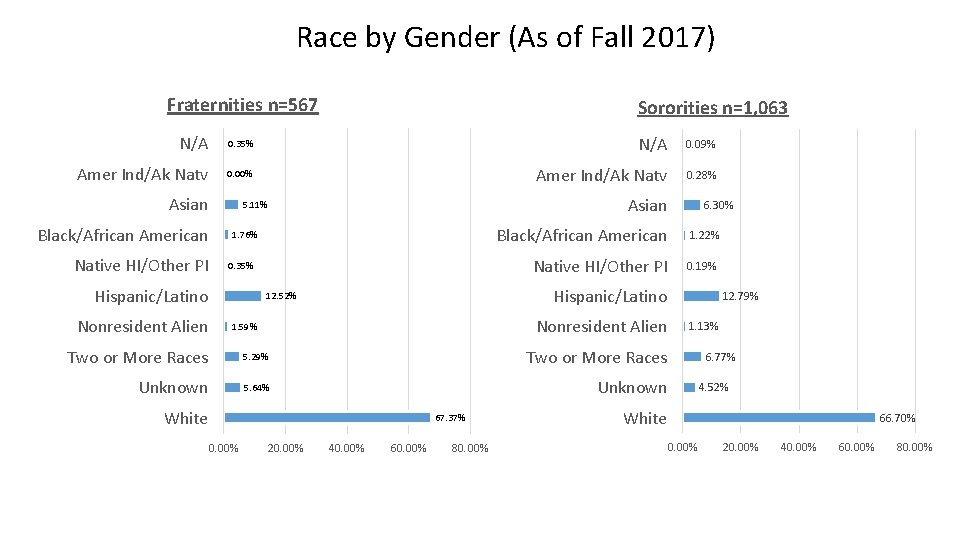
Race by Gender (As of Fall 2017) Fraternities n=567 Sororities n=1, 063 N/A 0. 35% N/A 0. 09% Amer Ind/Ak Natv 0. 00% Amer Ind/Ak Natv 0. 28% Asian Black/African American Native HI/Other PI 1. 76% 0. 35% Hispanic/Latino Nonresident Alien Asian 5. 11% Black/African American 1. 22% Native HI/Other PI 0. 19% Hispanic/Latino 12. 52% Nonresident Alien 1. 59% Two or More Races 5. 29% Two or More Races Unknown 5. 64% Unknown White 67. 37% 0. 00% 20. 00% 6. 30% 40. 00% 60. 00% 80. 00% 12. 79% 1. 13% 6. 77% 4. 52% White 66. 70% 0. 00% 20. 00% 40. 00% 60. 00% 80. 00%
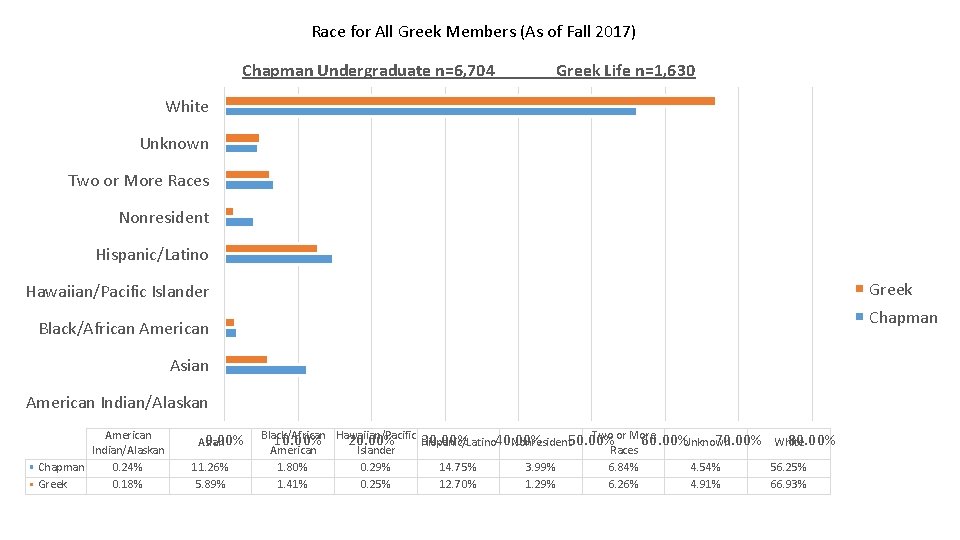
Race for All Greek Members (As of Fall 2017) Chapman Undergraduate n=6, 704 Greek Life n=1, 630 White Unknown Two or More Races Nonresident Hispanic/Latino Greek Hawaiian/Pacific Islander Chapman Black/African American Asian American Indian/Alaskan Chapman 0. 24% Greek 0. 18% 0. 00% Asian 11. 26% 5. 89% Black/African Two or More 10. 00% Hawaiian/Pacific 20. 00% 30. 00% 40. 00% 60. 00%Unknown 70. 00% White 80. 00% Hispanic/Latino Nonresident 50. 00% American Islander Races 1. 80% 0. 29% 14. 75% 3. 99% 6. 84% 4. 54% 56. 25% 1. 41% 0. 25% 12. 70% 1. 29% 6. 26% 4. 91% 66. 93%
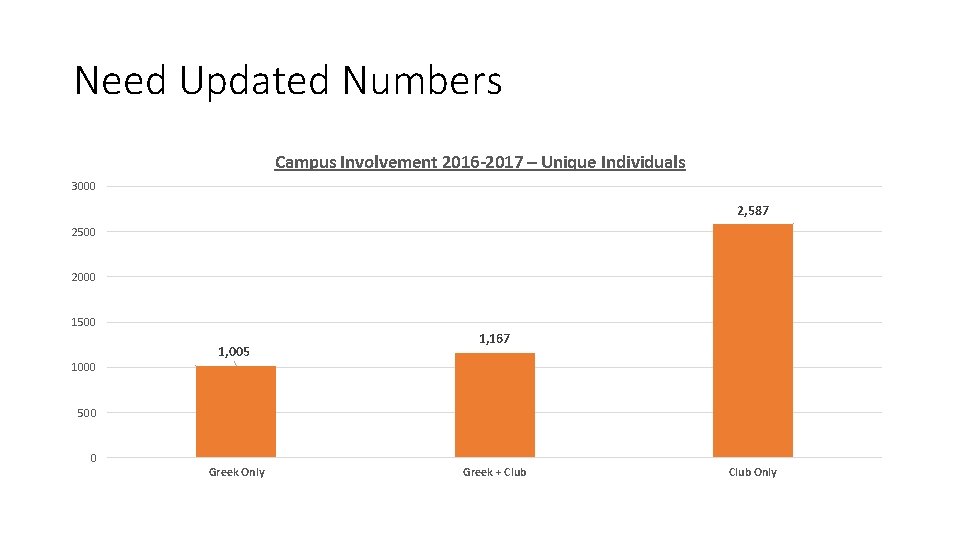
Need Updated Numbers Campus Involvement 2016 -2017 – Unique Individuals 3000 2, 587 2500 2000 1500 1000 1, 005 1, 167 500 0 Greek Only Greek + Club Only
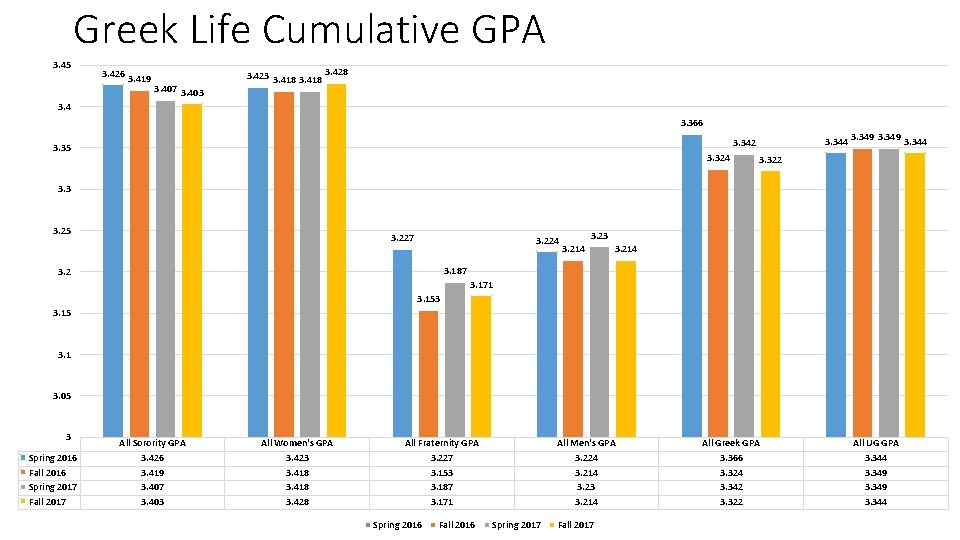
Greek Life Cumulative GPA 3. 45 3. 426 3. 419 3. 407 3. 403 3. 423 3. 418 3. 428 3. 4 3. 366 3. 344 3. 349 3. 344 3. 342 3. 35 3. 324 3. 322 3. 3 3. 25 3. 227 3. 224 3. 23 3. 214 3. 187 3. 2 3. 171 3. 153 3. 15 3. 1 3. 05 3 Spring 2016 Fall 2016 Spring 2017 Fall 2017 All Sorority GPA 3. 426 3. 419 3. 407 3. 403 All Women's GPA 3. 423 3. 418 3. 428 All Fraternity GPA 3. 227 3. 153 3. 187 3. 171 Spring 2016 Fall 2016 All Men's GPA 3. 224 3. 214 3. 23 3. 214 Spring 2017 Fall 2017 All Greek GPA 3. 366 3. 324 3. 342 3. 322 All UG GPA 3. 344 3. 349 3. 344
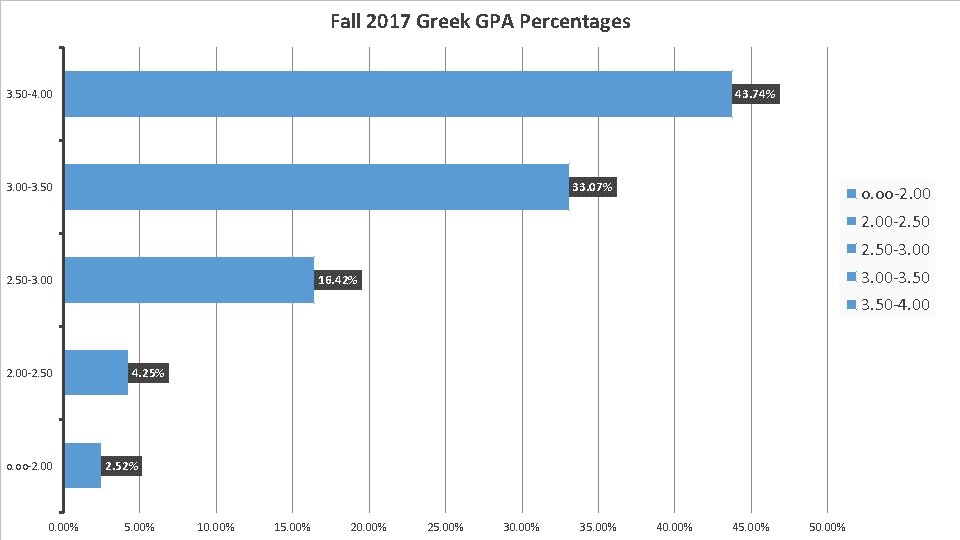
Fall 2017 Greek GPA Percentages 43. 74% 3. 50 -4. 00 33. 07% 3. 00 -3. 50 o. oo-2. 00 -2. 50 -3. 00 -3. 50 16. 42% 2. 50 -3. 00 3. 50 -4. 00 2. 00 -2. 50 o. oo-2. 00 0. 00% 4. 25% 2. 52% 5. 00% 10. 00% 15. 00% 20. 00% 25. 00% 30. 00% 35. 00% 40. 00% 45. 00% 50. 00%
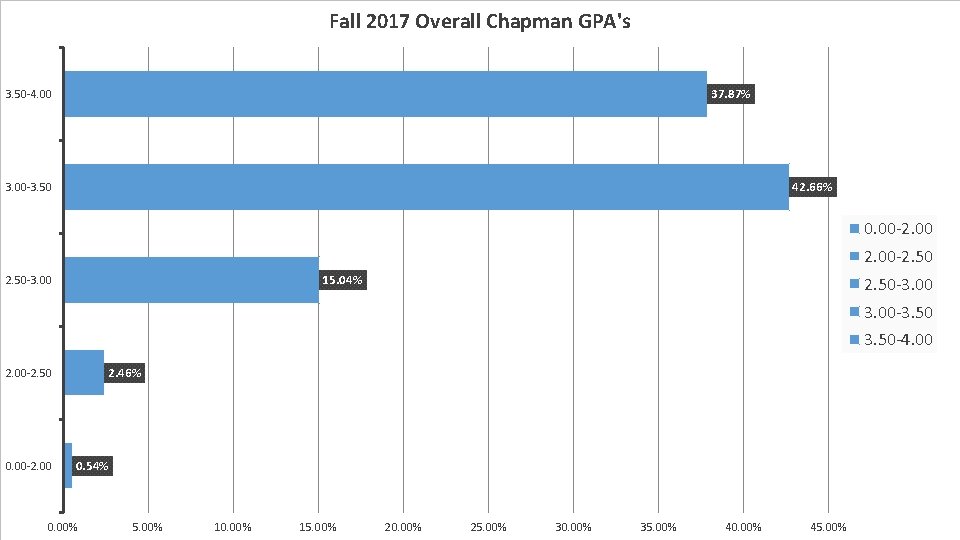
Fall 2017 Overall Chapman GPA's 37. 87% 3. 50 -4. 00 42. 66% 3. 00 -3. 50 0. 00 -2. 50 15. 04% 2. 50 -3. 00 -3. 50 -4. 00 2. 46% 2. 00 -2. 50 0. 00 -2. 00 0. 54% 0. 00% 5. 00% 10. 00% 15. 00% 20. 00% 25. 00% 30. 00% 35. 00% 40. 00% 45. 00%
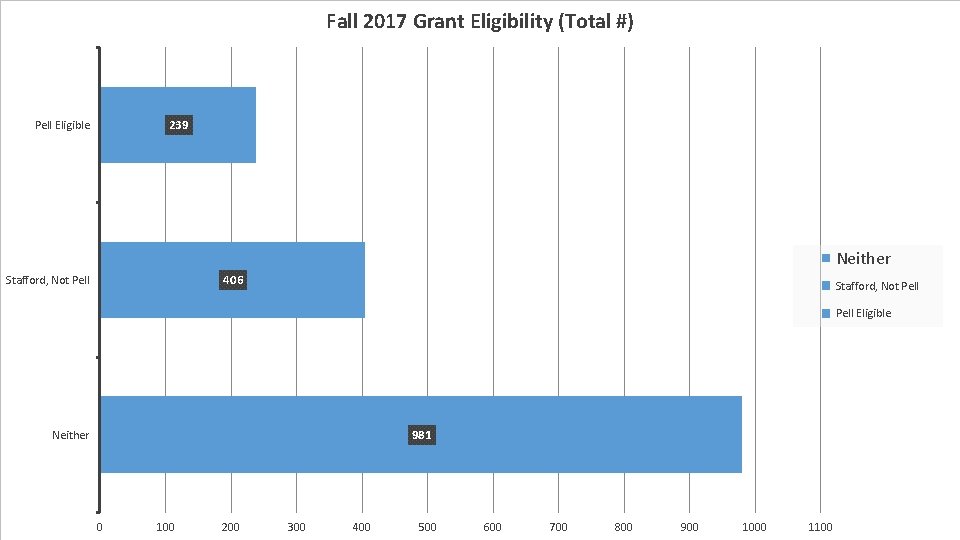
Fall 2017 Grant Eligibility (Total #) 239 Pell Eligible Neither 406 Stafford, Not Pell Eligible 981 Neither 0 100 200 300 400 500 600 700 800 900 1000 1100
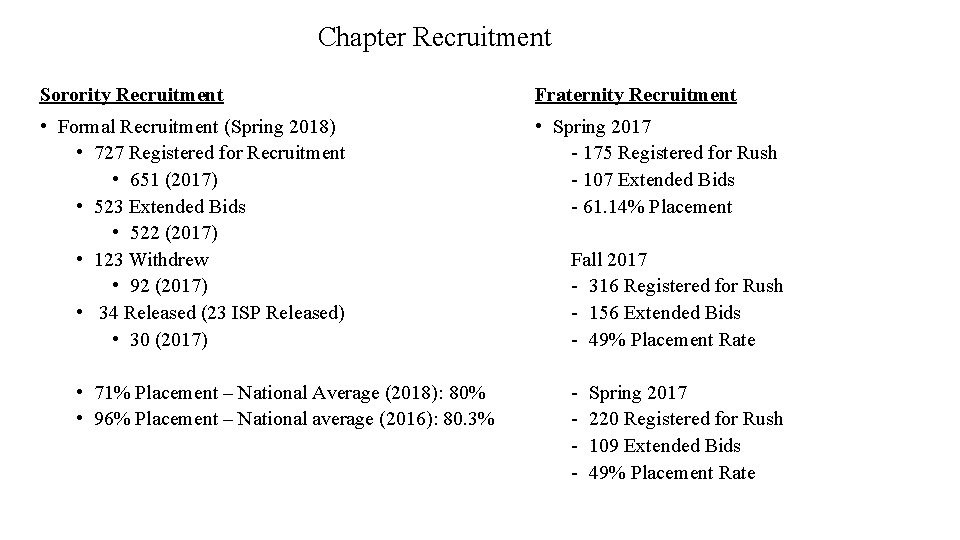
Chapter Recruitment Sorority Recruitment Fraternity Recruitment • Formal Recruitment (Spring 2018) • 727 Registered for Recruitment • 651 (2017) • 523 Extended Bids • 522 (2017) • 123 Withdrew • 92 (2017) • 34 Released (23 ISP Released) • 30 (2017) • Spring 2017 - 175 Registered for Rush - 107 Extended Bids - 61. 14% Placement • 71% Placement – National Average (2018): 80% • 96% Placement – National average (2016): 80. 3% Fall 2017 - 316 Registered for Rush - 156 Extended Bids - 49% Placement Rate - Spring 2017 220 Registered for Rush 109 Extended Bids 49% Placement Rate
Chapter Excellence Presentations (Fall 2017) • During December 2017 and January 2018, each chapter gave a 45 -60 minute presentation reviewing the 2017 calendar year. Outgoing executive boards delivered the presentations. • 10 different Chapman staff members helped evaluate the 16 presentations. Jaclyn and Sam attended every presentation. • Chapters were given a rubric in December and evaluated in four functional areas: • Organizational Development - Chapter Operations, Finance, Advisory Board, Connection with National Organization, Ritual, Conferences • Intellectual Development - Scholarship, Education • Membership Development - Chapter educational/leadership development programs, New Member Program, Recruitment, Officer Transition, Risk Management, Brotherhood & Sisterhood, Campus Involvement, Departmental Programs, Diversity Programs, Leadership in other organizations, Cosponsorship, etc. • Community Development - Philanthropy, Service, Alumni Relations, Standards • Chapters were asked to submit an Executive Summary and SWOT analysis with their presentation in addition to the required End of Semester Report in December
Chapter Excellence Presentations (Fall 2017) • Following the presentations Jaclyn met individually with all chapters and provided written feedback. • Chapter advisors, incoming and outgoing chapter leadership were invited • All 4 functional areas were discussed and strengths, weaknesses, and areas of improvement were identified • The Chapter Excellence presentations and submissions informed the chapter wide Greek awards presented by Order of Omega.
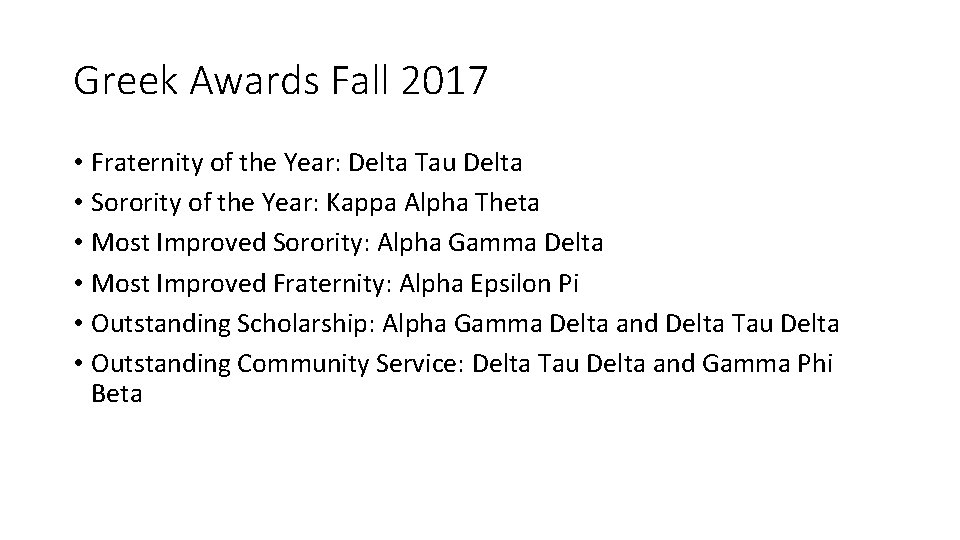
Greek Awards Fall 2017 • Fraternity of the Year: Delta Tau Delta • Sorority of the Year: Kappa Alpha Theta • Most Improved Sorority: Alpha Gamma Delta • Most Improved Fraternity: Alpha Epsilon Pi • Outstanding Scholarship: Alpha Gamma Delta and Delta Tau Delta • Outstanding Community Service: Delta Tau Delta and Gamma Phi Beta
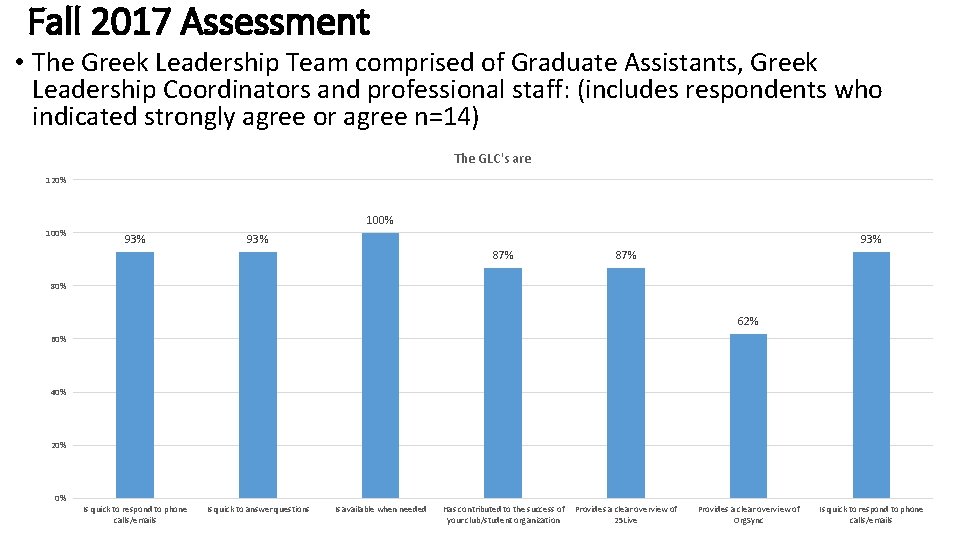
Fall 2017 Assessment • The Greek Leadership Team comprised of Graduate Assistants, Greek Leadership Coordinators and professional staff: (includes respondents who indicated strongly agree or agree n=14) The GLC's are 120% 100% 93% 93% 87% 80% 62% 60% 40% 20% 0% Is quick to respond to phone calls/emails Is quick to answer questions Is available when needed Has contributed to the success of your club/student organization Provides a clear overview of 25 Live Provides a clear overview of Org. Sync Is quick to respond to phone calls/emails
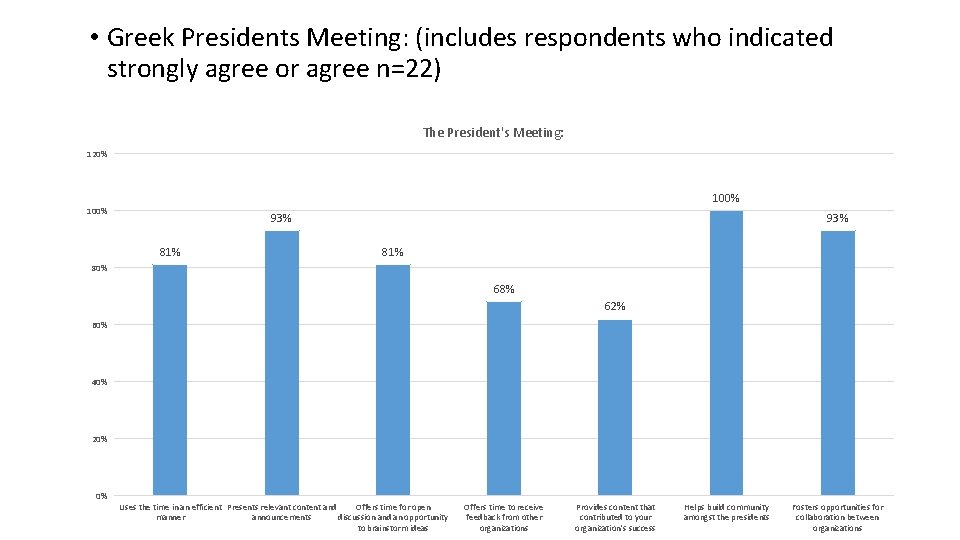
• Greek Presidents Meeting: (includes respondents who indicated strongly agree or agree n=22) The President's Meeting: 120% 100% 93% 81% 80% 68% 62% 60% 40% 20% 0% Uses the time in an efficient Presents relevant content and Offers time for open manner announcements discussion and an opportunity to brainstorm ideas Offers time to receive feedback from other organizations Provides content that contributed to your organization's success Helps build community amongst the presidents Fosters opportunities for collaboration between organizations
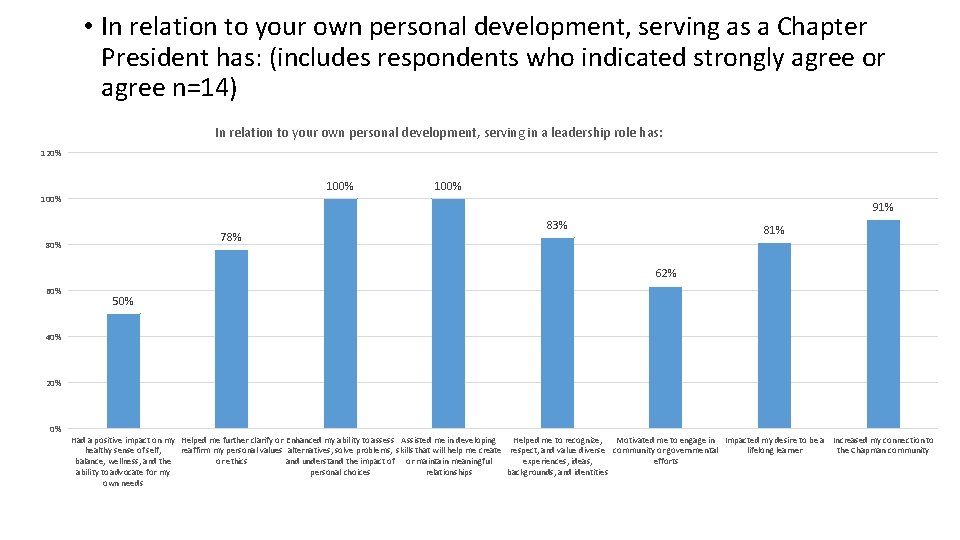
• In relation to your own personal development, serving as a Chapter President has: (includes respondents who indicated strongly agree or agree n=14) In relation to your own personal development, serving in a leadership role has: 120% 100% 91% 78% 80% 83% 81% 62% 60% 50% 40% 20% 0% Had a positive impact on my Helped me further clarify or Enhanced my ability to assess Assisted me in developing Helped me to recognize, Motivated me to engage in Impacted my desire to be a Increased my connection to healthy sense of self, reaffirm my personal values alternatives, solve problems, skills that will help me create respect, and value diverse community or governmental lifelong learner the Chapman community balance, wellness, and the or ethics and understand the impact of or maintain meaningful experiences, ideas, efforts ability to advocate for my personal choices relationships backgrounds, and identities own needs
Looking Ahead Ongoing Projects/Looking Ahead: • Community Relations • House parties • Neighbor relations • Assessment Projects • Greek Relationship Statement • Positive Public Relations • Greek Newsletter • Alumni Relations • Title IX • Academic Excellence Programming • Skyfactor Survey • Comparing data to previous year and continuing to utilize for assessment • AFLV Attendance • IFC and Panhellenic Conduct Processes/Chapman Conduct • On and Off Campus Event Data • Service and Philanthropy Data
- Slides: 31