Changing Landscape of Systemic Chemotherapy for Gastric Cancer


 : 717 -726.")

")


, years < 65 years, n (%) Male,")
 100 90 Patients, n Events, n Median")
![Attraction-2: Overall Survival by Subgroup Hazard Ratio [95% CI] All 0. 64 [0. 52–](https://slidetodoc.com/presentation_image/2c28df117489a27d11ad19f9db7176c1/image-17.jpg "Attraction-2: Overall Survival by Subgroup Hazard Ratio [95% CI] All 0. 64 [0. 52–")
 100 Patients, n 90 Median PFS")
![RECIST v 1. 1 Response and Disease Control ORR, n (%) [95% CI] P](https://slidetodoc.com/presentation_image/2c28df117489a27d11ad19f9db7176c1/image-19.jpg "RECIST v 1. 1 Response and Disease Control ORR, n (%) [95% CI] P")

 Patients, n (%) AEs")
 Patients, n (%) Any")


")
 100 POSITIVE")


and RR (%) 120 R 2=0. 8179 80 RR L K")
 PRKDC Transversion high (TH)")

 • • • Four subtypes")
-")
 • • • Four subtypes")
 7 7")


induces mution in MMR(mismatch")
![Attraction-2: Overall Survival by Subgroup Hazard Ratio [95% CI] All 0. 64 [0. 52–](https://slidetodoc.com/presentation_image/2c28df117489a27d11ad19f9db7176c1/image-47.jpg "Attraction-2: Overall Survival by Subgroup Hazard Ratio [95% CI] All 0. 64 [0. 52–")


![<KEYNOTE-024> PFS(primary) (%) 100 pembrolizumab chemotherapy 80 PFS[95%CI]*1,Months PFS rate at 1 year [](https://slidetodoc.com/presentation_image/2c28df117489a27d11ad19f9db7176c1/image-50.jpg "<KEYNOTE-024> PFS(primary) (%) 100 pembrolizumab chemotherapy 80 PFS[95%CI]*1,Months PFS rate at 1 year [")
![<KEYNOTE-024> OS(secondary) pembrolizumab (154) NR[-,-] chemotherapy (151) NR[9. 4,-] 69. 9[61. 1,77. 0] 54.](https://slidetodoc.com/presentation_image/2c28df117489a27d11ad19f9db7176c1/image-51.jpg "<KEYNOTE-024> OS(secondary) pembrolizumab (154) NR[-,-] chemotherapy (151) NR[9. 4,-] 69. 9[61. 1,77. 0] 54.")


 • Advanced or reccurent • Her 2 negative • PD-L 1 evaluable")
、N 3、M 0、stage IIIc,")
")


- Slides: 65
Changing Landscape of Systemic Chemotherapy for Gastric Cancer : the Role of immune check point inhibitors Taroh Satoh MD Ph. D Osaka University Graduate School of Medicine
COI Disclosure Taroh Satoh MD, Ph. D In connection with the presentation, I disclose COI with the following companies/organizations. , ①A position of a board member or advisor : Takara Bio, Inc. ②Stock holdings: No ③Patent royalties: No ④Honoraria for lectures:Yakult Honsha, Chugai Pharmaceutical, Elli-Lilly, Merck – Serono, Takeda Pharmaceutical, Taiho Pharmaceutical, Ono Pharmaceutical, Bristol. Myers and Byer ⑤Honoraria for manuscripts:No ⑥Total clinical research grants:Ono pharmaceutical, Elli-Lilly, Chugai Pharmaceutical, MSD, Daiichi-Sankyo, Giliad Sci, Bristol-Myers and Sanofi-Aventis ⑦Receiving travel expenses or gifts: No ⑧Donated Department: Yakult Honsha, Chugai Pharmaceutical and Ono. Pharmaceutical
Development status of Check point inhibitors -Melanoma・Lung・Gastrointestinal- nivolumab ipilimumab Nivo/Ipi pembrolizumab ● ● P 2 ● NSCLC ● P 3 ● SCLC P 3 atezolizumab Dulvalumab/Trimelu mab avellumab P 3 positive P 3 P 1 P 2 P 3 Skin cancer Melanoma lung cancer P 3 Gastorointestinal cancer Esophageal P 3 EGJ P 3 Gastric P 3 positive P 3 P 3 Colorectal P 2 Liver P 3 Billiary P 1 P 2
Muro K. et al. The Lancet Oncology. 2016 ; 17(6) : 717 -726.
Slide 1 Presented By Yoon-Koo Kang at 2017 Gastrointestinal Cancers Symposium
Backgrounds: Attraction-2 • Prognosis for patients with advanced gastric or gastroesophageal junction cancer (AGC) is poor despite established first-and second line chemotherapy regimens 1 -3, therefore novel treatment regimens are needed • AGCs are characterized by high mutational burden and amplification of immune checkpoint inhibitory proteins such as programmed death 1 ligand (PD-L 1), 4 -6 suggesting that they may be responsive to immunotherapies that target programmed death-1(PD-1) • Nivolumab is a fully human Ig. G 4 monoclonal antibody that targets PD-1, which demonstrated improvement of survival in several advanced tumor types 7, 8 • Phase 1/2 studies with immune check point inhibitors including nivolumab, have suggested activity in gastric cancer, however, efficacy has not been established in randomized controlled study 9, 10 JGCA 2017
Attraction-2: Study Design and Endpoints Key eligibility criteria: • Age ≥ 20 years • Unresectable advanced or recurrent gastric or gastroesophageal junction cancer • Histologically confirmed adenocarcinoma • Prior treatment with ≥ 2 regimens and refractory to/intolerant of standard therapy • ECOG PS of 0 or 1 • Nivolumab 3 mg/kg IV Q 2 W R 2: 1 Stratification based on: • Country (Japan vs Korea vs Taiwan) • ECOG PS (0 vs 1) • Number of organs with metastases (< 2 vs ≥ 2) Placebo Primary endpoint: • OS Secondary endpoints: • Efficacy (PFS, BOR, ORR, TTR, DOR, DCR) • Safety Exploratory endpoint: • Biomarkers Patients were permitted to continue treatment beyond initial RECIST v 1. 1–defined disease progression, as assessed by the investigator, if receiving clinical benefit and tolerating study drug BOR, best overall response; DCR, disease control rate; DOR, duration of response; ECOG PS, Eastern Cooperative Oncology Group performance status; IV; intravenous; ORR, objective response rate; OS, overall survival; PFS, progression-free survival; Q 2 W, every 2 weeks; R, randomization; RECIST, Response Evaluation Criteria In Solid Tumors; TTR, time to tumor response. JGCA 2017
<1 st line> 2014 HER 2 negative AGC <2 nd line> <3 rd line> Recommendation 1 S-1 + CDDP Recommendation 2 Capecitabine + CDDP HER 2 positive AGC Recommendation 1 Cape + CDDP + Trastuzumab Recommendation 2 weekly Paclitaxel Docetaxel Irinotecan Another drug other than nd 2 line drug T Recommendation 2 S-1 + CDDP + Trastuzumab JGCA 2017 From Japanese Gastric Cancer Association (JGCA): Japanese gastric cancer treatment guideline ver. 4 & updates on the JGCA HP
<1 st line> 2015 HER 2 negative AGC <2 nd line> Recommendation 1 S-1 + CDDP Recommendation 2 Capecitabine + CDDP Capecitabine + Oxaliplatin S-1 + Oxaliplatin Recommendation 1 Ramucirumab + weekly Paclitaxel HER 2 positive AGC Recommendation 2 Recommendation 1 weekly Paclitaxel Docetaxel Irinotecan Ramucirumab mono Cape + CDDP + Trastuzumab Recommendation 2 <3 rd line> Another drug other than nd 2 line drug T S-1 + CDDP + Trastuzumab JGCA 2017 From Japanese Gastric Cancer Association (JGCA): Japanese gastric cancer treatment guideline ver. 4 & updates on the JGCA HP
Statistical Assumptions and Study Conduct • Primary endpoint: OS – Expected median OS: 6. 15 months with nivolumab vs 4 months with placebo (hazard ratio, 0. 65) • 18 months of accrual and 12 months of follow-up (after randomization of last patient) • 90% powered, 1 -sided significance level of 2. 5% – Planned total to ensure 261 events: N = 290 • Interim analysis – Planned to determine the need to stop the study early for futility or re-estimation of the required number of OS events based on the conditional power – Performed (blinded to investigators) when 196 of 261 required events occurred • • – The independent data monitoring committee determined that the sample size should be re-estimated to 328 OS events based on the interim data A total of 493 patients were randomized from 49 centers in 3 countries between November 2014 and February 2016 Data cut-off for final analysis with 366 events: August 2016 JGCA 2017
Characteristic Attraction-2: Baseline Characteristics Median age (range), years < 65 years, n (%) Male, n (%) Country, n (%) Japan Korea Taiwan ECOG PS, n (%) 0 1 Primary site of disease, n (%) Gastric Gastroesophageal junction Unknown Prior gastrectomy, n (%) No Yes Organs with metastases (≥ 2), n (%) Prior treatment regimens, n (%) 2 3 ≥ 4 Any prior therapy, n (%) Fluoropyrimidine Platinum Taxane Irinotecan Ramucirumab JGCA 2017 Nivolumab 3 mg/kg (n = 330) 62 (20– 83) 189 (57. 3) 229 (69. 4) 152 (46. 1) 146 (44. 2) 32 ( 9. 7) 95 ( 28. 8) 235 ( 71. 2) Placebo (n = 163) 61 (26– 83) 95 (58. 3) 119 (73. 0) 74 (45. 4) 15 ( 9. 2) 48 ( 29. 4) 115 ( 70. 6) 272 (82. 4) 30 ( 9. 1) 28 ( 8. 5) 135 (82. 8) 12 ( 7. 4) 16 ( 9. 8) 133 (40. 3) 197 (59. 7) 246 (74. 5) 69 (20. 9) 137 (41. 5) 124 (37. 6) 330 (100) 329 (99. 7) 311 (94. 2) 284 (86. 1) 247 (74. 8) 35 (10. 6) 58 (35. 6) 105 (64. 4) 119 (73. 0) 29 (17. 8) 62 (38. 0) 72 (44. 2) 163 (100) 157 (96. 3) 140 (85. 9) 123 (75. 5) 22 (13. 5)
Attraction-2: Overall Survival Probability of Survival (%) 100 90 Patients, n Events, n Median OS [95% CI], months 12 -Month OS Rate [95% CI], % 80 Nivolumab 330 225 5. 32 [4. 63– 6. 41] 26. 6 [21. 1– 32. 4] 70 Placebo 163 141 4. 14 [3. 42– 4. 86] 10. 9 [6. 2– 17. 0] 60 50 Hazard ratio, 0. 63 (95% CI, 0. 50– 0. 78) P < 0. 0001 40 30 20 10 0 0 2 4 6 8 10 12 14 16 18 20 22 Time (months) At risk: Nivolumab 330 275 193 142 95 57 39 19 10 5 3 0 Placebo 163 121 82 53 32 16 10 4 3 3 1 0 JGCA 2017
Attraction-2: Overall Survival by Subgroup Hazard Ratio [95% CI] All 0. 64 [0. 52– 0. 80] Country Japan Korea Taiwan Subgroup Hazard Ratio [95% CI] 0. 63 [0. 46– 0. 85] 0. 70 [0. 51– 0. 96] 0. 46 [0. 23– 0. 92] Histological type (Lauren classification) Intestinal type Diffuse type Mixed Unknown 0. 59 [0. 41– 0. 85] 0. 82 [0. 57– 1. 17] 0. 37 [0. 13– 1. 04] 0. 56 [0. 37– 0. 84] Age, years < 65 ≥ 65 0. 75 [0. 57– 0. 98] 0. 53 [0. 38– 0. 74] Number of organs with metastasis <2 ≥ 2 0. 70 [0. 46– 1. 08] 0. 61 [0. 48– 0. 78] Sex Male Female 0. 58 [0. 45– 0. 75] 0. 83 [0. 56– 1. 23] Peritoneal metastasis No Yes 0. 63 [0. 50– 0. 81] 0. 74 [0. 48– 1. 15] ECOG PS 0 1 0. 59 [0. 40– 0. 87] 0. 67 [0. 52– 0. 86] Liver metastasis No Yes 0. 63 [0. 50– 0. 80] 0. 67 [0. 42– 1. 07] Prior gastrectomy No Yes 0. 69 [0. 49– 0. 98] 0. 60 [0. 46– 0. 79] Measurable lesion No Yes 0. 70 [0. 43– 1. 14] 0. 63 [0. 50– 0. 80] Primary sites Gastric (fundus, corpus, antrum, and pylorus) Gastroesophageal junction Unknown 0. 69 [0. 55– 0. 87] 0. 44 [0. 20– 0. 97] 0. 52 [0. 26– 1. 06] Number of previous regimens 2 3 ≥ 4 0. 82 [0. 50– 1. 35] 0. 87 [0. 61– 1. 22] 0. 44 [0. 31– 0. 61] 0 1 2 Favors nivolumab Favors placebo Hazard ratio [95% CI] JGCA 2017 3 0 1 2 Favors nivolumab Favors placebo Hazard ratio [95% CI] 3
Attraction-2: Progression-Free Survival Probability of Progression-Free Survival (%) 100 Patients, n 90 Median PFS 12 -Month PFS Rate Progression-Free Survival Events, n Median [95% CI], months [95% CI], % 80 Nivolumab 330 253 70 Placebo 163 145 60 1. 61 months 7. 6 [4. 2– 12. 2] Nivolumab 1. 61 [1. 54– 2. 30] 1. 45 months 1. 5 [0. 3– 4. 8] Placebo 1. 45 [1. 45– 1. 54] Hazard ratio, 0. 60 (95% CI, 0. 49– 0. 75) P < 0. 0001 50 40 30 20 10 0 0 2 4 6 8 10 12 14 16 18 20 Time (months) At risk: Nivolumab 330 131 83 46 31 19 8 4 2 0 0 Placebo 163 41 17 9 7 4 2 2 1 1 0 JGCA 2017
RECIST v 1. 1 Response and Disease Control ORR, n (%) [95% CI] P value BOR, n (%) Complete response Partial response Stable disease Progressive disease DCR, n (%) [95% CI] P value Median TTR (range), months Median DOR, months [95% CI] JGCA 2017 Nivolumab 3 mg/kg (n = 268) 30 (11. 2) [7. 7– 15. 6] < 0. 0001 Placebo (n = 131) 0 [0– 2. 8] — 0 30 (11. 2) 78 (29. 1) 124 (46. 3) 108 (40. 3) [34. 4– 46. 4] 0. 0036 0 0 33 (25. 2) 79 (60. 3) 33 (25. 2) [18. 0– 33. 5] — 1. 61 (1. 4– 7. 0) — 9. 53 [6. 14– 9. 82] —
Maximum Reduction in Tumor Burden From Baseline Maximum Reduction From Baseline in Target Lesions (%) 100 a Nivolumab 100 80 80 60 60 40 40 20 20 0 0 -20 -40 -60 37. 3% -80 -100 a Patients with a change in tumor burden that exceeds 100%. JGCA 2017 a Placebo 12. 4%
Attraction-2: Adverse Event Summary Nivolumab 3 mg/kg (n = 330) Patients, n (%) AEs Any Serious AEs leading to discontinuation AEs leading to dose delay AEs leading to death TRAEs Any Serious TRAEs leading to discontinuation TRAEs leading to dose delay TRAEs leading to death AE, adverse event; TRAE, treatment-related adverse event. JGCA 2017 Placebo (n = 161) Any Grade 3/4 300 (90. 9) 131 (39. 7) 23 ( 7. 0) 63 (19. 1) 137 (41. 5) 91 (27. 6) 13 ( 3. 9) 40 (12. 1) 135 (83. 9) 75 (46. 6) 12 ( 7. 5) 27 (16. 8) 63 (39. 1) 47 (29. 2) 9 ( 5. 6) 17 (10. 6) 35 (10. 6) 141 (42. 7) 33 (10. 0) 9 ( 2. 7) 25 ( 7. 6) 34 (10. 3) 21 ( 6. 4) 4 ( 1. 2) 14 ( 4. 2) 5 (1. 5) 25 (15. 5) 43 (26. 7) 8 ( 5. 0) 4 ( 2. 5) 2 ( 1. 2) 7 (4. 3) 4 (2. 5) 3 (1. 9) 1 (0. 6) 2 (1. 2)
Attraction-2: Treatment-Related Adverse Events Nivolumab 3 mg/kg (n = 330) Patients, n (%) Any TRAEs in > 2% of patients treated with nivolumab Pruritus Diarrhea Rash Fatigue Decreased appetite Nausea Malaise AST increased Hypothyroidism Pyrexia ALT increased ALT, alanine aminotransferase; AST, aspartate aminotransferase. JGCA 2017 Placebo (n = 161) Any Grade 141 (42. 7) Grade 3/4 34 (10. 3) Any Grade 43 (26. 7) Grade 3/4 7 (4. 3) 30 (9. 1) 23 (7. 0) 19 (5. 8) 18 (5. 5) 16 (4. 8) 14 (4. 2) 13 (3. 9) 11 (3. 3) 10 (3. 0) 8 (2. 4) 7 (2. 1) 0 2 (0. 6) 4 (1. 2) 0 0 2 (0. 6) 0 1 (0. 3) 9 (5. 6) 3 (1. 9) 5 (3. 1) 9 (5. 6) 7 (4. 3) 4 (2. 5) 6 (3. 7) 3 (1. 9) 1 (0. 6) 0 0 0 2 (1. 2) 1 (0. 6) 0 0 0
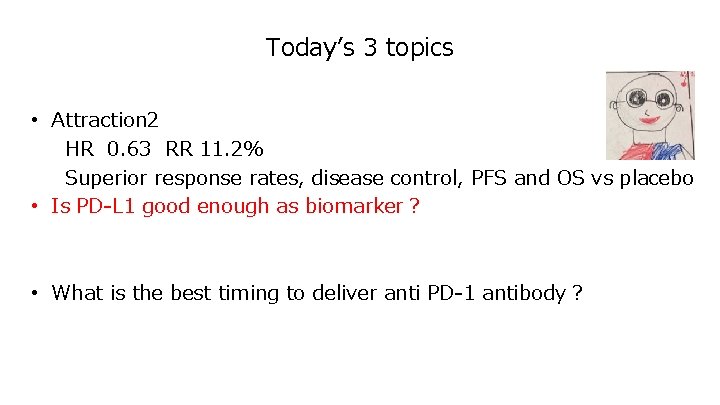
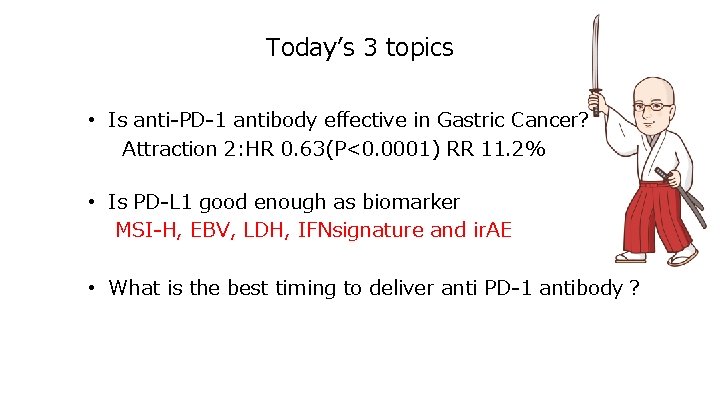
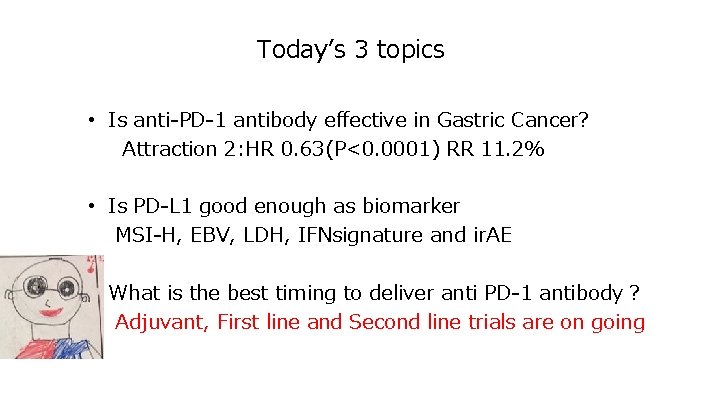
Attraction-2: Conclusions • This phase 3 study demonstrated the efficacy and safety of nivolumab as a third or later line of treatment in patients with AGC – Superior OS vs placebo, with long-term survival – Superior response rates, disease control, and PFS vs placebo – Nivolumab was well tolerated with a safety profile comparable to the placebo arm • Biomarker analysis is under investigation • These results indicate that nivolumab could be a new treatment option for patients with heavily pretreated AGC and also provide a strong rationale to explore nivolumab in earlier lines of treatment for AGC JGCA 2017
<1 st line> 2017 HER 2 negative AGC <2 nd line> Recommendation 1 S-1 + CDDP Recommendation 2 Capecitabine + CDDP Capecitabine + Oxaliplatin S-1 + Oxaliplatin HER 2 positive AGC Recommendation 1 Cape + CDDP + Trastuzumab Recommendation 2 S-1 + CDDP + Trastuzumab JGCA 2017 <3 rd line> Recommendation 1 Ramucirumab + weekly Paclitaxel Nivolumab Recommendation 2 weekly Paclitaxel weekly nabpaclitaxel Docetaxel Irinotecan Ramucirumab mono (level 1 a) Irinotecan From Japanese Gastric Cancer Association (JGCA): Japanese gastric cancer treatment guideline ver. 4 & updates on the JGCA HP
PD-L 1 expression frequency 癌種 Melanoma NSCLC Head and Neck Glioma/Glioblastoma Colorectal Liver Bladder Multiple Myeloma Ovarium % PD-L 1+ 40 -100 35 -95 68 -100 53 45 -93 28 -100 93 33 -80 References Wang and colleagues (42) Hino and colleagues (43) Dong and colleagues (44) Wang and colleagues (42) Dong and colleagues (44) Konishi and colleagues (45) Yang and colleagues (17) Hsu and colleagues (46) Wintterle and colleagues (47) Dong and colleagues (44) Wang and colleagues (48) Gao and colleagues (49) Zeng and colleagues (50) Nakanishi and colleagues (51) Inman and colleagues (52) Liu and colleagues (53) Dong and colleagues (44) Hamanishi and colleagues (54) Bron and colleagues (55) Stomach Esophagus Pancreas 42 42 39 Renal Cell 15 -24 Wang and colleagues (42) Krambeck and colleagues (59) Thompson and colleagues (60) Breast 31 -34 Dijkers and colleagues (30) Ghebeh and colleagues (61) Lymphoma 17 -94 a Xerri and colleagues (62) Wilcox and colleagues (63) Leulemia 11 -42 a末梢性T細胞リンパ腫、びまん性大細胞型リンパ腫、小リンパ球性リンパ腫を含む Wu and colleagues (56) Ohigashi and colleagues (57) Nomi and colleagues (58) Tamura and colleagues (64) Berthon and colleagues (65) Kozako and colleagues (66) Chen and colleagues (67) Chen DS et al. Clin Cancer Res 2012; 18: 6580 -6587
KEYNOTE-010:corelation between PD-L 1 expresiion and RR KEYNOTE-010:Pembro vs docetaxel in 2 nd line NSCLC • Response rate based on PD-L 1 status 50 45 RR, % (95% CI) 40 Docetaxel 0. 01 35 0. 14 30 25 < 0. 00001 Pembrolizumab 0. 76 20 18% 15 10 9% 5 0 TPS 1 -24% TPS 25 -49% TPS 50 -74% TPS 75 -100% Presented at the American Society of Clinical Oncology (ASCO) Annual Meeting June 3 -7, 2016 Chicago, Illinois
Respone Rate based on PD-L 1 expression KEYNOTE-006 RECIST 1. 1 Pembrolizumab Ilpilimumab (%) 60 Median follow up: 7. 9 M Response Rate 50 40 37. 4% (167/446) 30 20 12. 4% (28/225) 10 17. 5% (18/103) 10. 6% (5/47) 0 PD-L 1 Positeve PD-L 1 negative KEYNOTE-006
PFS based on PDL-1 status KEYNOTE-006 RECIST 1. 1 PD-L 1 (%) 100 POSITIVE 90 90 80 80 50. 8% 70 PFS 60 50 PFS 40 30 30 20 10 20 ipilimumab 0 2 4 Median f/u: 7. 9 M ipilimumab 0 6 8 10 12 14 Month At risk 27. 2% 10 Median f/u: 7. 9 M 0 33. 2%Pembro 50 40 25. 6% Negative 70 Pembro+ 60 PD-L 1 (%) 100 pembro 446 376 237 164 86 11 2 0 ipi 225 151 73 34 14 2 0 0 PFS 6 MPFSrate HR (95%CI) P value* pembrolizumab 6. 4 M 50. 8% 0. 53 (0. 43, 0. 65) < 0. 00001 ipilimumab 2. 8 M 25. 6% - *log rank 0 At risk pembro 103 Ipili, umab 47 投与群 2 4 84 42 32 12 6 8 10 12 14 29 16 3 1 0 6 3 0 0 0 month PFS中央値 6 MPFSrate HR (95%CI) P value* 0. 07163 Pembrolizumab 2. 8 M 33. 2% 0. 73 (0. 47, 1. 11) Ipili, umab 2. 8 M 27. 2% - *Log rank (KEYNOTE-006試験)
Check. Mate-649 • multiinstitutional、randomized、non- blinded、phase. III • Advanced or reccurent • PD-L 1 evaluable • • PS 0/1 • 18 yrs or older • Adequate organ function N=1266 Nivolumab + Ipilimumab R Nivolumab + XELOX/FOLFOX 1: 1: 1 XELOX/FOLFOX Primary Endpoint 1:OS(PD-L 1 positive pts Nivo+Ipi vs 5 -FU/L-OHP) Primary Endpoint 2:OS( PD-L 1 positive pts Nivo+5 -FU/L-OHP vs 5 -FU/L-OHP) Secondary Endpoints:OS(all pts)、PFS、Time to Symptom Deterioration Recruitment period: 2016年 10月4日~ 2020年 10月11日 Country and Institution: 26 countries、149 hospitals NCT 02872116
KEYNOTE-061 • multiinstitutional、randomized、non- blinded、phase. III • Advanced or reccurent progressed 5 FU+platinum • PD-L 1 evaluable • • PS 0/1 • 18 yrs or older • Adequate organ function • Measurable region Primary endpoint:PD-L 1 positive PFS、OS(adoptive design) Secondary endpoints:PFS、OS( all pts) PD-L 1 and all pts PFS、TTP、ORR、DOR、safety、torelance exproratory:QOL(EORTC QLQ-C 30、EORTC QLQ-STO 22)、(Euro. Qo. L EQ-5 D) Recruitment period: 2015年 6月~ 2019年 3月 US, Japan他 NCT 02370498、Japic. CTI-152988 N=720 pembrolizumab 200 ㎎, q 3 w (day 1) R 1: 1 1. region 2. PFS in 1 st line 3. PD-L 1 status paclitaxel 80 mg/m 2, q 1 w (day 1, 8, 15)
Heterogeneity of PD-L 1 expression in Lung cancer • Heterogeneity of PD-L 1 expression stained by traminobensine SP 142 ab PD-L 1 negative E 1 L 3 Nab 100μm PD-L 1 positive 100μm 1 mm JAMA Oncol. 2016; 2(1): 46 -54.
Asssociation between PD-L 1 expression and OS in Gastric Cancer Study or Subgroup Christine 2016 Eto 2016 Geng 2015 Hou 2014 Kim 2016 Qing 2015 Tamura 2015 Wang 2015 Wu 2006 Zhang 2015 log(Hazard ratio) SE Weight Hazard Ratio IV.Random、95%CI -0. 2877 1. 1909 0. 5008 0. 2624 -0. 462 0. 8242 0. 8502 0. 6575 1. 0296 0. 9969 0. 1311 0. 6446 0. 1978 0. 4118 0. 2855 0. 3067 0. 1845 0. 2777 0. 5004 0. 337 12. 8% 5. 6% 12. 0% 8. 6% 10. 3% 12. 1% 10. 8% 7. 4% 9. 8% 0. 75 [ 0. 58, 0. 97] 3. 29 [ 0. 93, 11. 64] 1. 65 [ 1. 12, 2. 43] 1. 30 [ 0. 58, 2. 91] 0. 63 [ 0. 36, 1. 10] 2. 28 [ 1. 25, 4. 16] 2. 34 [ 1. 63, 3. 36] 1. 93 [ 1. 12, 3. 33] 2. 80 [ 1. 05, 7. 47] 2. 71 [ 1. 40, 5. 25] 100. 0% 1. 64 [ 1. 11, 2. 43] 合計(95%CI) Heterogeneity: Tau 2=0. 30, Chi 2=50. 04, df=9 (P< 0. 00001); I 2=82% Hazard Ratio IV.Random、95%CI 0. 01 Total for overall effect: Z=2. 47 (p=0. 01) 0. 1 PD-L 1 positive 1 10 PD-L 1 negative 100 (A)Percentage(cut off value 10%) 、(B) Percentage(cut off value 51%) A Study or Subgroup Hou 2014 Qing 2015 Wang 2015 log(Hazard ratio) SE Weight Hazard Ratio IV.Fixed、95%CI 0. 2624 0. 8242 0. 6575 0. 4118 0. 3067 0. 2777 20. 0% 36. 0% 44. 0% 1. 30 [ 0. 58, 2. 91] 2. 28 [ 1. 25, 4. 16] 1. 93 [ 1. 12, 3. 33] 100. 0% 1. 89 [ 1. 32, 2. 72] Total (95% CI) Heterogeneity : Chi 2=1. 21, df=2 (P=0. 55); I 2=0% Total for overall effect : Z=3. 47 (P=0. 0005) B Study or Subgroup Eto 2016 Tamura 2015 0. 01 l log(Hazard ratio) SE Weight Hazard Ratio IV.Fixed、95%CI 1. 1909 0. 8502 0. 6446 0. 1845 7. 6% 92. 4% 3. 29 [ 0. 93, 11. 64] 2. 34 [ 1. 63, 3. 36] 100. 0% 2. 40 [ 1. 70, 3. 40] Total (95% CI) Heterogeneity : Chi 2=0. 26, df=1 (p=0. 61); I 2=0% Total for overall effect : Z=4. 94 (p< 0. 00001) Hazard Ratio IV.Fixed、95%CI 0. 1 1 PD-L 1 positive 10 PD-L 1 negative 100 Hazard Ratio IV.Fixed、95%CI 0. 01 0. 1 1 PD-L 1 positive 10 PD-L 1 negative 100 Zhang M et al. Sci. Rep. 6, 37933 (2016)
ma ore C cta l gea l ad eno a lan om Me Lun g Sq dde r Bla c Ga stri pha Eso Col HN CLL Neu Low g r rob last ade om a Bre ast Pan cre Mu atic ltipl e M yelo m Kid a ney Cle a Kid r ney Pa pilla ry Ova r ian Glio bla sto ma Diff Cer use vica Bc l ell L ym pho ma om a Pro sta te id sto cino last Neu lob Car dul lob la Me roid AM L Thy ma id rco Sa bdo Lha ing Ew • Frequency of Somatic Mutation(/Mb) Gastric cancer has higher mutational burden Frequency of mutation from 3, 083 pairs of tumor-normal tissue exome Nature. 2013 Jul 11; 499(7457): 214– 218.
Mutation Burden(number and frequency)and RR (%) 120 R 2=0. 8179 80 RR L K 100 J 60 I 40 H G E 20 F C D A 0 1 10 B 100 1, 000 100, 000 Mutations per genome Presented By Dung Le at 2016 ASCO Annual Meeting
Mutation burden and PFS DCB NDB RAD 17 (stop gain) PRKDC Transversion high (TH) Transversion low (TL) POLE 4 LIG 3 (stop gain) POLD 1 1, 000 RAD 51 C 1, 500 NR deletion、frame shift mutation Synonymous mutation Nonsynonymous mutation POLE PRKDC MSH 2 エキソン変異の総数 POLD 1 BRCA 2 -Pembrolizumab in lung cancer- 500 Anti-PD-1 antibody might be effective in Gastric 0 試験ID 1 2 3 4 5 6 7 8 9 10 11 12 13 14 15 16 17 18 19 20 21 22 23 24 25 26 27 28 29 30 31 32 33 コホート V D D V V V D D D V V V D V D 34 D Cancer with higher frequency of somatic mutations. 奏効 PR PR PD SD PR PR PR SD PD PD PR PR PR SD SD PD PD PD SD SD PR SD PD PD SD PFS (月) 8 14 2 8 14 16 2 4 15 13 4 8 2 4 8 3 3 10 27 10 8 7 2 2 1 2 2 4 6 8 4 2 2 6 ++ ++ ++ TH TL TH TH TH TL TL TL TL 奏効持続 ++ ++ Smoking signature TH TH ++ Naiyer A. Rizvi et al. Science 2015; 348: 124 -128
Mutations per tumor Liquid tumor Mismatch repair proficient colon cancers Pediatric Tumors Melanoma and Lung Mismatch repair deficient colon cancers Sporadic Adult Solid Tumors (MSI-H) Mutagen Associated Tumors Mismatch repair tumors 0 500 1, 000 1, 500 2, 000 Mutations per tumor Presented By Dung Le at 2015 ASCO Annual Meeting
Classification of Gastric Cancer (TCGA: The Cancer Genome Atlas) • • • Four subtypes for Gastric Cancer。 Stratification and development for molecular targeting agents Frequency of MSI-H pts is 21. 7 %。 8. 8% 21. 7% 20. 0% 50. 0% The Cancer Genome Atlas Research Network. Nature 513, 202– 209 (2014)
Asian Classification Anti-PD-1 antibody might be effective in MSI-H (ACRG: Asian Cancer Research Group)- Gastric Cancer whiich is associated with higher frequency of somatic mutations. 22. 7% 15. 3% 26. 3% 35. 7% 1. The Cancer Genome Atlas Research Network. Nature 513, 202– 209 (2014) Cristescu R et al. Nat Med. 21, 449 -56 (2015)
Classification of Gastric Cancer (TCGA: The Cancer Genome Atlas) • • • Four subtypes for Gastric Cancer。 Stratification and development for molecular targeting agents Elevated PDL-1&PDL-2 is seen in EBV。 8. 8% 21. 7% 20. 0% 50. 0% The Cancer Genome Atlas Research Network. Nature 513, 202– 209
EBV type、 JAK 2/PD-L 1/PD-L 2 gene expression high frequency (log 2) 7 7 6 6 5 4 3 2 1 CIN EBV GS MSI PD-L 1/CD 274 PD-L 2 (log 2) /PDCD 1 LG 2 3. 5 m. RNA発現 (RNA Seq RPKM) JAK 2 m. RNA発現 (RNA Seq RPKM) (log 2) 5 4 3 2 3. 0 2. 5 2. 0 1. 5 1 1. 0 0 0. 5 CIN EBV GS MSI The Cancer Genome Atlas Research Network. Nature 513, 202– 209 (2014)
KEYNOTE-010:corelation between PD-L 1 expresiion and RR Higher response rate by check point inhibitors is KEYNOTE-010:Pembro vs docetaxel in 2 nd line NSCLC expected in EBV phenotype which is associated with • Response rate based on PD-L 1 status 50 45 RR, % (95% CI) 40 higher PDL-1/PDL-2 expression Docetaxel 0. 01 35 0. 14 30 25 < 0. 00001 Pembrolizumab 0. 76 20 18% 15 10 9% 5 0 TPS 1 -24% TPS 25 -49% TPS 50 -74% TPS 75 -100% Presented at the American Society of Clinical Oncology (ASCO) Annual Meeting June 3 -7, 2016 Chicago, Illinois
Possible Biomarker Candidate other than PD-L 1 • MSI-H • Virus infection; EBV • LDH • INFg • ir. AE
Somatic mutations increased in patients with prior TMZ • Temozolomide (TMZ)induces mution in MMR(mismatch repair), resulting in increased mutaional burden. 3, 000 2, 000 体 細 胞 変 異 数 Mutations in initial cases Mutations in both initial and reccurent Mutaions in reccurent cases 1, 000 300 250 200 150 Chemotherapy increases mutational burden 100 50 0 Pts No 24 02 28 12 04 13 26 15 09 27 16 29 08 25 07 06 11 17 21 01 05 18 10 Grade Ⅱ Ⅲ Ⅲ Ⅱ Ⅲ Ⅱ Ⅳ Ⅲ Ⅱ Ⅲ Ⅳ Ⅳ Ⅱ Ⅱ Ⅱ Ⅳ Ⅳ Ⅳ Prior TMZ before reccurencd Johnson BE et al. Science 343, 189 -193 (2014)
Attraction-2: Overall Survival by Subgroup Hazard Ratio [95% CI] All 0. 64 [0. 52– 0. 80] Country Japan Korea Taiwan Subgroup Hazard Ratio [95% CI] 0. 63 [0. 46– 0. 85] 0. 70 [0. 51– 0. 96] 0. 46 [0. 23– 0. 92] Histological type (Lauren classification) Intestinal type Diffuse type Mixed Unknown 0. 59 [0. 41– 0. 85] 0. 82 [0. 57– 1. 17] 0. 37 [0. 13– 1. 04] 0. 56 [0. 37– 0. 84] Age, years < 65 ≥ 65 0. 75 [0. 57– 0. 98] 0. 53 [0. 38– 0. 74] Number of organs with metastasis <2 ≥ 2 0. 70 [0. 46– 1. 08] 0. 61 [0. 48– 0. 78] Sex Male Female 0. 58 [0. 45– 0. 75] 0. 83 [0. 56– 1. 23] Peritoneal metastasis No Yes 0. 63 [0. 50– 0. 81] 0. 74 [0. 48– 1. 15] ECOG PS 0 1 0. 59 [0. 40– 0. 87] 0. 67 [0. 52– 0. 86] Liver metastasis No Yes 0. 63 [0. 50– 0. 80] 0. 67 [0. 42– 1. 07] Prior gastrectomy No Yes 0. 69 [0. 49– 0. 98] 0. 60 [0. 46– 0. 79] Measurable lesion No Yes 0. 70 [0. 43– 1. 14] 0. 63 [0. 50– 0. 80] Primary sites Gastric (fundus, corpus, antrum, and pylorus) Gastroesophageal junction Unknown 0. 69 [0. 55– 0. 87] 0. 44 [0. 20– 0. 97] 0. 52 [0. 26– 1. 06] Number of previous regimens 2 3 ≥ 4 0. 82 [0. 50– 1. 35] 0. 87 [0. 61– 1. 22] 0. 44 [0. 31– 0. 61] 0 1 2 Favors nivolumab Favors placebo Hazard ratio [95% CI] JGCA 2017 3 0 1 2 Favors nivolumab Favors placebo Hazard ratio [95% CI] 3
Clonal neoantigens in immune check point inhibitors Clonal neoantigen shown in patients with or without sustainable clinical response 600 Clonal neoantigen 500 Sublonal neoantigen 400 300 200 100 0 1. 0 0. 8 0. 6 0. 4 0. 2 0. 0 1 A(age) 2(APOBEC) 4(smoking) 5(unknown) 持続性の臨床的有用性あり With sustainable response VA 7859 BL 3403 AU 5884 NI 9507 SR 070761 LO 5004 LO 3793 GR 4788 WA 7899 RO 3338 JB 112852 R 7495 DM 123062 CU 9061 MA 7027 TU 0428 ZA 6505 Y 2087 SB 010944 AL 4602 RH 090935 RI 1933 SC 6470 M 4945 KA 3947 FR 9547 DI 6359 SC 0899 CA 9903 adenocarcinoma癌 NOS squamous cell HE 3202 PD-L 1 Signature others SA 9755 Neoantigen/tumor ネオアンチゲン/腫瘍 700 Prop Mut. Sigs • weak strong negative Unknouwn 持続性の臨床的有用性なし Without sustainable response Science. 2016 Mar 25; 351(6280): 1463 -9.
What is clonal and subclonal? Private E mutation Private Dmutation Shared B mutations clonarity tumor Private F mutation Subclonal Shared C mutation Truncal A mutation clonal Mutation Development Clin Cancer Res 2015; 21: 1258 -1266.
<KEYNOTE-024> PFS(primary) (%) 100 pembrolizumab chemotherapy 80 PFS[95%CI]*1,Months PFS rate at 1 year [ 95%CI]*1,% pembrolizumab (154) 10. 3[6. 7,-] chemotherapy (151) 6. 0[4. 2,6. 2] 47. 7[ 38. 5,56. 4] 15. 0[ 8. 6,23. 0] 0. 50[0. 37,0. 68] p< 0. 001 HR[95%CI]*2,p*3 47. 7% 60 PFS 40 20 0 Numbers at risk pembrolizumab chemotherapy 15. 0% PFS Kaplan-Meier(ITT) Median f/u 11. 2 M 0 3 6 154 151 104 99 89 70 9 12 15 44 18 22 9 3 1 PFS 18 (M) 1 0 Reck M et al. N Engl J Med 2016; 375: 1823 -1833
<KEYNOTE-024> OS(secondary) pembrolizumab (154) NR[-,-] chemotherapy (151) NR[9. 4,-] 69. 9[61. 1,77. 0] 54. 2[44. 9,62. 6] OSmedian[95%CI]*1,月 12 M survival rate [95%CI]*1,% (%) 100 0. 60[0. 41,0. 89] p=0. 005 HR [95%CI]*2 ,p*3 69. 9% 80 60 OS 40 54. 2% pembrolizumab chemotherapy 20 Median f/u 11. 2 M 0 Numbers at risk pembrolizumab chemotherapy OS Kaplan-Meier(ITT) 0 3 6 9 154 151 136 123 121 106 82 64 期間 12 15 18 39 34 11 7 2 1 21 (月) 0 0 Reck M et al. N Engl J Med 2016; 375: 1823 -1833
Check. Mate-649 • multiinstitutional、randomized、non- blinded、phase. III • Advanced or reccurent • Her 2 negative • PD-L 1 evaluable • • PS 0/1 • 18 yrs or older • Adequate organ function N=1266 R 1: 1: 1 Nivolumab + Ipilimumab Nivolumab + XELOX/FOLFOX Primary Endpoint 1:OS(PD-L 1 positive pts Nivo+Ipi vs 5 -FU/L-OHP) Primary Endpoint 2:OS( PD-L 1 positive pts Nivo+5 -FU/L-OHP vs 5 -FU/L-OHP) Secondary Endpoints:OS(all pts)、PFS、Time to Symptom Deterioration Recruitment period:Oct 2016~Oct 2020 Country and Institution: 26 countries、149 hospitals NCT 02872116
KEYNOTE-061 • multiinstitutional、randomized、non- blinded、phase. III • Advanced or reccurent progressed 5 FU+platinum • PD-L 1 evaluable • • PS 0/1 • 18 yrs or older • Adequate organ function • Measurable region Primary endpoint:PD-L 1 positive PFS、OS(adoptive design) Secondary endpoints:PFS、OS( all pts) PD-L 1 and all pts PFS、TTP、ORR、DOR、safety、torelance exproratory:QOL(EORTC QLQ-C 30、EORTC QLQ-STO 22)、(Euro. Qo. L EQ-5 D) Recruitment period: 2015年 6月~ 2019年 3月 US, Japan他 NCT 02370498、Japic. CTI-152988 N=720 pembrolizumab 200 ㎎, q 3 w (day 1) R 1: 1 1. region 2. PFS in 1 st line 3. PD-L 1 status paclitaxel 80 mg/m 2, q 1 w (day 1, 8, 15)
KEYNOTE-062 • Multi-institutional、randomized、non- blinded、phase. III • Advanced or reccurent • Her 2 /neu negative • PD-L 1 evaluable • Mesurable • • • PS 0/1 • 18 yrs or older • Adequate organ function Primary:PFS、OS Secondary:ORR July 2015~Jun 2020 30 countries 62 hospitals NCT 02494583 pembrolizumab 200 ㎎, q 3 w (day 1) N 50 7 = R 1: 1: 1 pembrolizumab 200 ㎎, q 3 w 5 -FU 800 mg/m 2, q 3 w (day 1 -5) pembrolizumab 200 ㎎, q 3 w or Capecitabine 1000 mg/m 2, q 3 w (day 1 -14) CDDP 80 mg/m 2, q 3 w placebo 5 -FU 800 mg/m 2, q 3 w (day 1 -5) CDDP 80 mg/m 2, q 3 w or Capecitabine 1000 mg/m 2, q 3 w (day 1 -14) CDDP 80 mg/m 2, q 3 w
ONO-4538 -37(PII/III) • Advanced or reccurent • Her 2 negative • PD-L 1 evaluable • PS 0/1 • 18 yrs or older • Adequate organ function Nivolumab + SOX N=30 R 1: 1 Nivolumab+ Xelox • Advanced or reccurent • Her 2 negative • PD-L 1 evaluable • PS 0/1 • 18 yrs or older • Adequate organ function N=680 Nivolumab + XELOX/SOX R 1: 1 XELOX/SOX
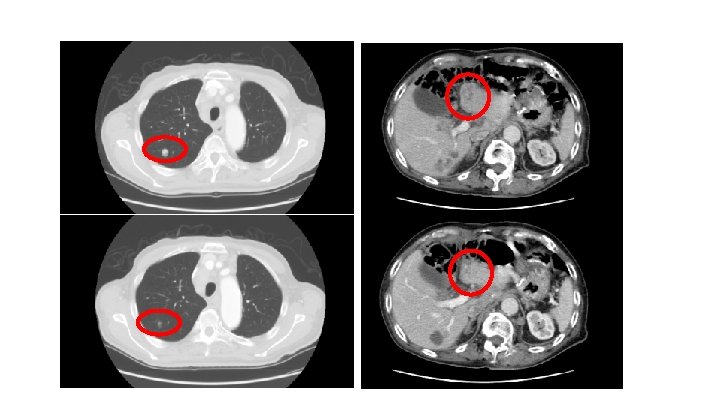
75 years old male 2011/7/11 Distal gastrectomy Type 2, T 4 a(SE)、N 3、M 0、stage IIIc, por 2>tub 2 Lauren classification: diffuse Her 2(3+) 2011/8/12 TS-1 for 5 onths 2012/1/30 liver metastasis 2012/2/17 CPT-11/CDDP 4 cycles 2012/10/3 weekly(3 on 1 off) TXL(80mg/m2)6 cycles 2013/4/23 Herceptin+XP(X 2000 mg/m 2, CDDP 80 mg/m 2) 4 cycles 2013/9/20 DTX(60 mg/m 2 triweekly)5 cycles TAI 5 cycles:CDDP 10 mg ADR 30 mg 5 -FU 2500mg 2014/6/20 nab. PTX (260 mg/m)7 cycles
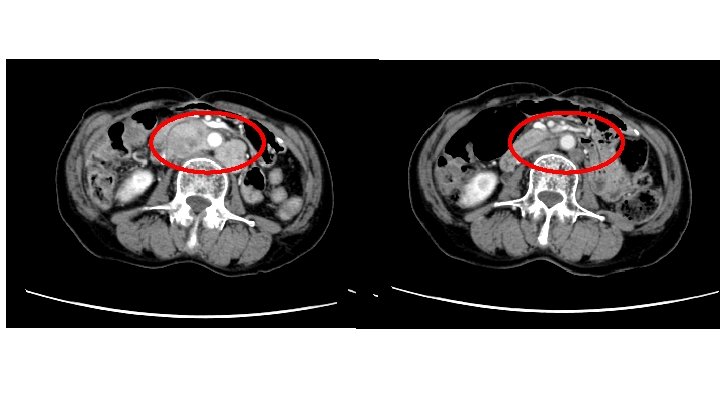
73 years old female 【Oct/17/2013 Gastric cancer (lung, liver and lymph node metastasis ) Stage IV: upper gastric corpus greater curvature type 2, tub 2 -por intestinal HER 2, IHC(0) negative Jan-2014 TS-1 (80 mg/m 2, day 1, 8, 15 and 22, 1 course = 6 -weeks) 2 -courses DTX (60 mg/m 2 day 1, 1 course = 3 -weeks )4 courses CPT-11(150 mg/m 2 day 1, 15, 1 course = 4 -weeks ) 4 -courses PD Dec-2014 XELOX (Cape: 2000 mg/m 2 day 1 -14, L-OHP 130 mg/m 2 day 1, 1 course=3 -weeks) 2 -course PD Mar 2015 Nivolumab
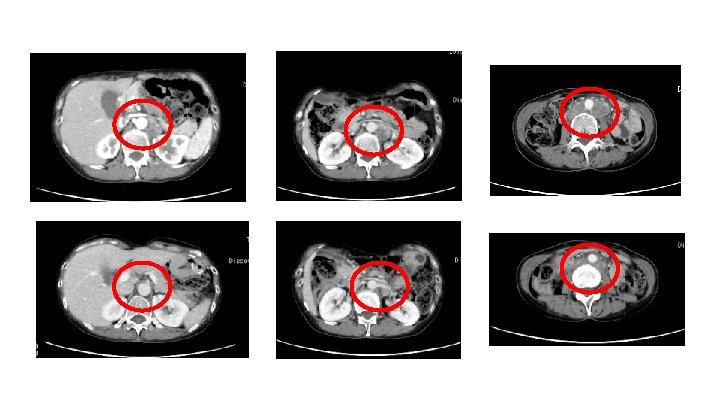
53 years old female 2012/12 Distal Gastrectomy。 p. T 3 N 3 b. M 1 P 0 H 0 CY 1, por, sci diffuse, Her 2 negative 2013/01/04 1 st S-1+CDDP(80 mg, 60 mg/m 2)4 cycles 2013/06/06 2 nd nab. PTX 260 mg/m 2, triweekly)16 cycles 2014/06/12 3 rd CPT-11(150 mg/m 2, biweekly)4 cycles 2014/08/14 4 th DS(S-1: 80 mg/m 2, 、DTX 40 mg/m 2, 3 weekly) 7 cycles 2015/01/30 5 th nivolumab
67 -years-old Male 16/JUN/2015 19/OCT/2015
Thank you for listening!