Change Detection Digital Change Detection Biophysical materials and

Change Detection

Digital Change Detection • Biophysical materials and human-made features are dynamic, changing rapidly. • It is believed that land-use/land-cover change is a major component of global change with an impact perhaps greater than that of climate change. • Significant effort has gone into the development of change detection methods using remotely sensed data.
")
Region of Interest • The dimensions of the change detection region of interest (ROI) must be carefully identified and held constant throughout a change detection project. • It must be completely covered by n dates of imagery. • Failure to do so result in change detection maps with data voids that are problematic when computing change statistics.
. •")
Time Period • Be careful to identify the optimal change detection time period(s). • Traffic transportation studies might require a change detection period of just a few seconds or minutes. • Images obtained monthly or seasonally might be sufficient to monitor the greening of a continent.

Remote Sensing System Considerations • Successful remote sensing change detection requires careful attention to: • remote sensor system considerations, and • environmental characteristics. • Ideally, the remotely sensed data used to perform change detection is acquired by a remote sensor system that holds the following resolutions constant: temporal, spatial (and look angle), spectral, and radiometric.

System Parameter: Temporal Resolution • Temporal resolution should be held constant during change detection, if possible. • Use a sensor system that acquires data at approximately the same time of day. • Acquire remote sensor data on anniversary dates, e. g. , Feb 1, 2005, and Feb 1, 2011. Anniversary date imagery minimizes the influence of seasonal Sun-angle and plant phenological differences that can negatively impact a change detection project.

System Parameter: Spatial Resolution • Ideally, the remotely sensed data are acquired by a sensor system that collects data with the same instantaneous-field- of-view on each date. • For example, Landsat TM data collected at 30 m spatial resolution on two dates are relatively easy to register to one another.

System Parameter: Spatial Resolution • Perform change detection using data collected from two different sensor systems with different IFOVs, for example, Landsat TM data (30 30 m) for Date 1 and SPOT HRV XS data (20 20 m) for Date 2. • Decide on a representative minimum mapping unit (e. g. , 20 m) and then resample both datasets to this uniform pixel size.

Remotely sensed data used for change detection should be geometrically rectified

System Parameter: Spatial Resolution • Misregistration of the two images may result in the identification of false change between the datasets. • For example, just one pixel misregistration may cause a stable road on the two dates to show up as a new road in the change image.

System Parameter: Look Angle • Remote sensing systems like SPOT and Quick. Bird can collect data at off-nadir look angles as much as ± 20° • Two images with significantly different look angles can cause problems when used for change detection. • For example, a SPOT image of a maple forest acquired at 0° off-nadir will look directly down on the top of the canopy. Conversely, a SPOT image acquired at 20° off-nadir will record reflectance from the side of the canopy. • Acquire data with approximately the same look angle

System Parameter: Spectral Resolution • Ideally, the same sensor system is used to acquire imagery on multiple dates. • For multiple sensor, select bands that approximate one another. • For example, Landsat MSS bands 4 (green), 5 (red), and 7 (near-infrared) and SPOT bands 1 (green), 2 (red), and 3 (near -infrared), can be used successfully with Landsat ETM+ bands 2 (green), 3 (red), and 4 (near-infrared).

System Parameter: Radiometric Resolution • Ideally, the sensor systems collect the data at the same radiometric precision on both dates. • When the radiometric resolution of data acquired by one system (e. g. , Landsat MSS 1 with 6 -bit data) is compared with data acquired by a higher radiometric resolution instrument (e. g. , Landsat TM with 8 -bit data), the lower-resolution data (e. g. , 6 -bits) should be decompressed to 8 -bits for change detection purposes. • Brightness values associated with both dates of imagery are converted to apparent surface reflectance, which eliminates the problem.

Radiometric Correction of Multiple Dates of Imagery to Perform Change Detection § Absolute Radiometric Correction Use of an model atmosphere in conjunction with in situ atmospheric measurements (if possible) to correct for path radiance. § Relative Radiometric Correction - Single image normalization using histogram adjustment - Multiple date image normalization using regression techniques

Remote Sensing Environmental Considerations of Importance When Conducting Change Detection • Failure to understand the impact of various environmental characteristics on the remote sensing change detection process can lead to inaccurate results. • When performing change detection, it is desirable to hold as many environmental variables constant as possible.

Environmental Parameter: Soil Moisture • Ideally, soil moisture conditions should be identical for all dates of imagery used in a change detection project. • Extremely wet or dry conditions on one of the dates can cause change detection problems. • Stratify (cut out) those affected areas and perform a separate change detection analysis, which can be added back in the final stages of the project.

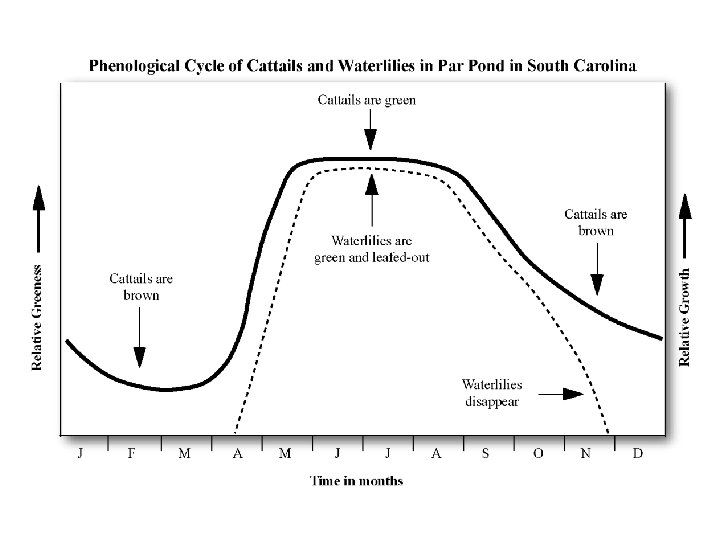
Environmental Parameter: Vegetation Phenology • Vegetation grows according to relatively predictable diurnal, seasonal, and annual phenological cycles. • Obtaining near-anniversary images greatly minimizes the effects of seasonal phenological differences that may cause spurious change to be detected in the imagery. • Agricultural crops - monoculture crops (e. g. , corn, wheat) are planted at approximately the same time of year on the two dates of imagery. A month lag in planting date between fields of the same crop can cause serious change detection error.

Phenological Cycles: Winter Wheat in the Great Plains, USA

Multiple Date Composite Image Change Detection • Rectified multiple dates of imagery • This composite dataset can be analyzed to extract change information. • Unsupervised classification techniques will result in the creation of change and nochange clusters. • The analyst must then label the clusters accordingly.

Phenological Cycles: Crops in the Central Valley of California

Selection of the Change Detection Algorithm Change detection algorithms commonly used include: • multi-date composite image • image algebra (e. g. , band differencing, band ratioing) • post-classification comparison • binary mask applied to Date 2 • ancillary data source used as Date 1 • spectral change vector analysis

Multiple Date Composite Image Change Detection • In this example, Principal Component 2 is a good indicator of change in the image

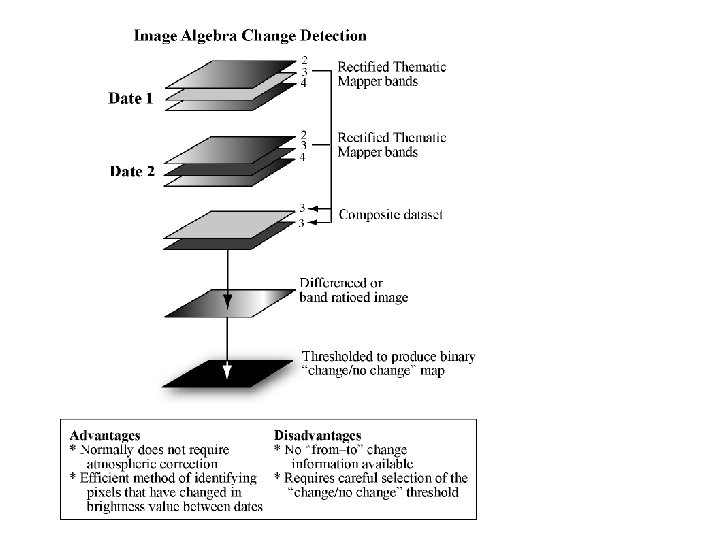
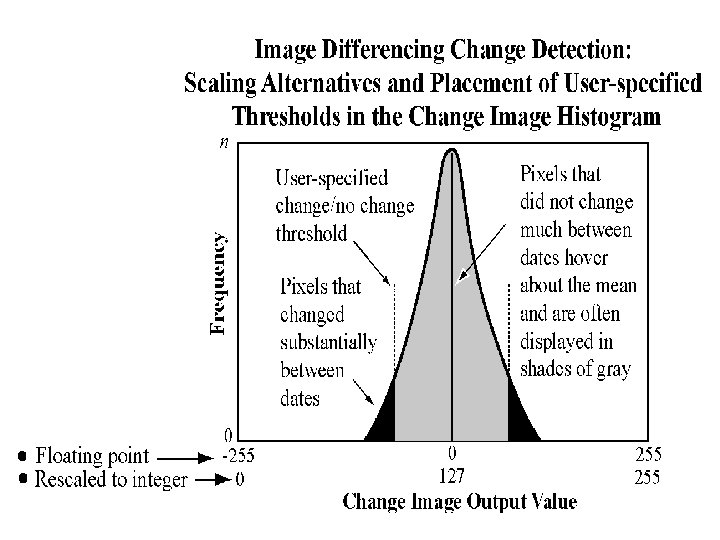
Image Algebra Change Detection • Identify change between two rectified images by band ratioing or image differencing. • Image differencing involves subtracting the imagery of one date from that of another. • If the two images have almost identical radiometric characteristics, the subtraction results in positive and negative values in areas of radiance change and zero values in areas of no change. • The results are stored in a new change image.

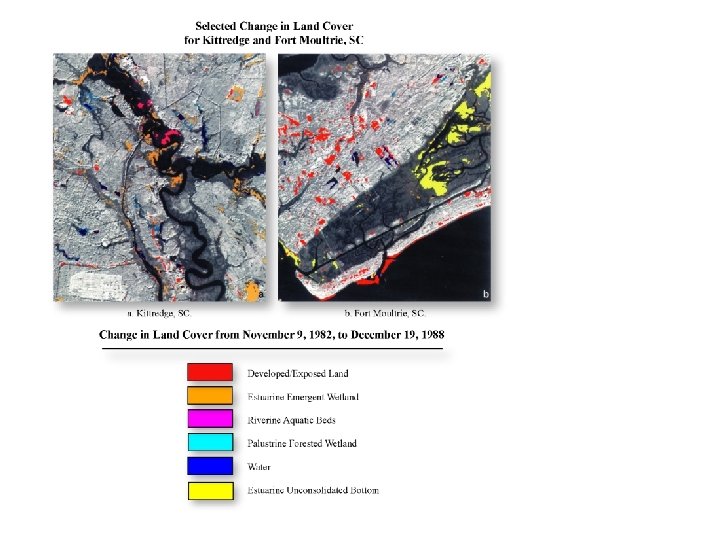
Post-classification Comparison Change Detection • Post-classification comparison change detection requires rectification and classification of each remotely sensed image. • The two maps are then compared on a pixel-by-pixel basis using a change detection matrix. • Every error in the individual date classification map will also be present in the final change detection map. • Individual classification maps used in the post-classification change detection method be as accurate as possible.
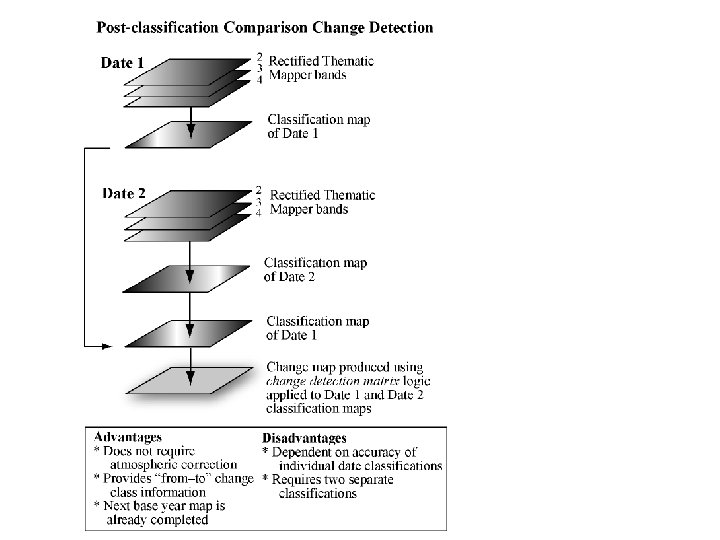

Compare classifications from each date to look for change

Can then create a decision change matrix illustrating all of the changes between dates across the landscape

Change Detection Using A Binary Change Mask Applied to Date 2

Change Detection Using an Ancillary Data Source as Date 1

Spectral Change Vector Analysis • Consider the red and near-infrared spectral characteristics of a single pixel displayed in two-dimensional feature space. • The vector describing the direction and magnitude of change from Date 1 to Date 2 is a spectral change vector.

Change Detection example: Grand Canyon - San Francisco Peaks, Arizona

Landsat TM 5 1992 Landsat TM 5 2007 Classification 1992

How much has changed? SAD
- Slides: 38