Ch 7 Human Populations Scientists disagree on Earths


 ÷ 10 National population")
 An estimate of the average number of children that")


- Slides: 29
Ch 7 Human Populations
Scientists disagree on Earth's carrying capacity Under ideal conditions, all populations grow exponentially. In most cases exponential growth stops or slows when an environmental limit is reached.
Scientists disagree on Earth's carrying capacity Human population growth. The global human population has grown more rapidly in the last 400 years than at any other time in history.
Many factors drive human population growth. In order to understand the impact of the human population on the environment, we must first understand what drives human population growth. Factors that drive population growth include: Population size Birth and death rates Fertility Life expectancy Migration
Factors that Drive Human Population Demography The study of human populations and population trends. Demographer A scientist in the field of demography.
Changes in Population Size Immigration The movement of people into a country or region, from another country or region. Emigration The movement of people out of a country or region. Crude birth rate (CBR) The number of births per 1, 000 individuals per year. Crude death rate (CDR) The number of deaths per 1, 000 individuals per year.
Changes in Population Size The human population as a system. We can think of the human population as a system, with births and immigration as inputs and deaths and emigration as outputs.
Changes in Population Size Global population growth rate = (CBR-CDR) ÷ 10 National population growth rate = (CBR + immigration) - (CDR + emigration) ÷ 10 Doubling time The number of years it takes a population to double. Doubling time (years) = 70 ÷ growth rate
Fertility Total fertility rate (TFR) An estimate of the average number of children that each woman in a population will bear throughout her childbearing years. Replacement-level fertility The total fertility rate required to offset the average number of deaths in a population in order to maintain the current population size. Replacement level fertility tends to be higher in developing countries because mortality among young people tends to be higher.
Population Growth Projected world population growth. Demographers project that the global human population will be between 8. 1 billion and 9. 6 billion by 2050. By 2100, it is projected to be between 6. 8 billion and 10. 5 billion. The dashed lines represent estimated values.
Life Expectancy Life expectancy The average number of years that an infant born in a particular year in a particular country can be expected to live, given the current average life span and death rate in that country. Infant mortality The number of deaths of children under 1 year of age per 1, 000 live births. Child mortality The number of deaths of children under age 5 per 1, 000 live births.
Life Expectancy Average life expectancies around the world. Life expectancy varies significantly by continent and in some cases by country
Migration Regardless of birth and death rates, a country may experience population growth, stability, or decline as a result of net migration. Net migration rate The difference between immigration and emigration in a given year per 1, 000 people in a country.
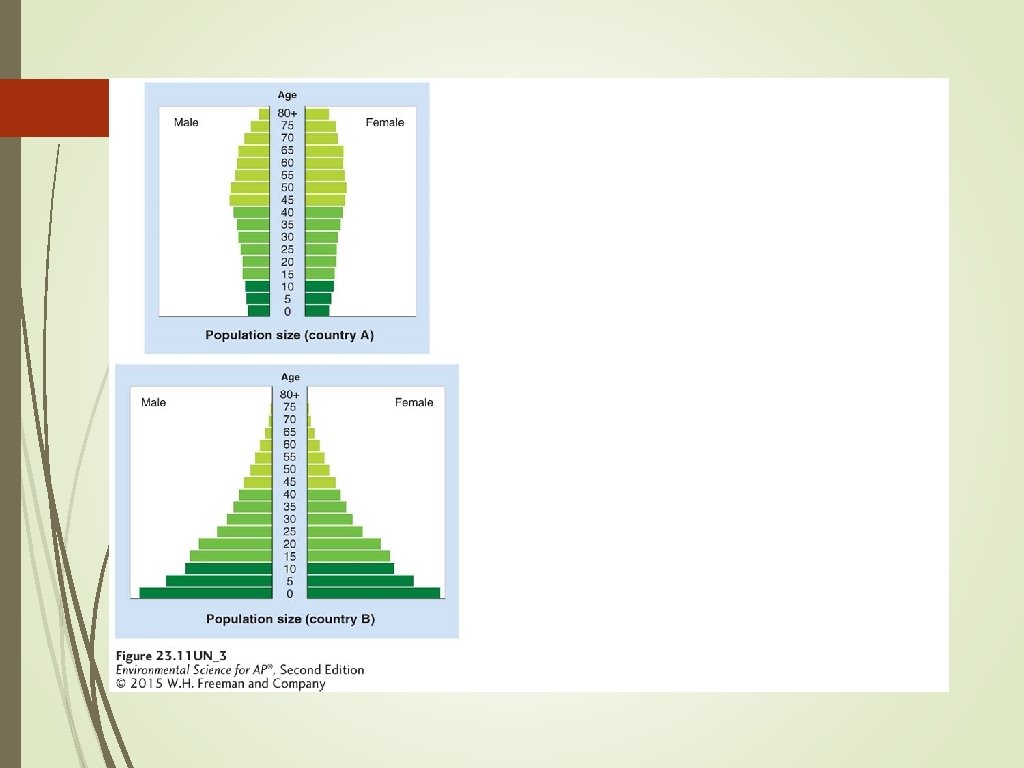
Age structure diagrams describe how populations are distributes across age ranges Age structure diagram A visual representation of the number of individuals within specific age groups for a country, typically expressed for males and females. Population pyramid An age structure diagram that is widest at the bottom and smallest at the top, typical of developing countries. Population momentum Continued population growth after growth reduction measures have been implemented.
Age Structure Diagrams Age structure diagrams in 2010. The horizontal axis of the age structure diagram shows the population size in millions for males and females in each 5 -year age group shown on the vertical axis. (a) A population pyramid illustrates a rapidly growing population. (b) A column-shaped age structure diagram indicates population stability. (c) In some developed countries, the population is declining. (d) China’s population control measures will eventually lead to a population decline.
Demographic transition follows economic development Theory of demographic transition The theory that as a country moves from a subsistence economy to industrialization and increased affluence it undergoes a predictable shift in population growth. Developed country A country with relatively high levels of industrialization and income. Developing country A country with relatively low levels of industrialization and income. Affluence The state of having plentiful wealth including the possession of money, goods, or property.
The Theory of Demographic Transition Demographic transition. The theory of demographic transition models the way that birth, death, and growth rates for a nation change with economic development. Phase 1 is a preindustrial period characterized by high birth rates and high death rates. In phase 2, as the society begins to industrialize, death rates drop rapidly, but birth rates do not change. Population growth is greatest at this point. In phase 3, birth rates decline for a variety of reasons. In phase 4, the population stops growing and sometimes begins to decline as birth rates drop below death rates.
The Theory of Demographic Transition Phase 1: Slow population growth because high birth rates and high death rates which offset each other. Phase 2: Rapid population growth because birth rates remain high but death rates decline because of better sanitation, clean drinking water, availability of food and health care. Phase 3: Stable population growth as the economy and educational system improves and people have fewer children. Phase 4: Declining population growth because the relatively high level of affluence and economic develop encourage women to delay having children.
Family Planning Family planning The practice of regulating the number or spacing of offspring through the use of birth control. Total fertility rates for educated and uneducated women in six countries. Fertility is strongly related to female education in many developing countries.
Population size, economic development, and consumption interact to influence the environment Both population and economic development contribute to the consumption of resources and to human impact on the environment.
Resource Use The 12 most populous countries in the world. China and India are by far the largest nations in the world. Only 3 of the 12 most populous countries are developed nations.
Resource Use Per capita ecological footprints. Many countries exceed the global average footprint of 2. 7 ha per capita.
Resource Use To estimate the impact of human lifestyles on Earth, environmental scientists developed the IPAT equation An equation used to estimate the impact of the human lifestyle on the environment: Impact = population × affluence × technology.
Resource Use A country's affluence often corresponds with its resource use and level of impact. Gross domestic product (GDP) A measure of the value of all products and services produced in one year in one country.
Local versus Global Impacts, and Urban Impacts The scale of an impact depends on the nature of the economy and the degree to which society has developed. Highly localized impacts are typical of rural, agriculturally-based societies. Global impacts are more common in affluent or urban societies. Urban area An area that contains more than 385 people per square kilometer (1, 000 people per square mile).
Urban Impacts Urban growth. More than one-half of the world’s population will live in urban settings by 2030.
Urban Impacts
Sustainable development is a common, if elusive, goal According to The Millennium Ecosystem Assessment: Ecosystem sustainability will be threatened if the human population continues along its current path of resource consumption around the globe. The continued alterations to ecosystems that have improved human well-being (greater access to food, clean water, suitable housing) will also exacerbate poverty for some populations. If we establish sustainable practices, we may be able to improve the standard of living for a large number of people.