Ch 4 Population Ecology 4 1 Population Dynamics


 – People (or animals) moving in… l Emigration (Exit)")


 =")


- Slides: 23
Ch 4: Population Ecology 4. 1 - Population Dynamics
CH 4. 1 – Essential Questions l What are the characteristics of populations and how are they distributed? l What are the differences between densityindependent and density-dependent limiting factors? l What are the similarities between the different models used to quantify the growth of a population? l How does carrying capacity affect reproductive rates?
Population Density l All species occur in groups called populations. l Population Density – the number of individuals per unit land area (or water volume).
Dispersion – the pattern of spacing of a population within an area. It can be: l Clumped – found in groups l Uniform – evenly spread out l Random – more spread out, but not even
Population Range l No population occupies all habitats in the biosphere. l A species range of tolerance may not be able to handle the abiotic or biotic factors in a habitat. l Biotic and abiotic factors may change leaving the population to find a new habitat.
Limiting Factors What limits growth? Abiotic and biotics factors such as… l. Food l. Disease l. Predators l. Lack of space
Limiting Factors l Limiting factors can be biotic or abiotic. l They keep a population from growing. l There are two types: 1. Density Dependent – usually biotic and include predation, disease, parasites, and competition 2. Density Independent – usually abiotic (nonliving) and include drought, floods, extreme heat or cold, tornadoes, and hurricanes.
Population Demographics l Demography is the study of population characteristics such as growth rate, age structure and movement of individuals. l Birth Rate is the number of live births per 1000 people in a given year. l Death Rate is the number of deaths per 1000 people in a given year. l To see if a population is growing or declining, subtract the death rate from the birth rate
Population Demographics l Immigration (In) – People (or animals) moving in… l Emigration (Exit) – People (or animals) moving out… l PGR - Population Growth Rate = I – E to see if a population is growing or declining…
Population Growth Rate l Exponential Growth – rapid growth, usually unrestricted (sometimes a sharper J- curve). l Growth Curve – is shown as a “J” shape on a graph l Has a lag phase and a growth phase.
Logistic Growth Model l Carrying Capacity – the largest population of a species that a certain environment can support. l These pressures will cause an “S” shaped (stabilized) growth curve. The “J” stabilizes into the “S”.
Carrying Capacity l Carrying capacity can change due to food supply, weather, etc. Example: If farmers use fertilizer, they can produce crops and feed more people than before.
Ch 4: Population Ecology 4. 2 – Human Population
CH 4. 2 – Essential Questions l What aspects affect human growth? l What are the trends in human population growth? l What are the age structures of representative non-growing, slowlygrowing, and rapidly growing countries? l What might be the consequences of continued population growth?
Human Population
Demography l Demography is the study of human population size, density, distribution, movement, and birth and death rates. l Technology, better healthcare, better nutrition have all led to an explosion in human growth.
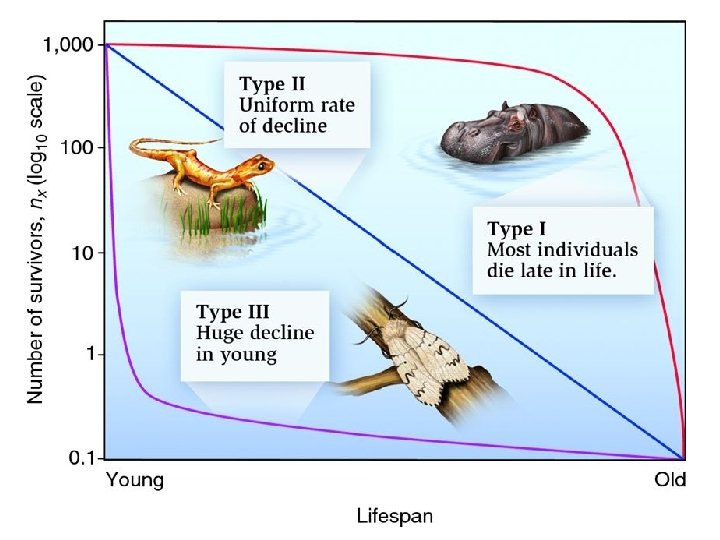
Surviorship Curves – Individuals l Type I: a convex curve. Most individuals live to adulthood with most mortality occurring during old age. Ex: hippos, humans, deer, elephants. l Type II: a straight line. An individual’s chance of dying is independent of its age. Ex: small birds, reptiles and mammals. l Type III: a concave curve, few individuals live to adulthood, with the chance of dying decreasing with age. Ex: insects, oysters, redwood trees, snapping turtles.
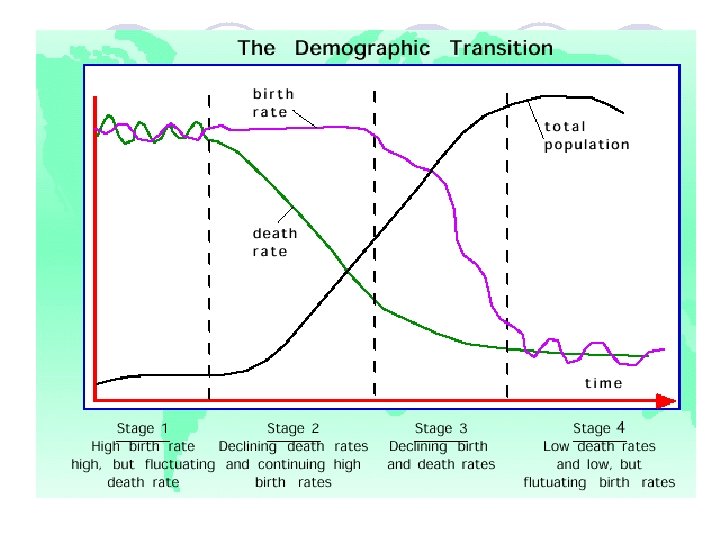
4 Stages of Demographic Transition l Stage 1: High fluctuation - high birth rate and death rates - however population growth is small. l Stage 2: High birth rate but falling death rate. The total population begins to expand rapidly. l Stage 3: Falling birth rate, continuing falling death rate. The population growth slows down. l Stage 4: low fluctuating, low birth rate and low death rate. The population growth is small, and fertility continues to fall.
Growth and Age Structure l Zero Population Growth – When (births + immigration) = (deaths + emigration) l Age Structure Graphs – a special graph that breaks up a population by age and gender to see if the population is growing rapidly, slowly, or declining. l These rates differ among countries.
The 3 Shapes of Growth
Human Carrying Capacity l Humans have a carrying capacity too. l We don’t know what it will be. l We need to conserve resources!