Ch 4 Methods and Philosophy of SPC Statistical
: 1. Powerful collection of")


 Process standard deviation = 0.")

Variable control charts: variable:品質的特徵可以數字來表示,可應用 ( i ) measure of central tendency")
Selection of the sample size (2)Control limits (3)Frequency of")
k增加 Type I error下降 Type II error增加 Center line")
 Warning limits = (若使用 0. 001 limits,則warning limits為 0. 025 limits) 若有多點落在Warning limits及control")
Larger samples easier to detect small shift in the")
的發展 使得每個被製造的unit 終究都可以被tested! 見附圖,The probability of detecting a shift")
另一個可以協助決定sample size 及sampling frequency 的量是--- Average run length(ARL) = the average number of points")


使differences")
Each sample consists of units that were produced at the same time")

Behavior of the 每次取 5個 連續樣本 process mean.")
Behavior of the process mean. (b)Corresponding 此種抽樣方法易造成within")


suggests a set of decision rules for detecting nonrandom patterns on")
 如右圖 ∵最後4點均超過 1 -sigma")
for the decision")


 製造業與非製造業應用SPC 具的差異主要有下列兩項: 1. 非製造業中,缺乏定義品質的一個測量系統 2. 非製造業中,需要improve的system不易觀察 例如: 1. 製造業---PC assembly line的performance")

再加以細分 其 作項目。. 該planning organization的經理決定以“減少planning errors”為其改進品質的目標。 由下列人員組成一個小組: managers, planners, and")


- Slides: 53
Ch 4 Methods and Philosophy of SPC Statistical Process Control(SPC): 1. Powerful collection of problem-solving tools. 2. Reduce variability to achieve process stability& improve capability. 3. Build an environment in which all individuals in an organization desire continuous improvement in quality and productivity. Seven major tools(The magnificent seven): 1. Histogram or stem-and-leaf display. 3. Pareto chart. 2. Check sheet. 4. Cause and effect diagram. 5. Defect concentration diagram. 7. Control chart. 1 6. Scatter diagram.
In any production process, regardless of how well designed or carefully maintained it is, a certain amount of inherent or natural variability will always exist. This natural variability or “background noise” is the cumulative effect of many small, essential unavoidable causes. A process that is operating with only chance cause of variation present is said to be in statistical control. A process that is operating in the presence of assignable cause is said to be out of control. e. g. improperly adjusted or controlled machines, operator errors, or defective raw material. 2
• SPC的主要功能:Elimination of variability in the process. 1. 及早發現 assignable causes of process shift. 2. 其中Control chart為一個on-line process-control technique,除了可detect process shift,亦可用來 估計生產過程的參數來決定process capability,及 提供可改進過程的有用資訊。 3
Control chart Shewhart control charts: :A sample statistic that measures some quality characteristic of interest :The mean of :The standard deviation of (upper control limit) Center line = (lower control limit) 4
• Typical control chart • Points plot within the control limits & no nonrandom pattern : process is in control, no action is necessary. • A point plots outside of the control limits or random pattern exists : process is out of control, investigation and correction are required to eliminate the assignable cause. 5
• A point plotting within the control limits is equivalent to failing to reject the hypothesis of statistical control. • A point plotting outside the control limits is equivalent to rejecting the hypothesis of statistical control. • Type I error of the control chart : the process is out of control when it is really in control. • Type II error of the control chart : the process is in control when it is really out of control. • Operating-characteristic cure : an indication of the ability of the control chart to detect process shifts of different magnitudes. 6
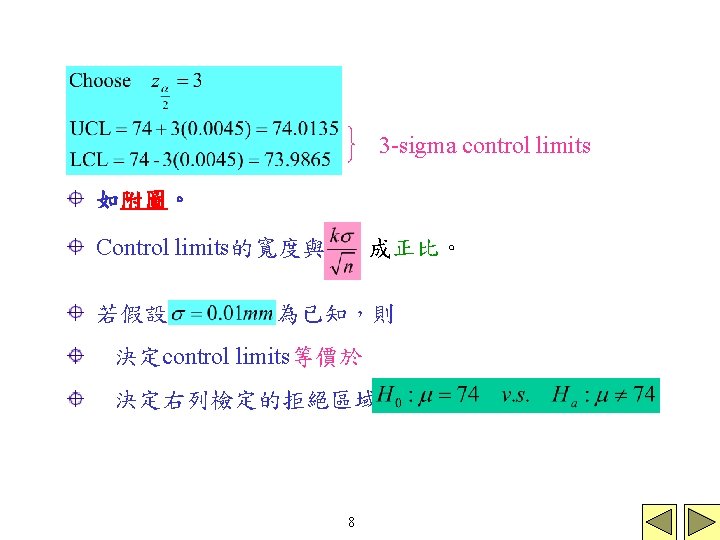
E. g. Piston-ring的直徑 Process average = 74 mm( ) Process standard deviation = 0. 01 mm( ) Sample size = 5 (n) Sampling frequency = every hour Assume ~ Normality distributed About of the sample diameters will fall between 7
Control chart 的最主要作用 通常 Improve the process 大部分的系統皆不是在 control state之下操作。 Routine且attentive的使用control chart可找出 assignable causes,藉由除去 causes 來減少 variability且improve process。 Control chart僅能detect assignable causes, management、operator and engineering action才能eliminate這些causes。 如附圖。 9
Control chart 可分為下列兩類 (1)Variable control charts: variable:品質的特徵可以數字來表示,可應用 ( i ) measure of central tendency ( ii) measure of variability 來描述品質的特徵。 e. g. Chart, S chart, R chart (2)Attributes control charts: attribute:品質的特徵無法以數字來表示,只能 將其區分為 ( i ) conforming(non-defective) ( ii) non-conforming(defective) e. g. P chart(control chart for fraction nonconforming), c chart, u chart. 10
Design of the control chart (1)Selection of the sample size (2)Control limits (3)Frequency of sampling Statistical consideration e. g. n增加,prob. of type II error下降。 (control limit 變窄 有助於detect out of control) 近來的研究則會加入economic的考量 e. g. 1. Cost of sampling 2. Losses from allowing excessive amounts of defective product to be produced 11
Choice of control limits UCL (1)k增加 Type I error下降 Type II error增加 Center line LCL (2)k=3, 3 -sigma control limit(U. S. A. 通常使用此標準. ) prob. of type I error = 0. 0027, if normality is assumed. An incorrect out of control signal will be generated in only 27 out of 10, 000 points. (3) 稱為 0. 001 probability limits. (Western Europe通常使用此標準) 當統計量的分布是未知時,則無法求probability limit的值 比較 及 (如附圖) 12
(4) Warning limits = (若使用 0. 001 limits,則warning limits為 0. 025 limits) 若有多點落在Warning limits及control limits之間,則 懷疑process可能是out of control. Solution 當發現有上述情況產生可即時 增加sampling frequency再做研判。 * 3 -sigma limit亦稱為action limits,因為有點落在 3 -sigma之外,則立即找出assignable cause,如有 必要則立即採取corrective action。 如附圖。 13
Sample size and sampling frequency (1)Larger samples easier to detect small shift in the process. e. g. operating-characteristic curve for , 如附圖。 (2)從detecting shifts的觀點 --- large sample very frequently 但卻不是economically feasible. Small samples at short intervals(current industry favor) Large samples at longer intervals. 特別是在high volume manufacturing process及多類 assignable causes會發生的情況,企業界較喜歡採用 “small samples at short intervals”的方式取樣。 14
目前由於Automatic sensing及measurement technology (e. g. microcomputers)的發展 使得每個被製造的unit 終究都可以被tested! 見附圖,The probability of detecting a shift from 74. 0000 mm to 74. 0100 mm increases as the sample size n increases. 我們欲檢測的“the size of the shift”將影響到n的選取。 即為在 之下會accept 的機率 (犯type II error的機率) 15
(3)另一個可以協助決定sample size 及sampling frequency 的量是--- Average run length(ARL) = the average number of points that must be plotted before a point indicate an out of control condition. E. g. Shewhart control chart中 (Average time to signal) Sampling frequency 其中 p = 任何點會超出Control limit的機率 ∴對 with 3 -sigma limits 16
即就算整個process是在control之下,平均每 370個樣本 仍會出現一個“out of control”的訊號。 若sampling frequency為每小時,則表示平均每 370個小 時會有一個false alarm. 假設n=5,且process的mean已shift到 74. 015 mm(i. e. process 已out of control),則從前面之O. C. curve知 平均而言,從發生shift到detect出shift需要2小時。 17
若想improve發現shift的時間可 1. 增加sample size n. e. g. n=10時,由O. C. curve知, p = 0. 9 ∴ ARL=1. 11,ATS=1. 11 hours 2. Sampling more frequency e. g. 每半個小時取一次樣本,則平均約1小時即可detect. 因此若在shift發生後1小時,即必須要能detect出該shift, 可採取下面兩種Design的方法: Design 1 Sample size = n = 5 Sampling frequency:every half hour Design 2 Sample size = n = 10 Sampling frequency:every hour 18
Rational subgroups選取的兩項原則 Using chart to detect changes in the process mean 當Assignable causes發生時 (1)使differences between subgroups的機會達到最大。 (2)使由assignable cause造成difference within a subgroup 的機會達到最小。 19
Rational subgroups選取的方法 (1)Each sample consists of units that were produced at the same time (or as chosely as possible)(snapshot). ---主要用於detect process shift(此法可minimize within sample variability且maximize between sample variability 且可得到一個較佳的standard deviation的估計值) (2)Each sample consists of units of product that are representive of all units that have been product since the last sample was taken. 亦即 each subgroup is a random sample of all process output over the sampling interval. ---當control chart 是用來決定是否接受 All units of product that have been product since the last sample. 20
注意事項 1. 若process shift to an out of control state and then back in control between samples,則使用方法(1) 較難發現此種shift,此時建議採用方法(2)。 2. 方法(2)中,若process mean drifts between several levels during the interval between sample,此將造成 chart 的control limits變大,而造成process是in statistical control的假象! 3. Several machines that pool their output into a common stream or different heads on the same machine … -----Apply control chart to the output for each individal machine. 4. Rational subgroup consist of a single observation! E. g. chemical process. . . 21
The “snapshot” approach to rational subgroups (a)Behavior of the 每次取 5個 連續樣本 process mean. (b)Corresponding Shift in process mean. and R control charts. R chart Process variability is stable. 22
The random sample approach to rational subgroups (a)Behavior of the process mean. (b)Corresponding 此種抽樣方法易造成within sample 的range過大,而使 chart的limit 過寬,造成in control的假象! and R control charts. 23
Patterns on Control Charts Defn:A run is defined as a sequence of the same type, the number of the sequence is called its length. e. g. A sequence of increasing (decreasing)points is called a run up(down). 通常A run of length 8 or more points has a very low probability of occurrence in a random sample of points. 被視為out of control的情況。 24
右圖的週期型態可能是由 operator fatigue, raw material deliveries, heat, or stress build up and so forth,雖然process 並未真正的out of control,仍 可由消除或減少其原因來改 進生產的variability,見下圖。 An chart with a cyclic pattern (a)Variability with the cyclic pattern. (b)Variability with the cyclic pattern eliminated. 25
The Western Electric Handbook(1956)suggests a set of decision rules for detecting nonrandom patterns on control charts. Specifically, it suggests concluding that the process is out of control if either 1. One point plots outside the 3 -sigma control limits. 2. Two out of three consecutive points plot beyond the 2 -sigma warning limits. 3. Four out of five consecutive points plot at a distance of 1 -sigma or beyond from the center line. 4. Eight consecutive points plot on one side of the center line. * These rules apply to one side of the center line at a time. Sensitizing rules 5. An unusual or nonrandom pattern in the data. 6. One or more points near a warning or control limit. 26
Example:A Western Electric zone rules (又稱為zone rules for control charts) 如右圖 ∵最後4點均超過 1 -sigma limit. ∴根據Western Electric zone rules,此為 nonrandom的pattern, 即process is out of control. 27
假設analyst使用上述的k個criteria,且其中第i個criteria的 Type I error 機率為 ,且若此k個criteria為互相獨立的, 則其overall Type I error(or false-alarm probability)for the decision based on all k tests為: 假設 = reject using i-th criterion. e. g. Type I error 變大 28
The rest of the “Magnificent Seven” 1. Histogram 2. Check sheet 3. Pareto chart 4. Cause and effect diagram 5. Defect concentration diagram 6. Scatter diagram 7. Control chart 29
A check sheet to record defects on tank use in an aerospace application 由於每個月僅生產數個tank, 因此可summarizing the data monthly! Time-oriented summary可用於 檢驗其是否有trend or patterns. 可利用trial run確認the check sheet layout and design. 30
The Pareto chart does not identify the most important defects, but only these that occur most frequently. Pareto chart of the tank defect data Frequency distribution (histogram) of attribute data arranged by category 31
Example of Pareto charts: Electronic assembly process Stacked Pareto chart Supplier A provides a disproportionally large share of the defection components Locate the device on the printed circuit board 32
Non-manufacturing applications of quality-improvement method. e. g. 採購機構所畫的Pareto charts 33
Cause and effect diagram for the tank defect problem 34
Cause and effect diagram 1. Define the problem or effect to be analyzed. 2. Form the team to perform the analysis. Often the team will uncover potential causes through brainstorming. 3. Draw the effect box and the center line. 4. Specify the major potential cause categories and join them as boxes connected to the center line. 5. Identify the possible causes and classify them into the categories in steps 4. Create new categories, it necessary. 6. Rank order the causes to identify those that seem most likely to impact the problem. 7. Take corrective action. 35
Defect concentration diagram 的例子 1. Surface-finish defects on a refrigerator. 36
2. Defect concentration diagram for the tank. 37
A scatter diagram Identify potential relationship. Not necessary imply causality! 38
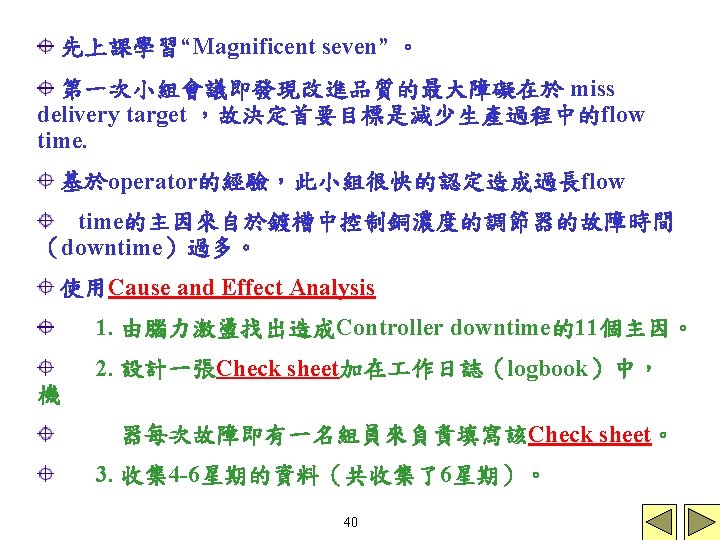
Pareto analysis 由Pareto analysis中,該小組認為“重建colorimeter”為改進 品質的重要步驟。 在收集資的過程該小組並採用Control charts來monitor Copper concentration,其採樣法為:每日以人 測量三次 的Copper concentration,取其平均。見 chart 、 R chart (maximum-minimum)Jan. 3. 、 Tolerance Diagram (以線段連接每日極大與極小值,在 Tolerance Diagram的上下界為specification limits而非control limits,故當observation超過此界限,將造成當機!)由該圖可 見在Jan. 3. 假日開機後,當機的次數顯著增加。 41
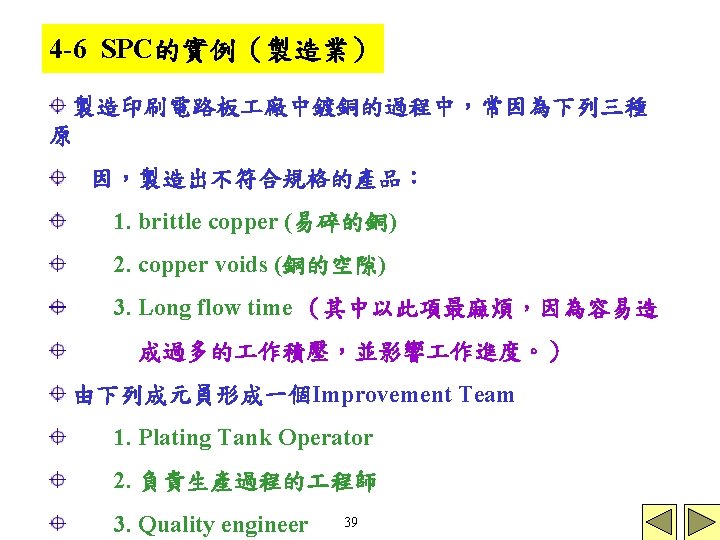
2月初,由manufacturing engineering重造colorimeter及 controller ,希望藉此可以恢復cooper concentration的 variation到pre-shutdown的level。 結果:將controller的downtime從 60%降到少於 20%,至 此process已可達到要求的production rate。 下一步該小組決定要降低生產過程的不良律,已知defect 的兩大主類為: 1. brittle copper; 2. copper voids. 42
決定以實驗設計的方法來迅速的identify controllable input variables into the process. 1. 目的---Minimize 鍍銅時的缺失。 2. 採用Table 4 -1的16 runs, 考慮 5個主要factors:Copper concentration、Sodium hydroxide concentration、Formaldehyde concentration、 Temperature、Oxygen。 3. 由統計分析來決定主因及是否存在交互作用。 4. 經由調整主因子到一個新的level之後,不良率降為原來 的1/10。 該組利用SPC的方法,有效的改進製造的流程時間,並利 用實驗設計的方法,使其生產過程toward一個near-zerodefect的capability。 43
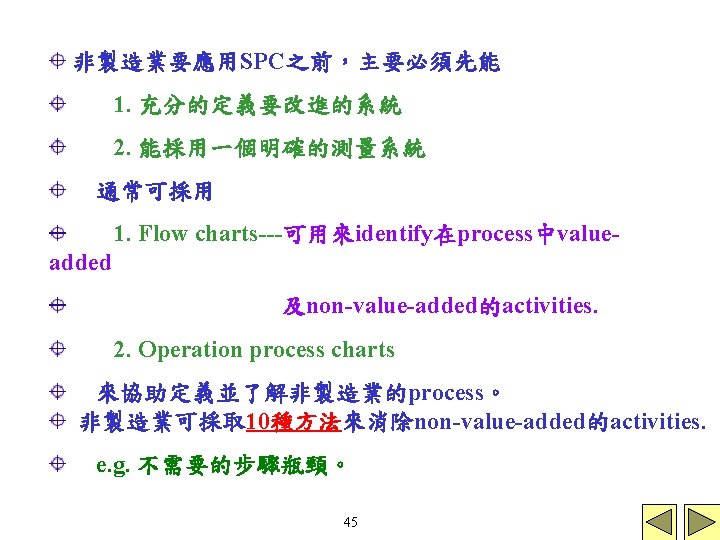
4 -7 SPC的實例(非製造業) 製造業與非製造業應用SPC 具的差異主要有下列兩項: 1. 非製造業中,缺乏定義品質的一個測量系統 2. 非製造業中,需要improve的system不易觀察 例如: 1. 製造業---PC assembly line的performance 2. 非製造業---finance organization的運作, marketing,material and procurement, customer support,field service, engineering development and design,software development and programming。 44
實例:在一個大的太空製造業公司中的一個 planning organization主要負責製造每 項 作的plans及documents,並送到 廠。 通常這些plans都很大,需要印製數百頁,若出錯時, 將造成factory floor各種問題。 e. g. rework, scrap, overtime, lost production time, missed delivery schedule. 見high-level flow chart,但此flow chart太籠統,無法 適度的找出non-value-added activities。 46
可採用step-down的approach。 e. g. 對每個block(如:planner, check…)再加以細分 其 作項目。. 該planning organization的經理決定以“減少planning errors”為其改進品質的目標。 由下列人員組成一個小組: managers, planners, and checkers。 47
Pareto analysis: 65%的planning error來自於operations section。 Pareto analysis:omitted operations及process specification 為operation section error的主因。 結論:造成planning errors的主因有兩點。 1. Planner不是充分的了解 廠的製造過程。 2. Planner不清楚目前在使用的process specification。 行動:執行一個program來使planner熟悉上述兩點,並要 求planner要對所發生的planning errors提供更多的 feedback。 49
一旦SPC的觀念可被這些planner所接受,他們即可將之 運用在其他的應用,如run chart of planning errors中若 再加入cater line及上下界,即為一個有用的control chart。 Control chart最大的作用在於其能有效的identify assignable cause。 一旦存在assignable causes,則系統製造錯誤的比例將高於 系統中只存在chance cause! Assignable cause 系統外 系統內 Chance cause 51
Operating-characteristic curves for an chart Back