CH 3 I analysis Content Processing program Scripts


![„Processing script“ created 170913 for all masses Output[Curr. In. Folder, Idata. txt] ! Archive](https://slidetodoc.com/presentation_image_h2/92310e6cf6eaf8d4a50193f3052b88ba/image-9.jpg "„Processing script“ created 170913 for all masses Output[Curr. In. Folder, Idata. txt] ! Archive")
If you have this script")
-f*I(ion; circle):")
-f*I(ion; circle):")
-f*I(ion; circle):")
-f*I(ion; circle):")
-f*I(ion; circle):")
 1 3. 88 -4. 88 2 4. 84")


 – factor*I(ring); factor = 0. 275 Irel(e) ; TPES https: //notendur.")
 – factor*I(ring); factor = 0. 275 NB: region: 15 – 16")
 – factor*I(ring); factor = 0. 275 NB: region: 19. 5 –")
 – factor*I(ring); factor = 0. 275 NB: region: 27 – 29")
 – factor*I(ring); factor = 0. 275 Irel(I+) Irel(CH 2 I+) Irel(CH")
 – factor*I(ring); factor = 0. 275 IBD(I+) Irel(I+) e. V https:")
 – factor*I(ring); factor = 0. 275 Irel(I+) IBD(I+) https: //notendur. hi.")
 – factor*I(ring); factor = 0. 275 CH 3+ https: //notendur. hi.")
 – factor*I(ring); factor = 0. 275 NB: region: 15 – 16")
 – factor*I(ring); factor = 0. 275 NB: region: 18 – 18.")
 – factor*I(ring); factor = 0. 275 IBD(CH 3+) Irel(CH 3+) https:")
 – factor*I(ring); factor = 0. 275 IBD(CH 3+) Irel (CH 3+)")
 – factor*I(ring); factor = 0. 275 Irel(CH 2+) Irel(CH+) Irel(H+) e.")
 – factor*I(ring); factor = 0. 275 Irel(CH 3+) Irel(I+) e. V")
 IBD(CH 2+) IBD(CH+) e. V https: //notendur. hi.")
 IBD(CH 2+) IBD(CH+) e. V https: //notendur. hi.")
 BD curves; the CHn. I+ ´s IBD(CH 2 I+) IBD(CHI+) IBD(CI+)")
 BD curves; the CHn. I+ ´s IBD(CH 2 I+) IBD(CHI+) IBD(CI+)")
 IBD(CHI+) IBD(CH 3 I+) e.")
 IBD(I+) IBD(CH 3+) IBD(H+) e. V https: //notendur. hi. is//~agust/rannsoknir/SLS/XLS-170906. xlsx; sheet:")
 IBD(I+) IBD(CH 3+) IBD(H+) e. V https: //notendur. hi. is//~agust/rannsoknir/SLS/XLS-170906. xlsx; sheet:")


 Files: 8000…: dots (11.")
 Files: 10000… (<38. 056 e. V) Files: 11000…(>38.")
 and OLD")


:")
- Slides: 73
CH 3 I analysis: Content: Processing program…………………………. Scripts…………………………………… How to create a script: ………………………. How to derive „subtracted mass specta“; i. e. Mass spectra for I(ion; center)-f*I(ion; circle): …………… Explanation of Noise offsets…………………. . I 2 settings………………………………. Mass specta, low energy region……………… 18 -21 TPES and Ion spectra (vs. e. V) and discrepancies, e-, H+, CHn. I+ ……………………. . 22 -35 BD curves (summary)………………………. . Breakdown curves (ALL)……………………. . Factor f in Irel (f = 0. 275. . 0. 33. . 0. 4) (effect of)…………… Mass spectra for CHn+; n = 0 -3 vs e. V…………… Summary of exp. Scans………………………. . TPES, 14 -18 e. V (data 5000… 10000)………………. BD curves, different files/data sets & OLD vs. NEW……. . Conclusions from OLD vs. NEWdata comparison…………… Instruction for use of i 2 in processing program……………. BD curves for SUM(CHn+)………………………. Meeting with AB, 15. 9. 2017…………………. . Where is the data(? )…………………………. . Updated: 180925 page: 2 -4 5 -9 10 11 -15 16 17 36 -42 43 -45 46 -47 48 -49 50 51 52 -61 62 63 -68 69 -71 72 73
Data processing program: Load files
Select file
Load file
„Load“ Script: ! Standard Load script for double imaging data. Resolu : = 0. 008 Max. T : = 40 If[Request. Subtract[Im 1], Goto[Load. Subtracted], Goto[Simple. Load]] : Simple. Load Add. Coinc. Crit[Curr. Coinc. Crit] Load[Curr. In. Folder, Curr. In. File, 0, Max. T, Resolu] Fill. Loaded. Params Print. EPICSFixed. Str[Concat[Loaded. Param[Start, E], " e. V"]] If[Exists[Im 1 Res[1]], Plot. Image[Im 1 Res[1], Im 1], nil] If[Exists[Im 2 Res[1]], Plot. Image[Im 2 Res[1], Im 2], nil] If[Exists[TOFRes[1]], Plot. TOF[TOFRes[1]], nil] Save. TOF[TOFRes[1], 3, 17, Concat[Curr. In. Folder, Curr. In. File], nil, True, 0] End : Load. Subtracted ! Add center and ring for BD Ring : = Curr. ROI[Im 1] Center : = Curr. Ring. ROIAs. Circle[Im 1] Area. R : = ROIArea[Ring] Area. C : = ROIArea[Center] F : = {-1*Area. C/Area. R} Add. Coinc. Crit[Add. Event[Im 1, 0, 0, Center, TOFStart, Im 1], Add. Event[Im 2, 0, Max. T, ROIAll, TOFStop, I m 2]] Add. Coinc. Crit[Add. Event[Im 1, 0, 0, Ring, TOFStart, Im 1], Add. Event[Im 2, 0, Max. T, ROIAll, TOFStop, Im 2] ] ! Load file Load[Curr. In. Folder, Curr. In. File, 0, Max. T, Resolu] Fill. Loaded. Params Print. EPICSFixed. Str[Concat[Loaded. Param[Start, E], " e. V"]] ! Plot the image Multiply[Im 2 Res[2], F] Add[Im 2 Res[1], Im 2 Res[2]] Plot. Image[Im 1 Res[1], Im 1] Plot. Image[Im 2 Res[1], Im 2] ! Make TOF Multiply[TOFRes[2], F] Add[TOFRes[1], TOFRes[2]] Plot. TOF[TOFRes[1]] End ms(max) ms(min) Printout of MS spectra as I(ions) vs. ms
„Processing“ Script for CH 3 I data, for I+ and CHn. I+ ions: Output[Curr. In. Folder, Idata. txt] ! Archive script Save. Myself[Curr. In. Folder] ! Add all image for TPES analysis Add. Coinc. Crit[Add. Event[Im 1, 0, 0, ROIAll, nil, Im 1]] ! Add center and ring for BD ! Parameters for ROIs CX : = 0. 073 CY : = 0. 126 R 1 : = 0. 02 R 2 : = 0. 04 ! Further parameters TOFMax : = 50 TOFReso : = 0. 006 Center : = ROICircle[Point[CX, CY], R 1, 1] Ring : = ROIRing[Point[CX, CY], R 1, R 2, 1] Add. Coinc. Crit[Add. Event[Im 1, 0, 0, Center, TOFStart, Im 1], Add. Event[Im 2, 0, TOFMax, ROIAll, TOFStop, nil]] Add. Coinc. Crit[Add. Event[Im 1, 0, 0, Ring, TOFStart, Im 1], Add. Event[Im 2, 0, TOFMax, ROIAll, TOFStop, nil]] Ring definitions ! Noise offsets are individually defined Set. Noise. Iter[6] N[0] : = 2. 88 N[1] : = 2. 88 N[2] : = 2. 88 N[3] : = 2. 88 N[4] : = 2. 88 N[5] : = 2. 88 offset definitions Should be product of 0. 96 (magic number) ! Set up file cycle Cycle. Files[Curr. In. Folder, *. i 2 d] Load[nil, Cyc. File, 0, TOFMax, TOFReso] ! Plot the image for fun Plot. Image[Im 1 Res[1], Im 1] ! Print basic stuff Print[Strip. Path[Cyc. File], Loaded. Meas. Time, Loaded. Param[Start, E], Loaded. Param[Start, EF]] ! Print TPES data Print[Image. Int[Im 1 Res[1], Center], Image. Int[Im 1 Res[1], Ring]] Number of averages ! Save ROIs to output for reference Print. Ln["Center: ", ROITo. Text[Center], "Ring: ", ROITo. Text[Ring]] Print. Ln["Masses: Parent, Slow. D 1, Slow. D 2, Fast. D 1, Fast. D 2, D 3"] ! Print BD data For[K, 2, 3] For[G, 0, {Peak. Count - 1}] Peak. Count : = 6 P[0, 0] : = 15. 204 P[1, 0] : = 15. 299 P[2, 0] : = 15. 924 P[3, 0] : = 15. 994 P[4, 0] : = 16. 050 P[5, 0] : = 16. 111 Print[TOFInt[TOFRes[K], P[G, 0], P[G, 1], N[G]]] ! COG data are also evaluated ! Print[TOFCo. G[TOFRes[K], P[G, 0], P[G, 1], N[G], 1, 0]] P[0, 1] : = 15. 286 P[1, 1] : = 15. 354 P[2, 1] : = 16. 001 P[3, 1] : = 16. 046 P[4, 1] : = 16. 111 P[5, 1] : = 16. 164 peak definitions P(0)=I+ P(1)=HI+ P(2)=CI+ P(3)=CHI+ P(4)=CH 2 I+ P(5)=CH 3 I+ Next Print[XXX] Next Print. Ln[] Next
„Processing Script“ for CH 3 I data, for H+ and CHn+ ions: Output[Curr. In. Folder, Idata. txt] ! Archive script Save. Myself[Curr. In. Folder] ! Noise offsets are individually defined Set. Noise. Iter[4] N[0] : = 2. 88 N[1] : = 2. 88 N[2] : = 2. 88 N[3] : = 2. 88 offset definitions Should be product of 0. 96 (magic number) ! Add all image for TPES analysis Add. Coinc. Crit[Add. Event[Im 1, 0, 0, ROIAll, nil, Im 1]] ! Add center and ring for BD ! Set up file cycle ! Parameters for ROIs Cycle. Files[Curr. In. Folder, *. i 2 d] CX : = 0. 073 CY : = 0. 126 Load[nil, Cyc. File, 0, TOFMax, TOFReso] R 1 : = 0. 02 ! Plot the image for fun R 2 : = 0. 04 Plot. Image[Im 1 Res[1], Im 1] ! Further parameters ! Print basic stuff TOFMax : = 50 Print[Strip. Path[Cyc. File], Loaded. Meas. Time, Loaded. Param[Start, E], Loaded. Param[Start, EF]] TOFReso : = 0. 006 ! Print TPES data Center : = ROICircle[Point[CX, CY], R 1, 1] Print[Image. Int[Im 1 Res[1], Center], Image. Int[Im 1 Res[1], Ring]] Ring : = ROIRing[Point[CX, CY], R 1, R 2, 1] Add. Coinc. Crit[Add. Event[Im 1, 0, 0, Center, TOFStart, Im 1], Add. Event[Im 2, 0, TOFMax, ROIAll, TOFStop, nil]] Add. Coinc. Crit[Add. Event[Im 1, 0, 0, Ring, TOFStart, Im 1], Add. Event[Im 2, 0, TOFMax, ROIAll, TOFStop, nil]] ! Print BD data For[K, 2, 3] For[G, 0, {Peak. Count - 1}] ! Save ROIs to output for reference Print. Ln["Center: ", ROITo. Text[Center], "Ring: ", ROITo. Text[Ring]] Print[TOFInt[TOFRes[K], P[G, 0], P[G, 1], N[G]]] Print. Ln["Masses: Parent, Slow. D 1, Slow. D 2, Fast. D 1, Fast. D 2, D 3"] ! COG data are also evaluated ! Print[TOFCo. G[TOFRes[K], P[G, 0], P[G, 1], N[G], 1, 0]] Peak. Count : = 4 Ring definitions Number of averages P[0, 0] : = 1. 273 P[1, 0] : = 4. 822 P[2, 0] : = 5. 014 P[3, 0] : = 5. 184 P[0, 1] : = 1. 377 P[1, 1] : = 4. 905 P[2, 1] : = 5. 092 P[3, 1] : = 5. 267 peak definitions P(0)= H+ P(1)= CH+ P(2)= CH 2+ P(3)= CH 3+ Next Print[XXX] Next Print. Ln[] Next
Script for CH 3 I data and for H+ and CHn+ ions created (2 slides): Output[Curr. In. Folder, Idata. txt] ! Archive script Save. Myself[Curr. In. Folder] ! Noise offsets are individually defined Set. Noise. Iter[4] N[0] : = 2. 88 N[1] : = 2. 88 N[2] : = 2. 88 N[3] : = 2. 88 offset definitions Should be product of 0. 96 (magic number) ! Add all image for TPES analysis Add. Coinc. Crit[Add. Event[Im 1, 0, 0, ROIAll, nil, Im 1]] ! Add center and ring for BD ! Set up file cycle ! Parameters for ROIs Cycle. Files[Curr. In. Folder, *. i 2 d] CX : = 0. 075 CY : = 0. 126 Load[nil, Cyc. File, 0, TOFMax, TOFReso] R 1 : = 0. 02 ! Plot the image for fun R 2 : = 0. 04 Plot. Image[Im 1 Res[1], Im 1] ! Further parameters ! Print basic stuff TOFMax : = 50 Print[Strip. Path[Cyc. File], Loaded. Meas. Time, Loaded. Param[Start, E], Loaded. Param[Start, EF]] TOFReso : = 0. 006 ! Print TPES data Center : = ROICircle[Point[CX, CY], R 1, 1] Print[Image. Int[Im 1 Res[1], Center], Image. Int[Im 1 Res[1], Ring]] Ring : = ROIRing[Point[CX, CY], R 1, R 2, 1] Add. Coinc. Crit[Add. Event[Im 1, 0, 0, Center, TOFStart, Im 1], Add. Event[Im 2, 0, TOFMax, ROIAll, TOFStop, nil]] Add. Coinc. Crit[Add. Event[Im 1, 0, 0, Ring, TOFStart, Im 1], Add. Event[Im 2, 0, TOFMax, ROIAll, TOFStop, nil]] ! Print BD data For[K, 2, 3] For[G, 0, {Peak. Count - 1}] ! Save ROIs to output for reference Print. Ln["Center: ", ROITo. Text[Center], "Ring: ", ROITo. Text[Ring]] Print[TOFInt[TOFRes[K], P[G, 0], P[G, 1], N[G]]] Print. Ln["Masses: Parent, Slow. D 1, Slow. D 2, Fast. D 1, Fast. D 2, D 3"] ! COG data are also evaluated ! Print[TOFCo. G[TOFRes[K], P[G, 0], P[G, 1], N[G], 1, 0]] Peak. Count : = 4 Ring definitions Number of averages P[0, 0] : = 1. 273 P[1, 0] : = 4. 822 P[2, 0] : = 5. 014 P[3, 0] : = 5. 184 P[0, 1] : = 1. 377 P[1, 1] : = 4. 905 P[2, 1] : = 5. 092 P[3, 1] : = 5. 267 Change peak Definitions and Noise offsets according to P(0)= H+ P(1)= C+ P(2)= CH+ P(3)= CH 2+ P(4)= CH 3+ P(5)=I+ P(6)=HI+ P(7)=CI+ P(8)= CHI+ P(9)=CH 2 I+ P(10)=CH 3 I+ Next Print[XXX] Next Print. Ln[] Next Results shown on next slide:
„Processing script“ created 170913 for all masses Output[Curr. In. Folder, Idata. txt] ! Archive script Save. Myself[Curr. In. Folder] ! Add all image for TPES analysis Add. Coinc. Crit[Add. Event[Im 1, 0, 0, ROIAll, nil, Im 1]] ! Add center and ring for BD ! Parameters for ROIs CX : = 0. 073 CY : = 0. 126 R 1 : = 0. 02 R 2 : = 0. 04 ! Further parameters TOFMax : = 50 TOFReso : = 0. 006 Center : = ROICircle[Point[CX, CY], R 1, 1] Ring : = ROIRing[Point[CX, CY], R 1, R 2, 1] Add. Coinc. Crit[Add. Event[Im 1, 0, 0, Center, TOFStart, Im 1], Add. Event[Im 2, 0, TOFMax, ROIAll, TOFStop, nil]] Add. Coinc. Crit[Add. Event[Im 1, 0, 0, Ring, TOFStart, Im 1], Add. Event[Im 2, 0, TOFMax, ROIAll, TOFStop, nil]] Ring definitions ! Save ROIs to output for reference Print. Ln["Center: ", ROITo. Text[Center], "Ring: ", ROITo. Text[Ring]] Print. Ln["Masses: Parent, Slow. D 1, Slow. D 2, Fast. D 1, Fast. D 2, D 3"] Peak. Count : = 11 P[0, 0] : = 1. 273 P[1, 0] : = 4. 631 P[2, 0] : = 4. 822 P[3, 0] : = 5. 014 P[4, 0] : = 5. 184 P[5, 0] : = 15. 204 P[6, 0] : = 15. 299 P[7, 0] : = 15. 924 P[8, 0] : = 15. 994 P[9, 0] : = 16. 050 P[10, 0] : = 16. 111 P(0)= H+ P(1)= C+ P(2)= CH+ P(3)= CH 2+ P(4)= CH 3+ P(5)=I+ P(6)=HI+ P(7)=CI+ P(8)= CHI+ P(9)=CH 2 I+ P(10)=CH 3 I+ Left of peaks P[0, 1] : = 1. 377 P[1, 1] : = 4. 700 P[2, 1] : = 4. 905 P[3, 1] : = 5. 092 P[4, 1] : = 5. 267 P[5, 1] : = 15. 286 P[6, 1] : = 15. 354 P[7, 1] : = 16. 001 P[8, 1] : = 16. 046 P[9, 1] : = 16. 111 P[10, 1] : = 16. 164 ! Noise offsets are individually defined Set. Noise. Iter[3] N[0] : = 0. 96 N[1] : = 2. 88 N[2] : = 2. 88 N[3] : = 2. 88 N[4] : = 2. 88 N[5] : = 2. 88 N[6] : = 2. 88 N[7] : = 2. 88 N[8] : = 2. 88 N[9] : = 2. 88 N[10] : = 2. 88 Right of peaks offset definitions Should be product of 0. 96 (magic number) ! Set up file cycle Cycle. Files[Curr. In. Folder, *. i 2 d] Number of averages =3 Load[nil, Cyc. File, 0, TOFMax, TOFReso] ! Plot the image for fun Plot. Image[Im 1 Res[1], Im 1] ! Print basic stuff Print[Strip. Path[Cyc. File], Loaded. Meas. Time, Loaded. Param[Start, E], Loaded. Param[Start, EF]] ! Print TPES data Print[Image. Int[Im 1 Res[1], Center], Image. Int[Im 1 Res[1], Ring]] ! Print BD data For[K, 2, 3] For[G, 0, {Peak. Count - 1}] Print[TOFInt[TOFRes[K], P[G, 0], P[G, 1], N[G]]] ! COG data are also evaluated ! Print[TOFCo. G[TOFRes[K], P[G, 0], P[G, 1], N[G], 1, 0]] : Next Print[XXX] Next Print. Ln[] Next
How to create new scripts: Messanger 170914 from AB: 1)If you have this script folder selected by either clicking on it or by being on a script within this folder, 2) you just type the name in the bottom and 3) click on save. 4)The text in the right-hand box will be saved as a new script. (1) (2) (3) (4)
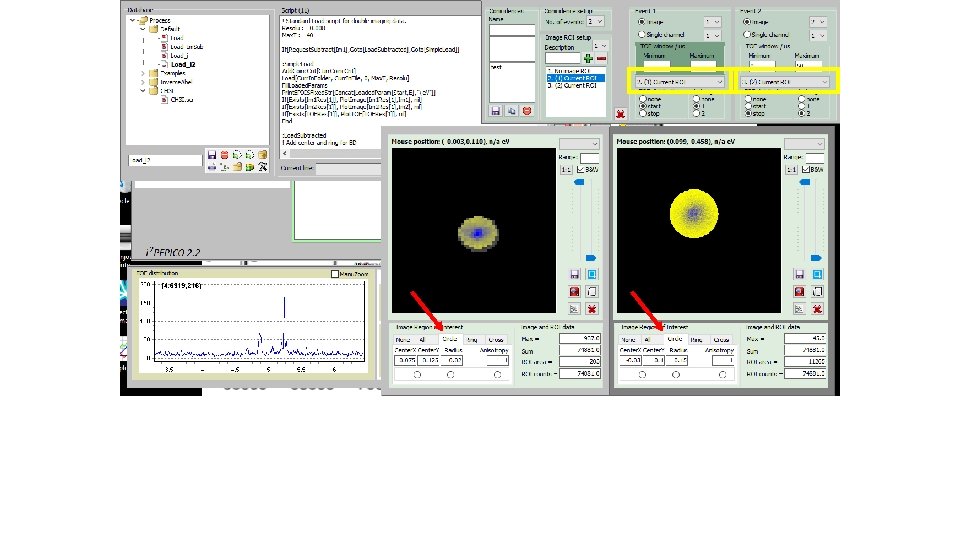
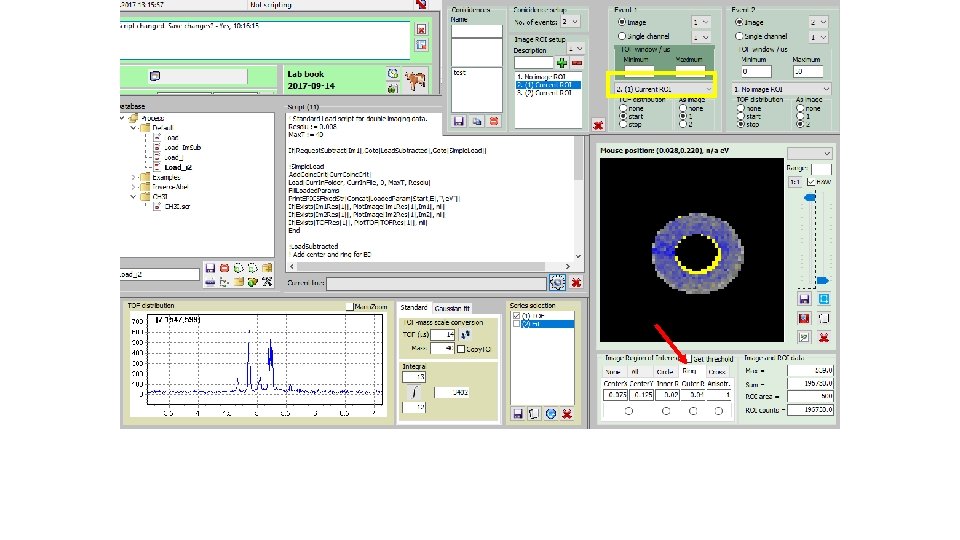
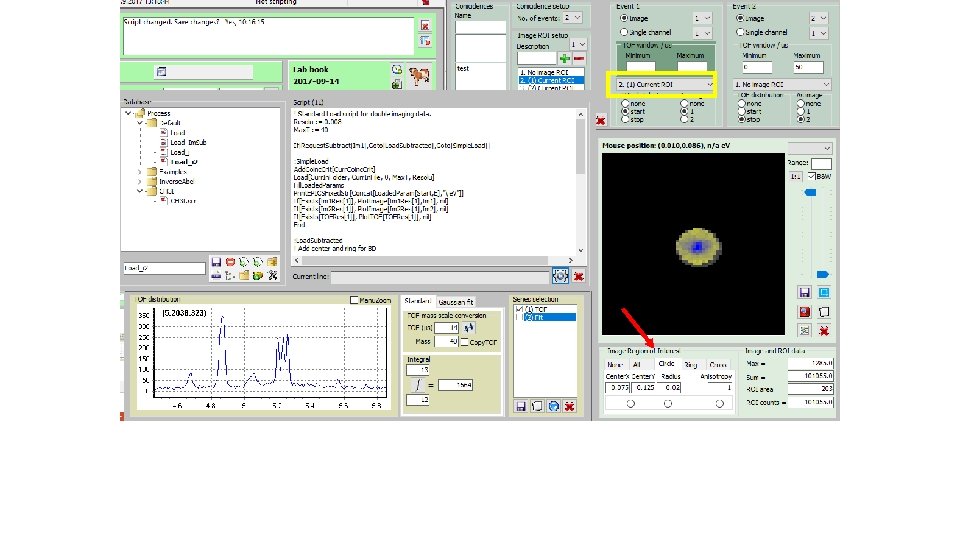
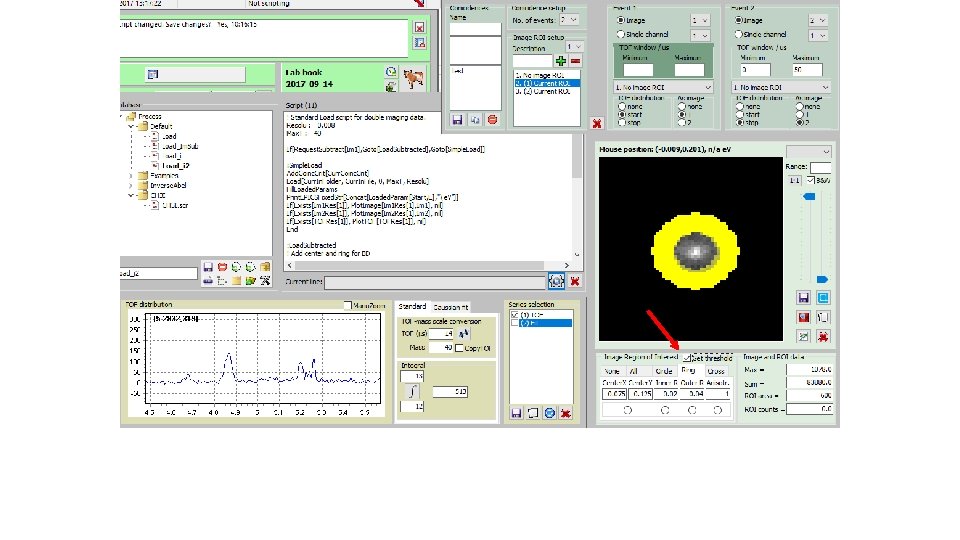
How to derive „subtracted mass specta“; i. e. Mass spectra fir I(ion; center)-f*I(ion; circle): (2) Get e -image(3) Select file (1)
How to derive „subtracted mass specta“; i. e. Mass spectra fir I(ion; center)-f*I(ion; circle): Tick(4) Start script(5)
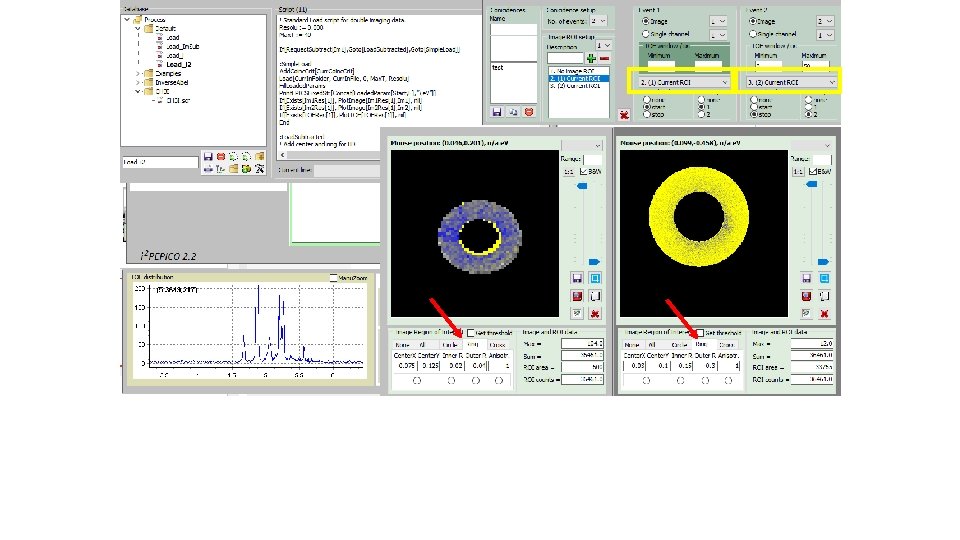
How to derive „subtracted mass specta“; i. e. Mass spectra for I(ion; center)-f*I(ion; circle): „subtracted mass specta“(6) Blown up partly for CHn+ family (7)
How to derive „subtracted mass specta“; i. e. Mass spectra for I(ion; center)-f*I(ion; circle): „un-tick“(8) Start script(9)
How to derive „subtracted mass specta“; i. e. Mass spectra for I(ion; center)-f*I(ion; circle): „total e“ mass spectrum (10) Blown up partly for CHn+ family (11)
Explanation of Noise offsets: example: P(0) 1 3. 88 -4. 88 2 4. 84 -5. 84 5. 80 -6. 80 ms 0. 96 2. 88 P[0, 0] : = 1. P[0, 1] : = 2. Set. Noise. Iter[3] N[0] : = 2. 88 From AB: peak is 1 us to 2 us noise offset is 2. 88 setnoiseiter is 3 background is evaluated at 3. 88 -4. 88, 4. 84 -5. 84, and 5. 80 -6. 80, and the average integral of these three is subtracted from the integral of 1 -2 so the range is making 0. 96 us steps, always
Below are mass spectra for the following i 2 settings:
Low energy; Mass spectra: msec
msec
Low energy; Mass spectra: Mw Mw
Mw Mw
Irel = I(center) – factor*I(ring); factor = 0. 275 Irel(e) ; TPES https: //notendur. hi. is//~agust/rannsoknir/SLS/XLS-170906. xlsx; sheet: CH 3 I proc. data ……. C: PXP-170909. pxp; Gr: 0, Lay: 0 e. V
Irel = I(center) – factor*I(ring); factor = 0. 275 NB: region: 15 – 16 e. V Irel(e) ; TPES ? e. V https: //notendur. hi. is//~agust/rannsoknir/SLS/XLS-170906. xlsx; sheet: CH 3 I proc. data ……. C: PXP-170909. pxp; Gr: 0, Lay: 0
Irel = I(center) – factor*I(ring); factor = 0. 275 NB: region: 19. 5 – 22 e. V Irel(e) ; TPES ? Slit changes Ne lines e. V https: //notendur. hi. is//~agust/rannsoknir/SLS/XLS-170906. xlsx; sheet: CH 3 I proc. data ……. C: PXP-170909. pxp; Gr: 0, Lay: 0
Irel = I(center) – factor*I(ring); factor = 0. 275 NB: region: 27 – 29 e. V Irel(e) ; TPES ? Slit changes e. V https: //notendur. hi. is//~agust/rannsoknir/SLS/XLS-170906. xlsx; sheet: CH 3 I proc. data ……. C: PXP-170909. pxp; Gr: 0, Lay: 0
Irel = I(center) – factor*I(ring); factor = 0. 275 Irel(I+) Irel(CH 2 I+) Irel(CH 3 I+) e. V https: //notendur. hi. is//~agust/rannsoknir/SLS/XLS-170906. xlsx; sheet: CH 3 I proc. data
Irel = I(center) – factor*I(ring); factor = 0. 275 IBD(I+) Irel(I+) e. V https: //notendur. hi. is//~agust/rannsoknir/SLS/XLS-170906. xlsx; sheet: CH 3 I proc. data ……. C: PXP-170909. pxp; Gr: 3, Lay: 2
Irel = I(center) – factor*I(ring); factor = 0. 275 Irel(I+) IBD(I+) https: //notendur. hi. is//~agust/rannsoknir/SLS/XLS-170906. xlsx; sheet: CH 3 I proc. data ……. C: PXP-170909. pxp; Gr: 3, Lay: 2
Irel = I(center) – factor*I(ring); factor = 0. 275 CH 3+ https: //notendur. hi. is//~agust/rannsoknir/SLS/XLS-170906. xlsx; sheet: CH 3 I proc. data ……. C: PXP-170909. pxp; Gr: 1, Lay: 1 e. V
Irel = I(center) – factor*I(ring); factor = 0. 275 NB: region: 15 – 16 e. V CH 3+ https: //notendur. hi. is//~agust/rannsoknir/SLS/XLS-170906. xlsx; sheet: CH 3 I proc. data ……. C: PXP-170909. pxp; Gr: 1, Lay: 1
Irel = I(center) – factor*I(ring); factor = 0. 275 NB: region: 18 – 18. 5 e. V Irel(CH 3+) ? e. V https: //notendur. hi. is//~agust/rannsoknir/SLS/XLS-170906. xlsx; sheet: CH 3 I proc. data ……. C: PXP-170909. pxp; Gr: 1, Lay: 1
Irel = I(center) – factor*I(ring); factor = 0. 275 IBD(CH 3+) Irel(CH 3+) https: //notendur. hi. is//~agust/rannsoknir/SLS/XLS-170906. xlsx; sheet: CH 3 I proc. data ……. C: PXP-170909. pxp; Gr: 4, Lay: 3 e. V
Irel = I(center) – factor*I(ring); factor = 0. 275 IBD(CH 3+) Irel (CH 3+) https: //notendur. hi. is//~agust/rannsoknir/SLS/XLS-170906. xlsx; sheet: CH 3 I proc. data ……. C: PXP-170909. pxp; Gr: 4, Lay: 3 e. V
Irel = I(center) – factor*I(ring); factor = 0. 275 Irel(CH 2+) Irel(CH+) Irel(H+) e. V https: //notendur. hi. is//~agust/rannsoknir/SLS/XLS-170906. xlsx; sheet: CH 3 I proc. data
Irel = I(center) – factor*I(ring); factor = 0. 275 Irel(CH 3+) Irel(I+) e. V https: //notendur. hi. is//~agust/rannsoknir/SLS/XLS-170906. xlsx; sheet: CH 3 I proc. data
BD curves; CHn+ ´s IBD(CH 3+) IBD(CH 2+) IBD(CH+) e. V https: //notendur. hi. is//~agust/rannsoknir/SLS/XLS-170906. xlsx; sheet: CH 3 I proc. data ……. C: PXP-170909. pxp; Gr: 5, Lay: 4
BD curves; CHn+ ´s IBD(CH 3+) IBD(CH 2+) IBD(CH+) e. V https: //notendur. hi. is//~agust/rannsoknir/SLS/XLS-170906. xlsx; sheet: CH 3 I proc. data ……. C: PXP-170909. pxp; Gr: 5, Lay: 4
IBD(CH 3 I+) BD curves; the CHn. I+ ´s IBD(CH 2 I+) IBD(CHI+) IBD(CI+) e. V https: //notendur. hi. is//~agust/rannsoknir/SLS/XLS-170906. xlsx; sheet: CH 3 I proc. data ……. C: PXP-170909. pxp; Gr: 6, Lay: 5
IBD(CH 3 I+) BD curves; the CHn. I+ ´s IBD(CH 2 I+) IBD(CHI+) IBD(CI+) e. V https: //notendur. hi. is//~agust/rannsoknir/SLS/XLS-170906. xlsx; sheet: CH 3 I proc. data ……. C: PXP-170909. pxp; Gr: 6, Lay: 5
BD curves; the CHn. I+ ´s IBD(CH 2 I+) IBD(CHI+) IBD(CH 3 I+) e. V https: //notendur. hi. is//~agust/rannsoknir/SLS/XLS-170906. xlsx; sheet: CH 3 I proc. data ……. C: PXP-170909. pxp; Gr: 6, Lay: 5
IBD(CH 3+) IBD(I+) IBD(CH 3+) IBD(H+) e. V https: //notendur. hi. is//~agust/rannsoknir/SLS/XLS-170906. xlsx; sheet: CH 3 I proc. data ……. C: PXP-170909. pxp; Gr: 7, Lay: 6
IBD(CH 3+) IBD(I+) IBD(CH 3+) IBD(H+) e. V https: //notendur. hi. is//~agust/rannsoknir/SLS/XLS-170906. xlsx; sheet: CH 3 I proc. data ……. C: PXP-170909. pxp; Gr: 7, Lay: 6
BD curves: Filled circles: I+ HI+ CHI+ CH 2 I+ CH 3 I+ Open circles: H+ CH 2+ CH 3+ e. V https: //notendur. hi. is//~agust/rannsoknir/SLS/XLS-170906. xlsx; sheet: CH 3 I proc. data ……. C: PXP-170909. pxp; Gr: 8, Lay: 7
BD curves: Filled circles: I+ HI+ CHI+ CH 2 I+ CH 3 I+ Open circles: H+ CH 2+ CH 3+ e. V https: //notendur. hi. is//~agust/rannsoknir/SLS/XLS-170906. xlsx; sheet: CH 3 I proc. data ……. C: PXP-170909. pxp; Gr: 8, Lay: 7
BD curves: Filled circles: I+ HI+ CHI+ CH 2 I+ CH 3 I+ Open circles: H+ CH 2+ CH 3+ e. V https: //notendur. hi. is//~agust/rannsoknir/SLS/XLS-170906. xlsx; sheet: CH 3 I proc. data ……. C: PXP-170909. pxp; Gr: 8, Lay: 7
Use f= ca. 0. 33 BD curves for CH 3 I+, using different factors for ring Pxp: CH 3 I_ion_SLS_ions_and_BD_curves_170912 ; graph 1
Fine tuning of factors f for 0. 4 > f >0. 275 AK, C: ……Users/agust/SLS-17/PXP-170913 AH, pxp; Gr: 1, Lay: 0
C+ Dropbox…REMPI/SLS-17/ms-TPES_AK, pxp; Lay 1, Gr 1 CH+ CH 2+ CH 3+ BD for CH 3+
CH 2+ Dropbox…REMPI/SLS-17/ms-TPES_AK, pxp; Lay 1, Gr 1 CH 3+ BD for CH 3+
10 15 20 25 30 40 35 45 50 e. V 1000 21. 5 27. 3 2000 21. 5 27. 3 3000 4000 5000 11. 5 21. 5 14. 9 16. 0 7000 14. 9 16. 0 9000 50. 0 35. 0 6000 8000 34. 7 27. 5 11. 5 15. 1 17. 0 10000 11000 Range of each measurement for CH 3 I 38. 1 35. 0 38. 0 41. 0
TPES: Why are these positive and negative spikes? : 6. 9. 2017: files 5000… 10. 9. 2017: files: 6000… 10. 9. 2017: files: 7000… 11. 9. 2017: files: 10000… ? e. V https: //notendur. hi. is//~agust/rannsoknir/SLS/PXP-170914. pxp; Gr 1, Lay 0
CH 3 I BD curves Files: 5000… Date: 06. 09. 2017 Factor = 0. 33 H+ C+ CH 2+ CH 3+ e. V https: //notendur. hi. is//~agust/rannsoknir/SLS/PXP-170914. pxp; Gr 2, Lay 1
CH 3 I BD curves Files: 5000… Date: 06. 09. 2017 Factor = 0. 33 I+ HI+ CHI+ CH 2 I+ CH 3 I+ e. V https: //notendur. hi. is//~agust/rannsoknir/SLS/PXP-170914. pxp; Gr 3, Lay 2
CH 3 I BD curves Files: 6000… Date: 10. 09. 2017 Factor = 0. 33 H+ C+ CH 2+ CH 3+ e. V https: //notendur. hi. is//~agust/rannsoknir/SLS/PXP-170914. pxp; Gr 4, Lay 3
CH 3 I BD curves Files: 6000… Date: 10. 09. 2017 Factor = 0. 33 I+ HI+ CHI+ CH 2 I+ CH 3 I+ e. V https: //notendur. hi. is//~agust/rannsoknir/SLS/PXP-170914. pxp; Gr 5 Lay 4
CH 3 I BD curves Files: 7000… Date: 10. 09. 2017 Factor = 0. 33 H+ C+ CH 2+ CH 3+ e. V https: //notendur. hi. is//~agust/rannsoknir/SLS/PXP-170914. pxp; Gr 6, Lay 6
CH 3 I BD curves Files: 7000… Date: 10. 09. 2017 Factor = 0. 33 I+ HI+ CHI+ CH 2 I+ CH 3 I+ e. V https: //notendur. hi. is//~agust/rannsoknir/SLS/PXP-170914. pxp; Gr 7 Lay 7
CH 3 I BD curves Files: 9000… Date: 11. 09. 2017 Factor = 0. 33 H+ C+ CH 2+ CH 3+ e. V https: //notendur. hi. is//~agust/rannsoknir/SLS/PXP-170914. pxp; Gr 8, Lay 8
CH 3 I BD curves Files: 9000… Date: 11. 09. 2017 Factor = 0. 33 Possibly shift of center spot OR (Low intensity) I+ HI+ CHI+ CH 2 I+ CH 3 I+ e. V https: //notendur. hi. is//~agust/rannsoknir/SLS/PXP-170914. pxp; Gr 9 Lay 9
CH 3 I BD curves Files: 5000…: lines(6. 9. 2017) Files: 8000…: dots (11. 9. 2017); CH 3 I+, CH 2 I+ Factor = 0. 333 By going from „old data“ (files 5000. . ) to „New data“ (files 8000…) „baseline“ (unrealistic signal) of the CH 2 I+ for E<2. 25 e. V rises, whereas the signal for CH 3 I+, for E > 2. 25 e. V becomes negligible (i. e. ca. 0) e. V AK, C: …. Users/agust/SLS-17/PXP-170915. pxp; Gr 28 Lay 0
CH 3 I BD curves („New“) Files: 10000… (<38. 056 e. V) Files: 11000…(>38. 154 e. V) Date: 11. 09. 2017 Factor = 0. 33 H+ C+ CH 2+ CH 3+ e. V AK, C: …. Users/agust/SLS-17/PXP-170915. pxp; Gr 29 Lay 1 I+ HI+ CHI+ CH 2 I+ CH 3 I+
Conclusions from comparison of BD curves for „NEW“ (10. -11. 9. 2017) and OLD (6. 9. 2017) data: • OLD BD-curves are good enough • Files 8000… very noicy or high E, hence discard this data (inclusion is not an improvement) • More points recorded in files 10000. . And 11000. . compaired to that in files 4000. . (i. e. larger resolution), hence iclude this data.
1 3 4 2 6 7 5 a, b, c
CH 3 I BD curves Total: C+, CH 2+, CH 3+ Files: OLD (1000. . -5000. . ) NEW (10000. . , 11000. . ) Date: 6. 9. & 11. 09. 2017 Factor = 0. 33 C+ CH 2+ CH 3+ Double ionization effect e. V https: //notendur. hi. is//~agust/rannsoknir/SLS/PXP-170914 a. pxp; Gr 8 Lay 8 NEW(10000. . , 11000. . )
CH 3 I BD curves Total: C+, CH 2+, CH 3+ Files: OLD (1000. . -5000. . ) Date: 6. 9. & 11. 09. 2017 Factor = 0. 33 C+ CH 2+ CH 3+ Double ionization effect e. V https: //notendur. hi. is//~agust/rannsoknir/SLS/PXP-170914. pxp; Gr 8 Lay 8 Without NEW
CH 3 I BD curves Total: C+, CH 2+, CH 3+ Files: OLD (1000. . -5000. . ) Date: 6. 9. & 11. 09. 2017 Factor = 0. 33 C+ CH 2+ CH 3+ Double ionization effect e. V https: //notendur. hi. is//~agust/rannsoknir/SLS/PXP-170914 a. pxp; Gr 8 Lay 8
Meeting with AB, 15. 9. 2017: • Dont trust anything!: position of peaks could vary slightly from one experiment to another. • i 2 settings: dont fiddle with ring and circle/center for the ions.
Where is the data(? ):