
Ch 20 The Heart Describe the organization of
Ch. 20 The Heart • Describe the organization of the cardiovascular system. • Discuss the differences between nodal cells and conducting cells and describe the components and functions of the conducting system of the heart. • Identify the electrical events associated with a normal electrocardiogram. • Explain the events of the cardiac cycle • Define cardiac output, heart rate and stroke volume and describe the factors that influence these variables. • Explain how adjustments in stroke volume and cardiac output are coordinated at different levels of activity. Copyright © 2004 Pearson Education, Inc. , publishing as Benjamin Cummings
SECTION 20 -1: Organization of the Cardiovascular System • Pulmonary circuit • blood to and from the lungs • System circuit • blood to and from the rest of the body • Vessels carry the blood through the circuits • Arteries carry blood away from the heart • Veins carry blood to the heart • Capillaries permit exchange Copyright © 2004 Pearson Education, Inc. , publishing as Benjamin Cummings
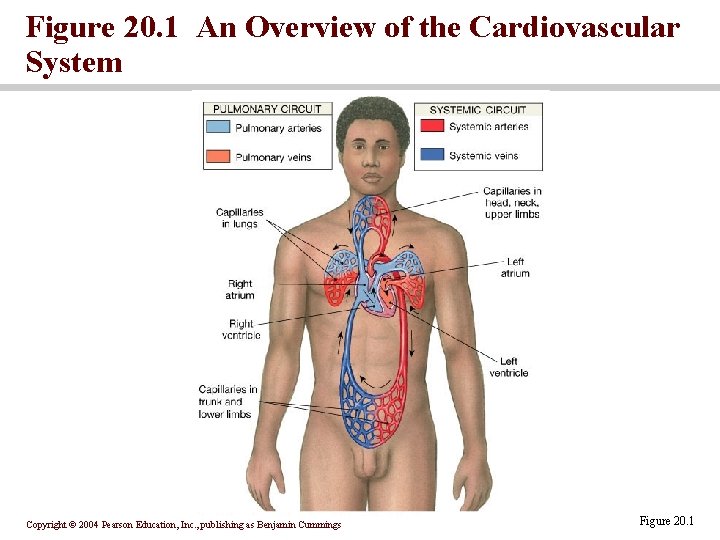
Figure 20. 1 An Overview of the Cardiovascular System Copyright © 2004 Pearson Education, Inc. , publishing as Benjamin Cummings Figure 20. 1
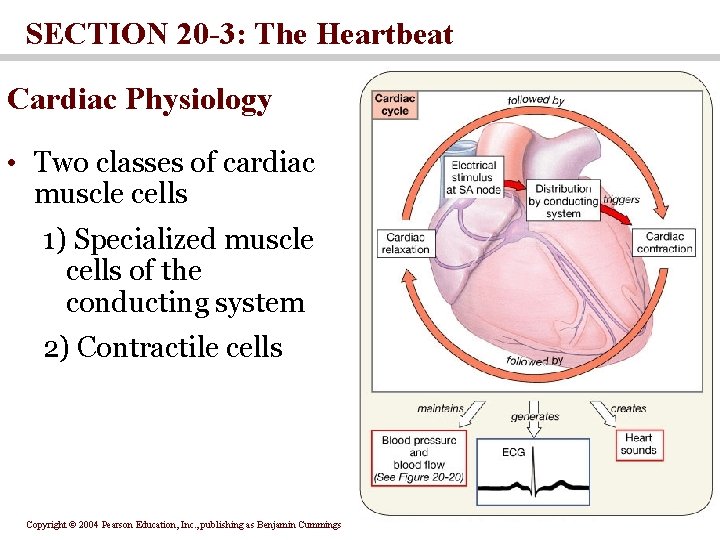
SECTION 20 -3: The Heartbeat Cardiac Physiology • Two classes of cardiac muscle cells 1) Specialized muscle cells of the conducting system 2) Contractile cells Copyright © 2004 Pearson Education, Inc. , publishing as Benjamin Cummings
The Conducting System • The conducting system includes: • Sinoatrial (SA) node • Atrioventricular (AV) node • Conducting cells • Atrial conducting cells are found in internodal pathways • Ventricular conducting cells consist of the AV bundle, bundle branches, and Purkinje fibers Copyright © 2004 Pearson Education, Inc. , publishing as Benjamin Cummings
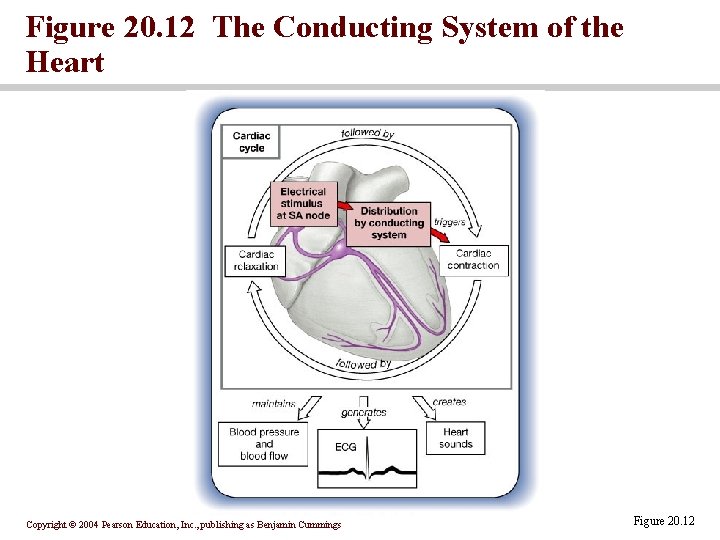
Figure 20. 12 The Conducting System of the Heart Copyright © 2004 Pearson Education, Inc. , publishing as Benjamin Cummings Figure 20. 12
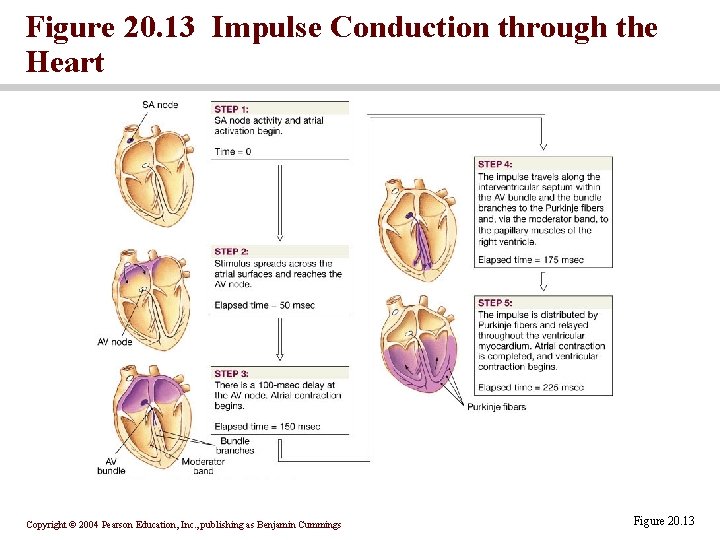
Figure 20. 13 Impulse Conduction through the Heart Copyright © 2004 Pearson Education, Inc. , publishing as Benjamin Cummings Figure 20. 13
The electrocardiogram (ECG) • A recording of the electrical events occurring during the cardiac cycle • The P wave accompanies the depolarization of the ventricles • The QRS complex appears as the ventricles depolarize • The T wave indicates ventricular repolarization Copyright © 2004 Pearson Education, Inc. , publishing as Benjamin Cummings
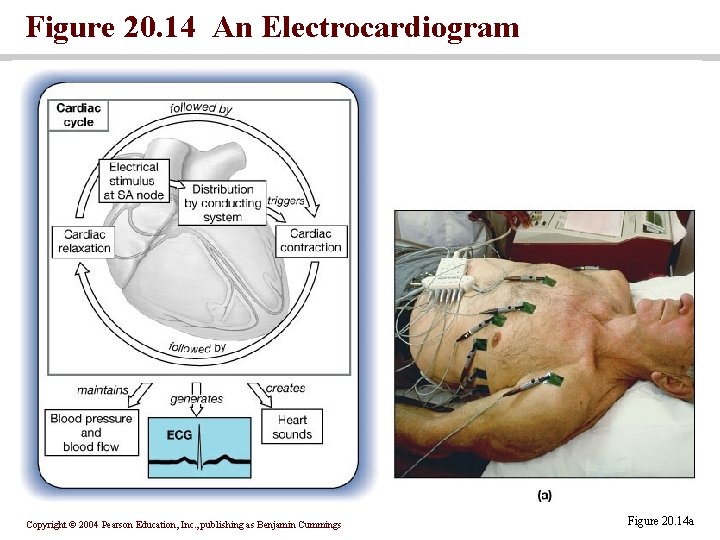
Figure 20. 14 An Electrocardiogram Copyright © 2004 Pearson Education, Inc. , publishing as Benjamin Cummings Figure 20. 14 a
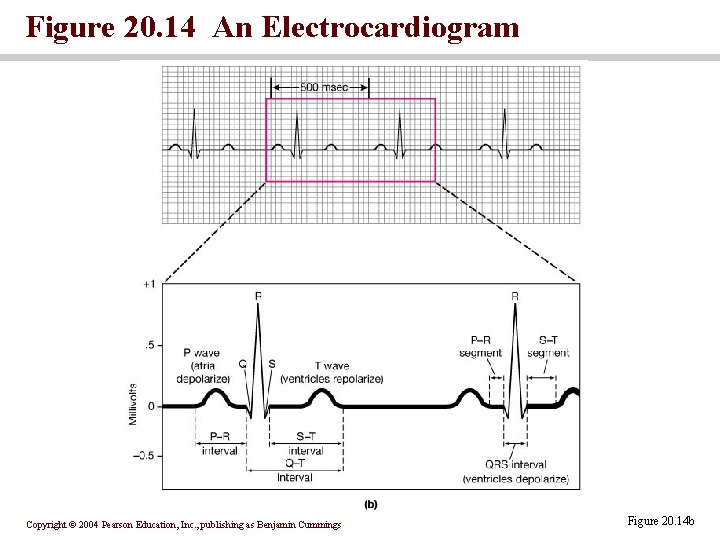
Figure 20. 14 An Electrocardiogram Copyright © 2004 Pearson Education, Inc. , publishing as Benjamin Cummings Figure 20. 14 b
Contractile Cells • Resting membrane potential of approximately – 90 m. V • Action potential • Rapid depolarization • A plateau phase unique to cardiac muscle • Repolarization • Refractory period follows the action potential Copyright © 2004 Pearson Education, Inc. , publishing as Benjamin Cummings
Calcium Ion and Cardiac contraction • Cardiac action potentials cause an increase in Ca 2+ around myofibrils • Ca 2+ enters the cell membranes during the plateau phase • Additional Ca 2+ is released from reserves in the sarcoplasmic reticulum Copyright © 2004 Pearson Education, Inc. , publishing as Benjamin Cummings
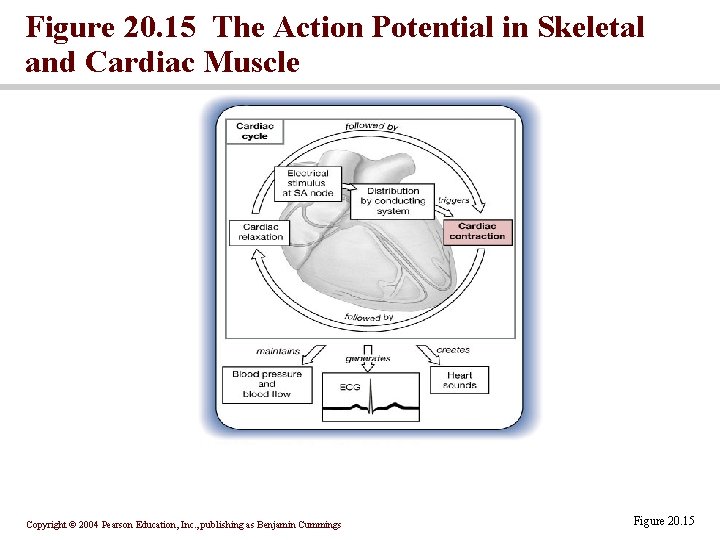
Figure 20. 15 The Action Potential in Skeletal and Cardiac Muscle Copyright © 2004 Pearson Education, Inc. , publishing as Benjamin Cummings Figure 20. 15
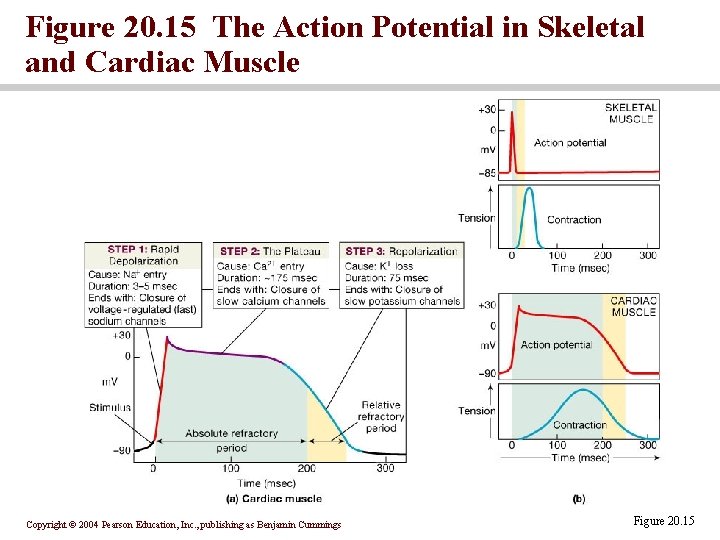
Figure 20. 15 The Action Potential in Skeletal and Cardiac Muscle Copyright © 2004 Pearson Education, Inc. , publishing as Benjamin Cummings Figure 20. 15
The cardiac cycle • The period between the start of one heartbeat and the beginning of the next • During a cardiac cycle • Each heart chamber goes through systole and diastole • Correct pressure relationships are dependent on careful timing of contractions Copyright © 2004 Pearson Education, Inc. , publishing as Benjamin Cummings
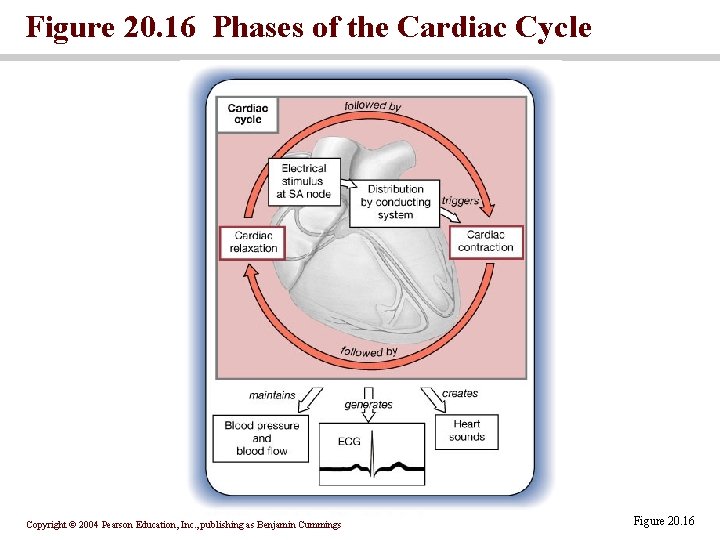
Figure 20. 16 Phases of the Cardiac Cycle Copyright © 2004 Pearson Education, Inc. , publishing as Benjamin Cummings Figure 20. 16
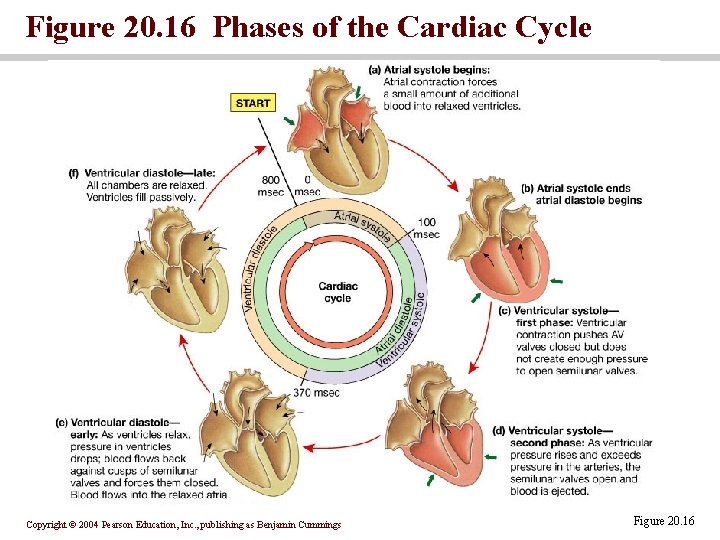
Figure 20. 16 Phases of the Cardiac Cycle Copyright © 2004 Pearson Education, Inc. , publishing as Benjamin Cummings Figure 20. 16
Pressure and volume changes atrial systole • rising atrial pressure pushes blood into the ventricle • atrial systole • the end-diastolic volume (EDV) of blood is in the ventricles ventricular systole • Isovolumetric contraction of the ventricles: ventricles are contracting but there is no blood flow • Ventricular pressure increases forcing blood through the semilunar valves Copyright © 2004 Pearson Education, Inc. , publishing as Benjamin Cummings
Pressure and volume changes: ventricular diastole • The period of isovolumetric relaxation when all heart valves are closed • Atrial pressure forces the AV valves open Copyright © 2004 Pearson Education, Inc. , publishing as Benjamin Cummings
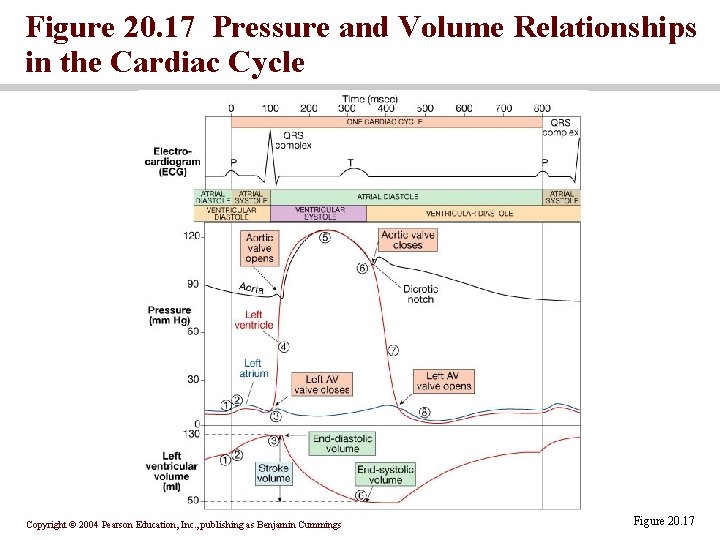
Figure 20. 17 Pressure and Volume Relationships in the Cardiac Cycle Copyright © 2004 Pearson Education, Inc. , publishing as Benjamin Cummings Figure 20. 17
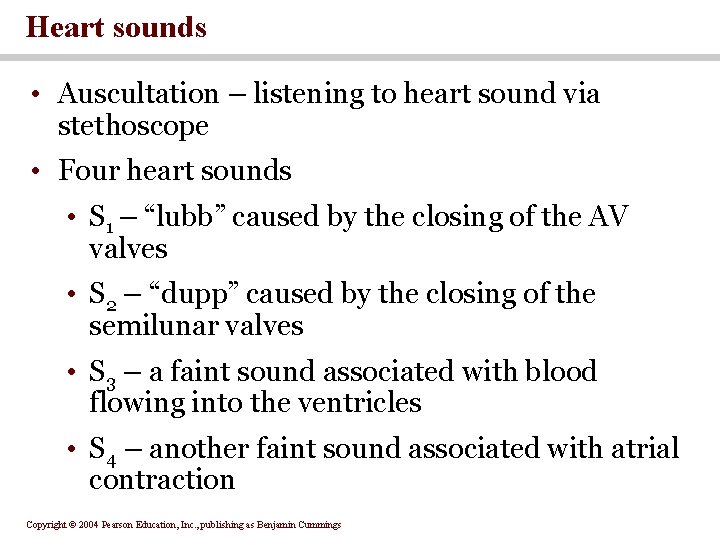
Heart sounds • Auscultation – listening to heart sound via stethoscope • Four heart sounds • S 1 – “lubb” caused by the closing of the AV valves • S 2 – “dupp” caused by the closing of the semilunar valves • S 3 – a faint sound associated with blood flowing into the ventricles • S 4 – another faint sound associated with atrial contraction Copyright © 2004 Pearson Education, Inc. , publishing as Benjamin Cummings
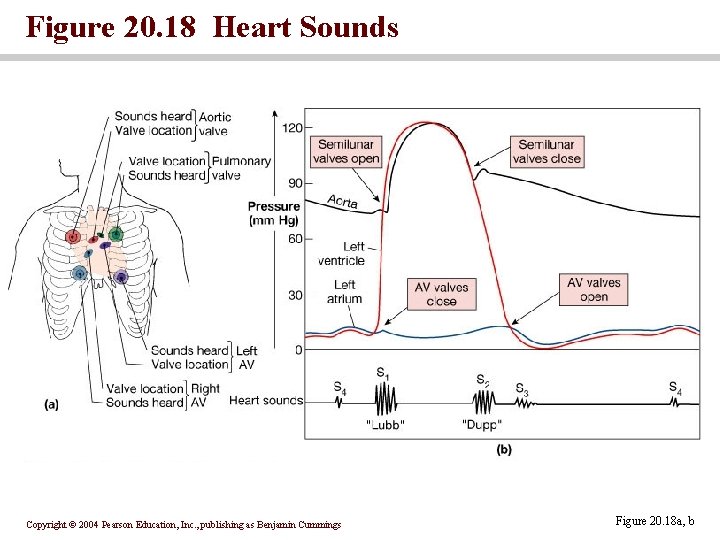
Figure 20. 18 Heart Sounds Copyright © 2004 Pearson Education, Inc. , publishing as Benjamin Cummings Figure 20. 18 a, b
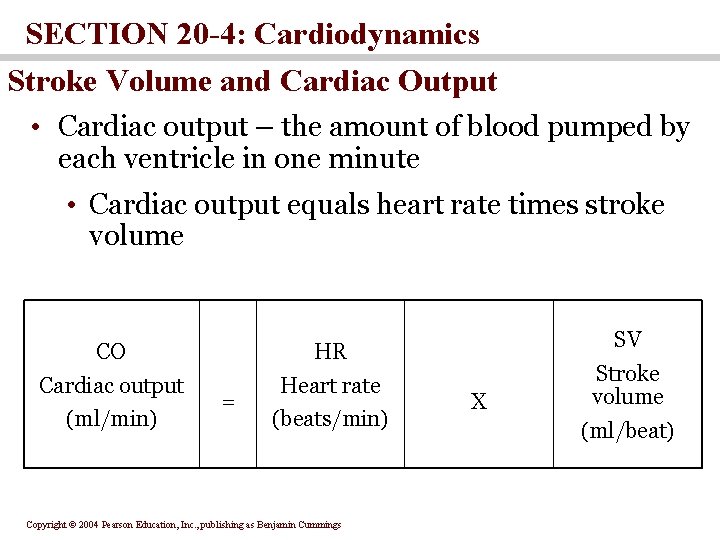
SECTION 20 -4: Cardiodynamics Stroke Volume and Cardiac Output • Cardiac output – the amount of blood pumped by each ventricle in one minute • Cardiac output equals heart rate times stroke volume CO HR Cardiac output Heart rate (ml/min) = (beats/min) Copyright © 2004 Pearson Education, Inc. , publishing as Benjamin Cummings SV X Stroke volume (ml/beat)
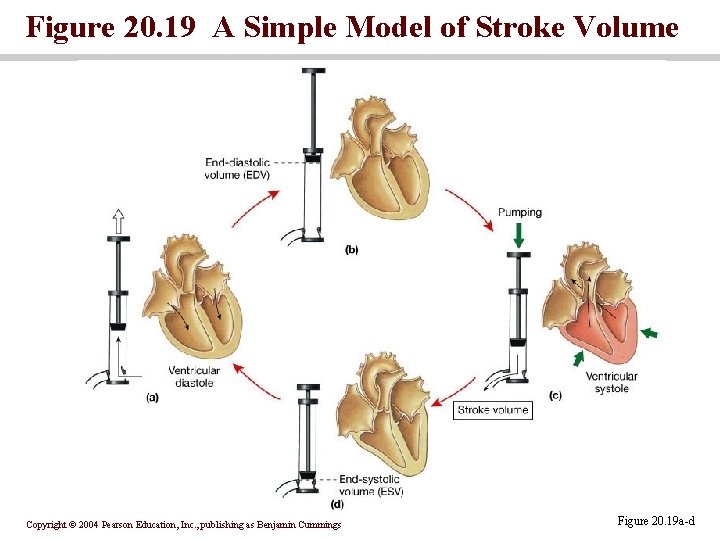
Figure 20. 19 A Simple Model of Stroke Volume Copyright © 2004 Pearson Education, Inc. , publishing as Benjamin Cummings Figure 20. 19 a-d
Factors Affecting Heart Rate • Autonomic innervation • Cardiac reflexes • Tone • SA node • Hormones • Epinephrine (E), norepinephrine(NE), and thyroid hormone (T 3) • Venous return Copyright © 2004 Pearson Education, Inc. , publishing as Benjamin Cummings
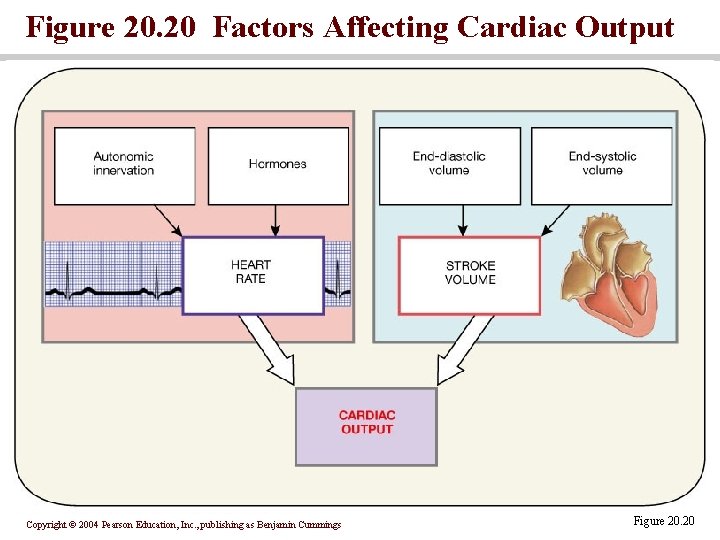
Figure 20. 20 Factors Affecting Cardiac Output Copyright © 2004 Pearson Education, Inc. , publishing as Benjamin Cummings Figure 20. 20
Medulla Oblongata centers affect autonomic innervation • Cardioacceleratory center activates sympathetic neurons • Cardioinhibitory center controls parasympathetic neurons • Receives input from higher centers, monitoring blood pressure and dissolved gas concentrations Copyright © 2004 Pearson Education, Inc. , publishing as Benjamin Cummings
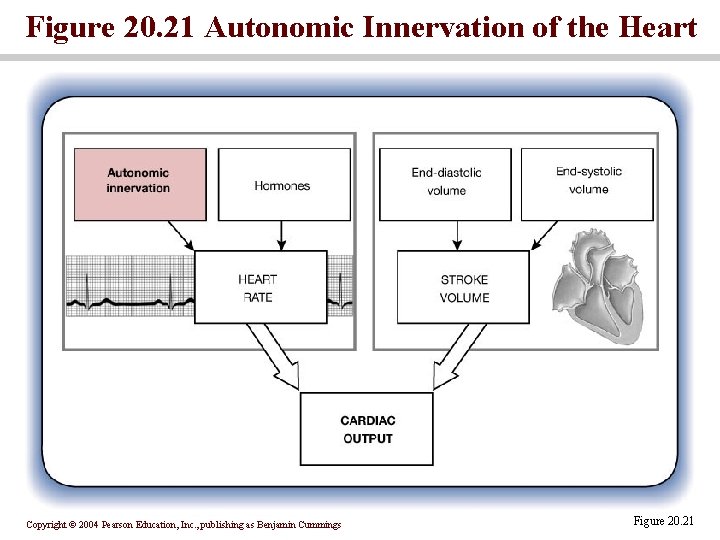
Figure 20. 21 Autonomic Innervation of the Heart Copyright © 2004 Pearson Education, Inc. , publishing as Benjamin Cummings Figure 20. 21
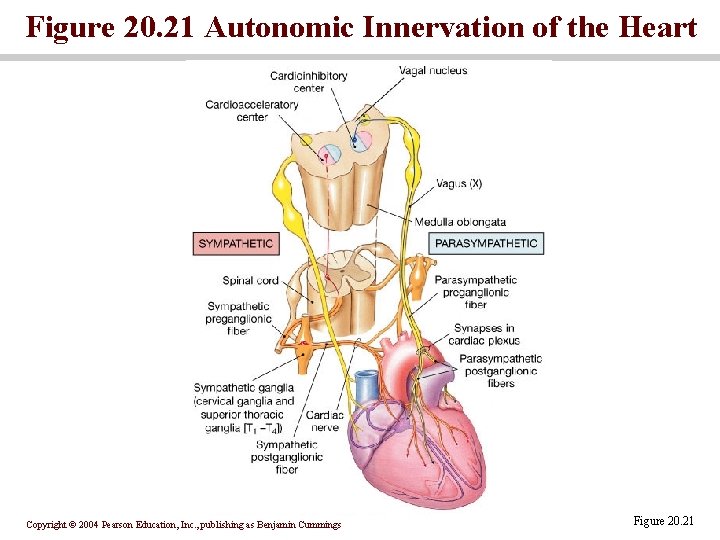
Figure 20. 21 Autonomic Innervation of the Heart Copyright © 2004 Pearson Education, Inc. , publishing as Benjamin Cummings Figure 20. 21
Basic heart rate established by pacemaker cells • SA node establishes baseline • Modified by ANS • Atrial reflex Copyright © 2004 Pearson Education, Inc. , publishing as Benjamin Cummings
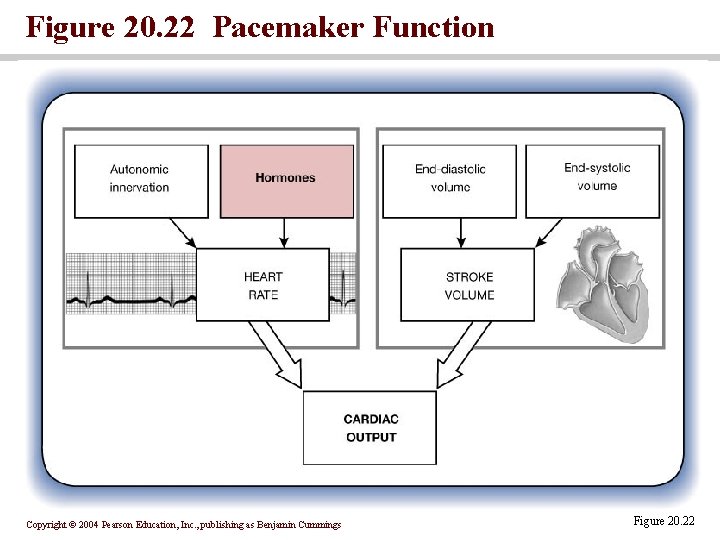
Figure 20. 22 Pacemaker Function Copyright © 2004 Pearson Education, Inc. , publishing as Benjamin Cummings Figure 20. 22
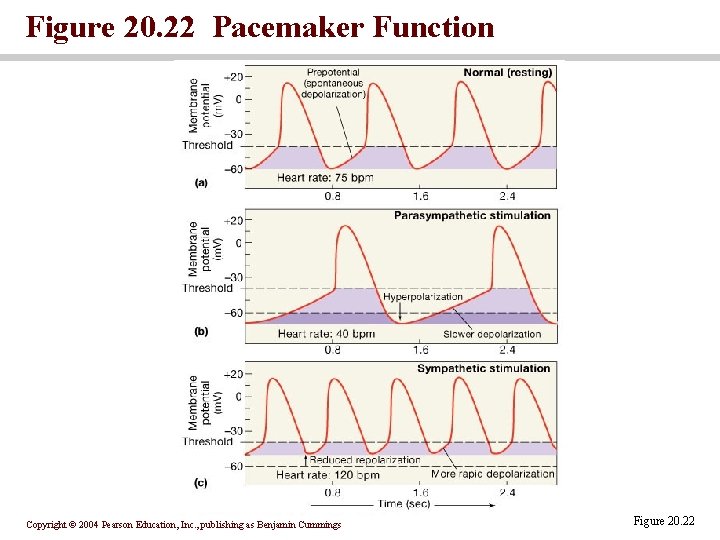
Figure 20. 22 Pacemaker Function Copyright © 2004 Pearson Education, Inc. , publishing as Benjamin Cummings Figure 20. 22
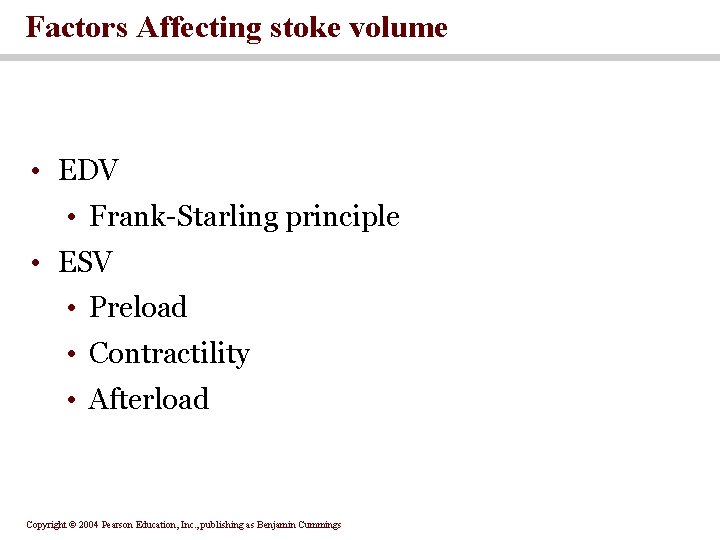
Factors Affecting stoke volume • EDV • Frank-Starling principle • ESV • Preload • Contractility • Afterload Copyright © 2004 Pearson Education, Inc. , publishing as Benjamin Cummings
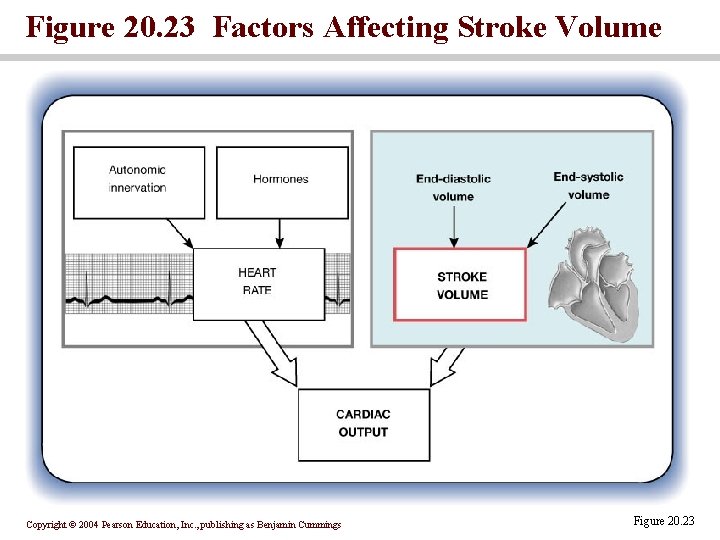
Figure 20. 23 Factors Affecting Stroke Volume Copyright © 2004 Pearson Education, Inc. , publishing as Benjamin Cummings Figure 20. 23
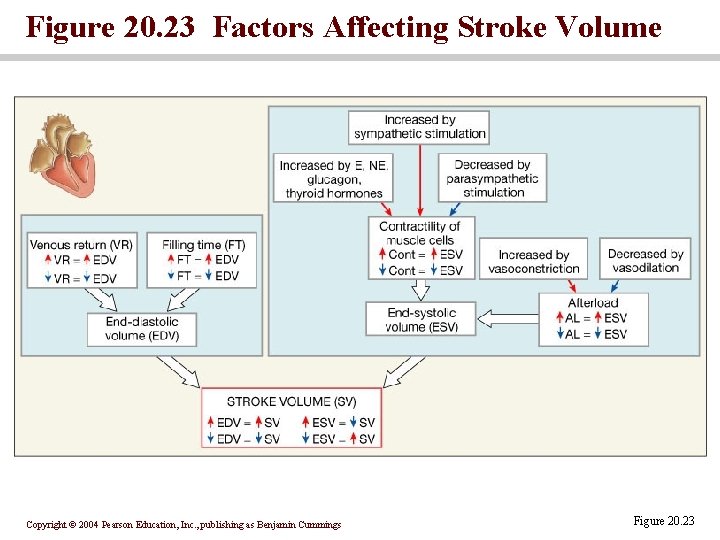
Figure 20. 23 Factors Affecting Stroke Volume Copyright © 2004 Pearson Education, Inc. , publishing as Benjamin Cummings Figure 20. 23
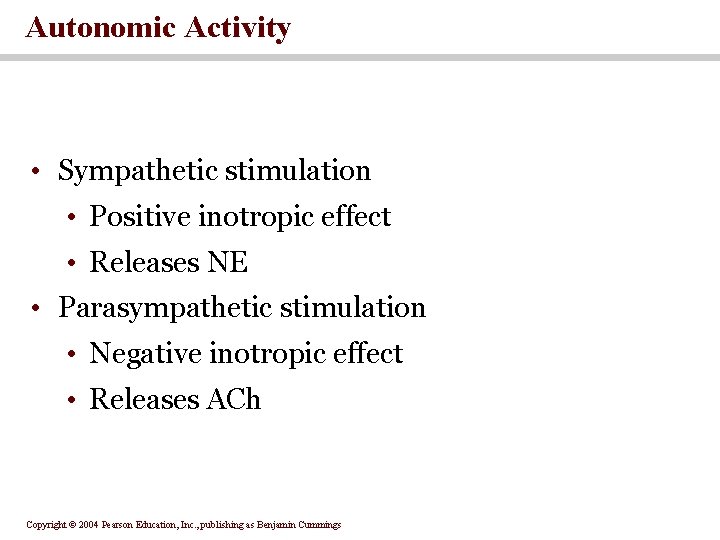
Autonomic Activity • Sympathetic stimulation • Positive inotropic effect • Releases NE • Parasympathetic stimulation • Negative inotropic effect • Releases ACh Copyright © 2004 Pearson Education, Inc. , publishing as Benjamin Cummings
Exercise and Cardiac Output • Heavy exercise can increase output by 300 -500 percent • Trained athletes may increase cardiac output by 700 percent • Cardiac reserve • The difference between resting and maximal cardiac output Copyright © 2004 Pearson Education, Inc. , publishing as Benjamin Cummings
Summary: Regulation of Heart Rate and Stroke Volume • Sympathetic stimulation increases heart rate • Parasympathetic stimulation decreases heart rate • Circulating hormones, specifically E, NE, and T 3, accelerate heart rate • Increased venous return increases heart rate • EDV is determined by available filling time and rate of venous return • ESV is determined by preload, degree of contractility, and afterload Copyright © 2004 Pearson Education, Inc. , publishing as Benjamin Cummings
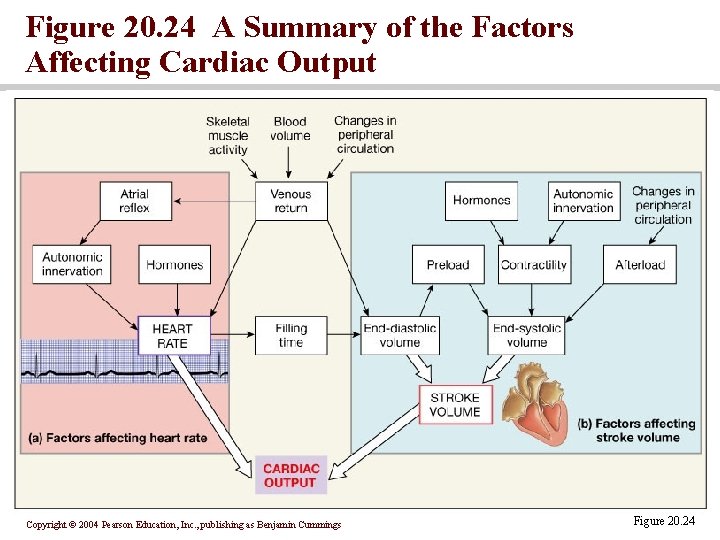
Figure 20. 24 A Summary of the Factors Affecting Cardiac Output Copyright © 2004 Pearson Education, Inc. , publishing as Benjamin Cummings Figure 20. 24
SECTION 20 -5: Heart & Cardiovascular System • The goal of the cardiovascular system is to maintain adequate blood flow to all body tissues • The heart works in conjunction with cardiovascular centers and peripheral blood vessels to achieve this goal Copyright © 2004 Pearson Education, Inc. , publishing as Benjamin Cummings
You should now be familiar with: • The organization of the cardiovascular system. • The differences between nodal cells and conducting cells as well as the components and functions of the conducting system of the heart. • The electrical events associated with a normal electrocardiogram. • The events of the cardiac cycle • Cardiac output, heart rate and stroke volume and the factors that influence these variables. • How adjustments in stroke volume and cardiac output are coordinated at different levels of activity. Copyright © 2004 Pearson Education, Inc. , publishing as Benjamin Cummings
- Slides: 41