Ch 2 Static universe 1917 A Einstein 1879
: 1917 A. Einstein (1879")
 From")


 against the colour of the stars")


- Slides: 18
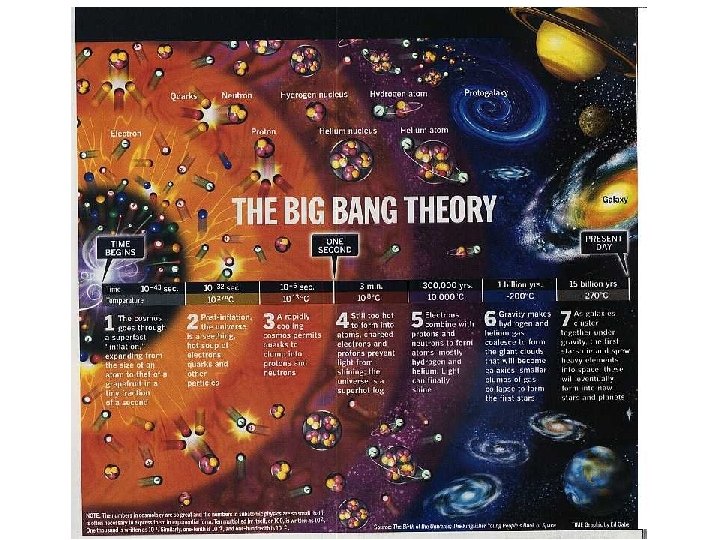
Ch. 2. 태양계와 지구 �우주의 기원 가설들: ▪ 정적우주론(Static universe): 1917 A. Einstein (1879 -1955) ▪ 팽창론(Expanding): A. Friedman (1888 -1925), G. Lemaitre (1894 -1966) ▪ 정상우주론(Steady state theory): 1948 Fred Hoyle (1915– 2001), Thomas Gold (1920 -2004), Hermann Bondi (1919 -2005) ▪ 빅뱅론(Big Bang theory): George Gamow (1904 -1968), Ralph Alpher (1921 -2007), Robert Herman (1914 -1997) 적색천이(Red shift by E. Hubble, 194) 팽창론의 증 거 우주배경복사(Cosmic microwave background radiation by A. A. Penzias (1933 -? ) & R. W. Wilson (1936 -? ) ) 빅뱅론의 간접적 증거?
(Clockwise Form top left, Einstein, Friedman, Lemaitre, Hoyle, Gamow, Hubble, Penzias, and Wilson) From www. wikipedia. org
From http: //coolcosmos. ipac. caltech. edu/cosmic_classroom/cosmic_reference/redshift. html
From http: //www. atheistnexus. org/group/originsuniverselifehumankindanddarwin/forum/topics/the-birth-of-the-universe-big? xg_source=activity
From http: //www. atheistnexus. org/group/originsuniverselifehumankindanddarwin/forum/topics/the-birth-of-the-universe-big? xg_source=activity
Hertzsprung-Russell diagram. A plot of luminosity (absolute magnitude) against the colour of the stars ranging from the high-temperature blue-white stars on the left side of the diagram to the low temperature red stars on the right side. "This diagram below is a plot of 22000 stars from the Hipparcos Catalogue together with 1000 low-luminosity stars (red and white dwarfs) from the Gliese Catalogue of Nearby Stars. The ordinary hydrogen-burning dwarf stars like the Sun are found in a band running from top-left to bottom-right called the Main Sequence. Giant stars form their own clump on the upper-right side of the diagram. Above them lie the much rarer bright giants and supergiants. At the lower-left is the band of white dwarfs these are the dead cores of old stars which have no internal energy source and over billions of years slowly cool down towards the bottom-right of the diagram. " Converted to png and compressed with pngcrush From http: //en. wikipedia. org/wiki/File: HRDiagram. png
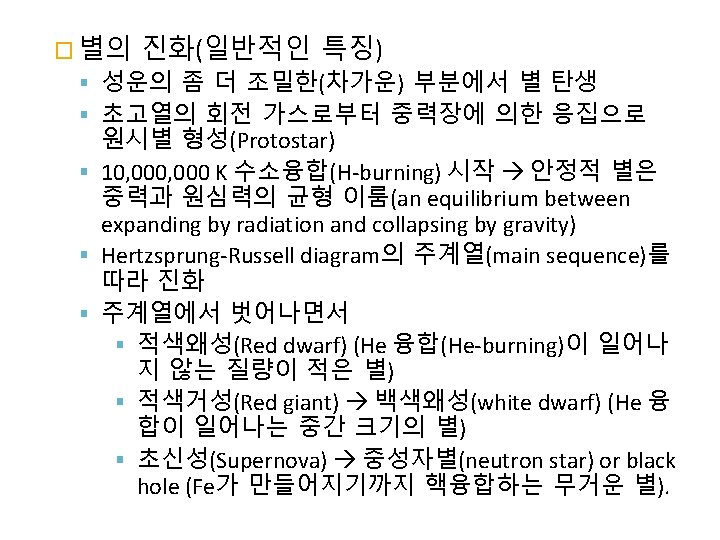
Simplified illustration of the evolution of a star with the mass of the Sun. The star forms from a collapsing cloud of gas (1), and then undergoes a contraction period as a protostar (2), before joining the main sequence (3). Once the Hydrogen at the core is consumed it expands into a red giant (4), then sheds its envelope into a planetary nebula and degenerates into a white dwarf (5). From http: //en. wikipedia. org/wiki/Stellar_evolution
The objects are progressively cooler in atmospheric temperatures as you move from left to right. Y dwarfs are the newest and coldest class of brown dwarfs to be discovered, by NASA's Wide-field Infrared Survey Explorer. The L dwarf is seen as a dim red orb to the eye. The T dwarf is even fainter and appears with a darker reddish, or magenta, hue. The Y dwarf is dimmer still. Because astronomers have not yet detected Y dwarfs at the visible wavelengths we see with our eyes, the choice of a purple hue is done mainly for artistic reasons. The Y dwarf is also illustrated as reflecting a faint amount of visible starlight from interstellar space. In this rendering, the traveler's spaceship is the same distance from each object. This illustrates an unusual property of brown dwarfs – that they all have the same dimensions, roughly the size of the planet Jupiter, regardless of their mass. This mass disparity can be as large as 15 times or more when comparing an L to a Y dwarf, despite the fact that both objects have the same radius. Caption and image credit: NASA/JPL-Caltech From http: //www. daviddarling. info/encyclopedia/B/browndwarf. html
Illustration of a gas giant orbiting a red dwarf star similar to AP Columbae. (Credit: Harvard-Smithsonian Center Astrophysics) From http: //www. australiangeographic. com. au/journal/baby-star-found-close-toearth-ap-columbae. htm
From http: //www. astronomycafe. net/qadi r/q 2958. html
From http: //cse. ssl. berkeley. edu/bmendez/ay 10/2000/cycle/whitedwarf. html Cat Eye Nebula with a white dwarf. Photo: Esa From http: //jumk. de/astronomie/about-stars/white-dwarfs. shtml
From http: //wolgemuthe. psd 401. net/Global%20 sci/05%20 -%20 astronomy/lessonplans/05 astro 00. html
From http: //imagine. gsfc. nasa. gov/docs/science/kno w_l 1/supernovae. html The Crab Nebula was a star once. It exploded as a supernova in 1054, and was so bright that it was visible during the day for 23 days and at night for two years. At its center is the Crab Pulsar: a rapidly spinning neutron star. From http: //starcraftscience. com/2010/09/13/what-is-a-supernova/
Neutron stars are believed to form in supernovae such as the one that formed the Crab Nebula (or check out this cool X-ray image of the nebula, from the Chandra X-ray Observatory). The stars that eventually become neutron stars are thought to start out with about 8 to 20 -30 times the mass of our sun. These numbers are probably going to change as supernova simulations become more precise, but it appears that for initial masses much less than 8 solar masses the star becomes a white dwarf, whereas for initial masses a lot higher than 20 -30 solar masses you get a black hole instead (this may have happened with Supernova 1987 A, although detection of neutrinos in the first few seconds of the supernova suggests that at least initially it was a neutron star). In any case, the basic idea is that when the central part of the star fuses its way to iron, it can't go any farther because at low pressures iron 56 has the highest binding energy per nucleon of any element, so fusion or fission of iron 56 requires an energy input. Thus, the iron core just accumulates until it gets to about 1. 4 solar masses (the "Chandrasekhar mass"), at which point the electron degeneracy pressure that had been supporting it against gravity gives up the ghost and collapses inward. At the very high pressures involved in this collapse, it is energetically favorable to combine protons and electrons to form neutrons plus neutrinos. The neutrinos escape after scattering a bit and helping the supernova happen, and the neutrons settle down to become a neutron star, with neutron degeneracy managing to oppose gravity. Since the supernova rate is around 1 per 30 years, and because most supernovae probably make neutron stars instead of black holes, in the 10 billion year lifetime of the galaxy there have probably been 10^8 to 10^9 neutron stars formed. One other way, maybe, of forming neutron stars is to have a white dwarf accrete enough mass to push over the Chandrasekhar mass, causing a collapse. This is speculative, though, so I won't talk about it further From http: //www. astro. umd. edu/~miller/nstar. html
A simulated Black Hole of ten solar masses as seen from a distance of 600 km with the Milky Way in the background (horizontal camera opening From http: //en. wikipedia. org/wiki/File: Black_Hole_Milkyway. jpg