
CFA South Africa Socially Responsible Investing Beyond ESG
CFA South Africa Socially Responsible Investing Beyond ESG Factors Andrew C. Canter CFA April 2009
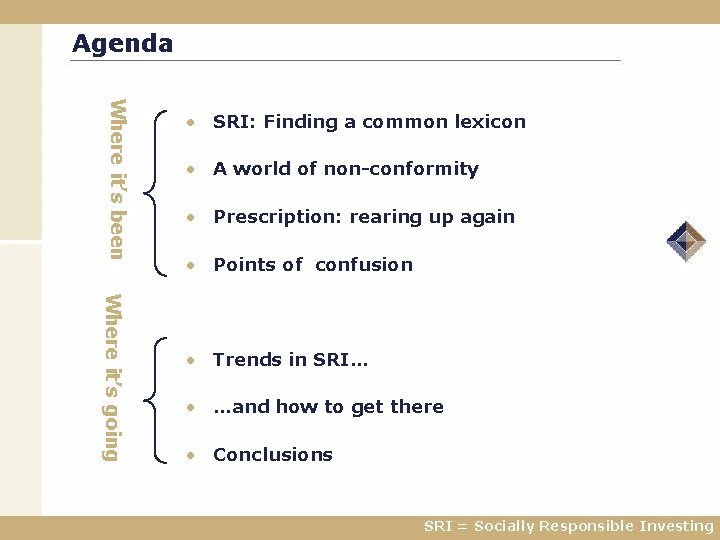
Agenda Where it’s been • SRI: Finding a common lexicon • A world of non-conformity • Prescription: rearing up again • Points of confusion Where it’s going • Trends in SRI… • …and how to get there • Conclusions SRI = Socially Responsible Investing
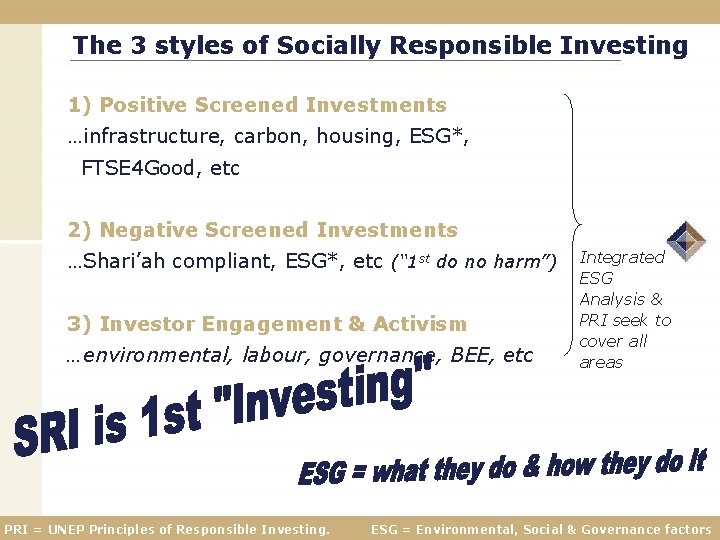
The 3 styles of Socially Responsible Investing 1) Positive Screened Investments …infrastructure, carbon, housing, ESG*, FTSE 4 Good, etc 2) Negative Screened Investments …Shari’ah compliant, ESG*, etc (“ 1 st do no harm”) 3) Investor Engagement & Activism …environmental, labour, governance, BEE, etc Integrated ESG Analysis & PRI seek to cover all areas PRI = UNEP Principles of Responsible Investing. ESG = Environmental, Social & Governance factors
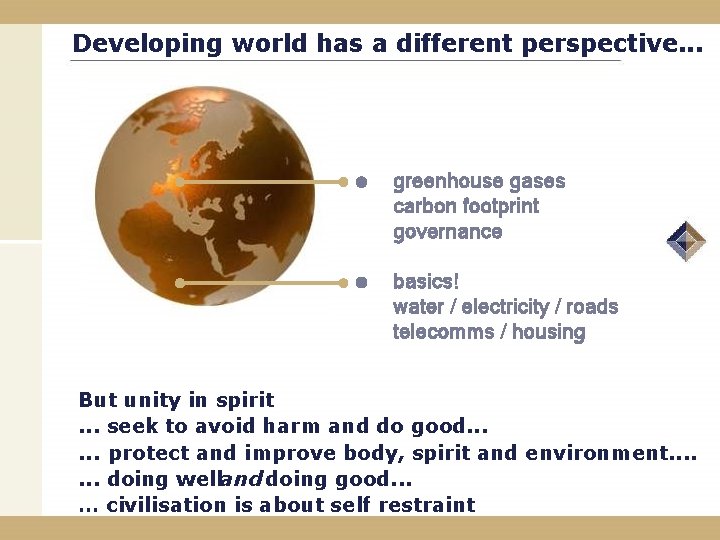
Developing world has a different perspective. . . greenhouse gases carbon footprint governance basics! water / electricity / roads telecomms / housing But unity in spirit. . . seek to avoid harm and do good. . . protect and improve body, spirit and environment. . . . doing well and doing good. . . … civilisation is about self restraint
ESG: It’s a matter of time before… … statistics will prove that “good” companies perform better over long periods… … and ESG factors become embedded in all investment decision processes. See “Does Governance Matter to Long-Term Investment Performance? ” David Beatty, CFA Institute Conference 05/2008
Interjecting some reality into ESG (1) • Narrow universe reduces portfolio efficiency. • Excludes some high ROE/cash flow sectors Unsavoury businesses have less competition • Definitions: Every firm gives it a new name • Evidence of outperformance ? • Product development vs investment process
Interjecting some reality into ESG (2) • EDHEC Business School 6 year study (2002 -2007) 124 European SRI funds: “did not identify alpha values both positive and statistically significant for SRI funds. In fact… mo obtained negative, but not statistically significant, alpha…” “it seems regrettable to us that, despite the lack o empirical evidence of… outperformance , asset management firms and consultants have larded th communications with promises of SRI fund outperformanceand failed to express the necessary reservations. ” See “Socially Responsible Investment Performance in France”, 12/2008 EDHEC Business School
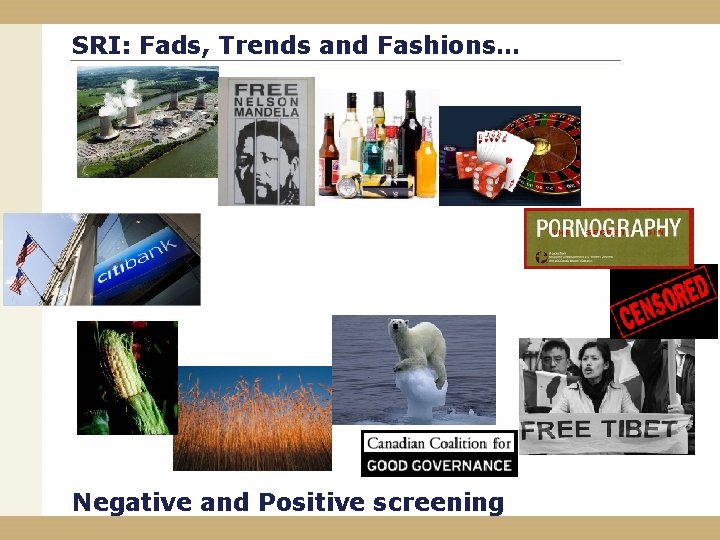
SRI: Fads, Trends and Fashions… After Before After Negative and Positive screening
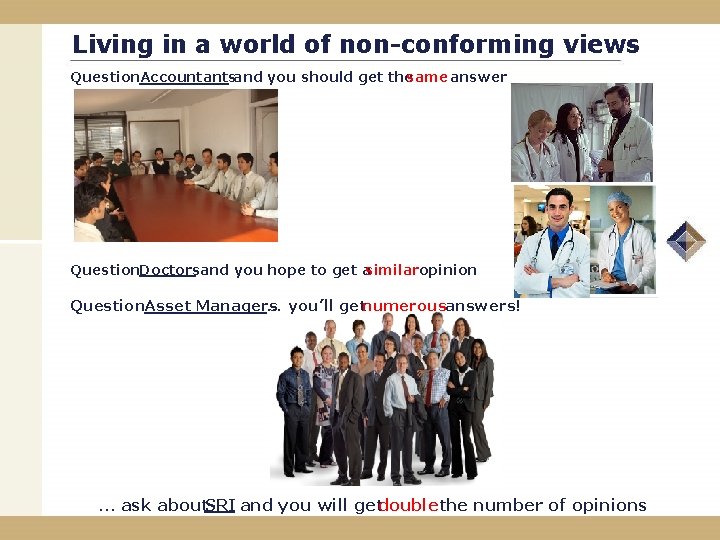
Living in a world of non-conforming views Question Accountants and you should get the same answer Question Doctors and you hope to get a similar opinion Question Asset Managers … you’ll get numerous answers! … ask about SRI and you will get double the number of opinions
Prescription: The ends do not justify the means • No SRI “standard”: Who decides what to “prescribe”? ! • Prescription distorts capital markets. . . its a “tax” on returns • If government prescribes, they must underwrite the risk! • Undermines risk: return efforts of the retirement fund industry • Seeking gov’t “regulation” of SRI is an abdication of responsibility • Government can directly influence a) the funds where they are direct stakeholders, and b) the well capitalised DFIs • Money is not the problem – capacity to deliver remains • Danger of money flood: Value will be lost by funds Reg 28: enabling vs. prescriptive: “retirement funds are encouraged to consider the broader social impact of their investments on the development of the nation” or “retirement funds will allocate 10% of assets to SRI”
Points of Confusion
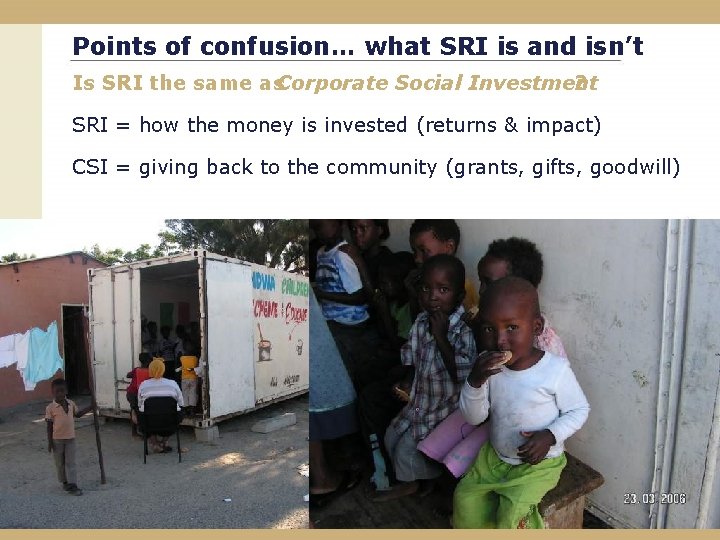
Points of confusion… what SRI is and isn’t Is SRI the same as Corporate Social Investment ? SRI = how the money is invested (returns & impact) CSI = giving back to the community (grants, gifts, goodwill)
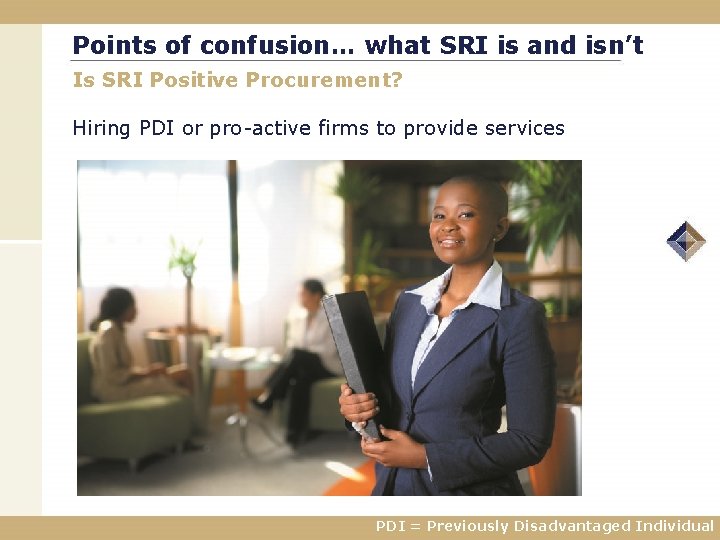
Points of confusion… what SRI is and isn’t Is SRI Positive Procurement? Hiring PDI or pro-active firms to provide services PDI = Previously Disadvantaged Individual
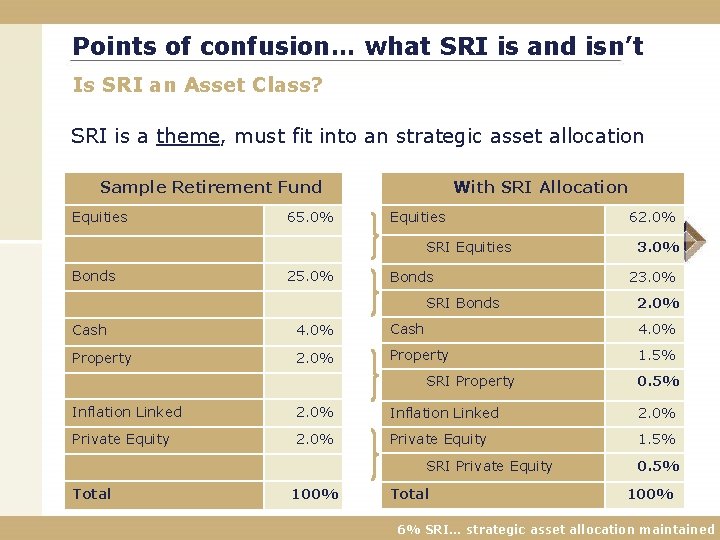
Points of confusion… what SRI is and isn’t Is SRI an Asset Class? SRI is a theme, must fit into an strategic asset allocation Sample Retirement Fund Equities 65. 0% With SRI Allocation Equities SRI Equities Bonds 25. 0% Bonds SRI Bonds 62. 0% 3. 0% 2. 0% Cash 4. 0% Property 2. 0% Property 1. 5% SRI Property 0. 5% Inflation Linked 2. 0% Private Equity 1. 5% SRI Private Equity Total 100% Total 0. 5% 100% 6% SRI… strategic asset allocation maintained
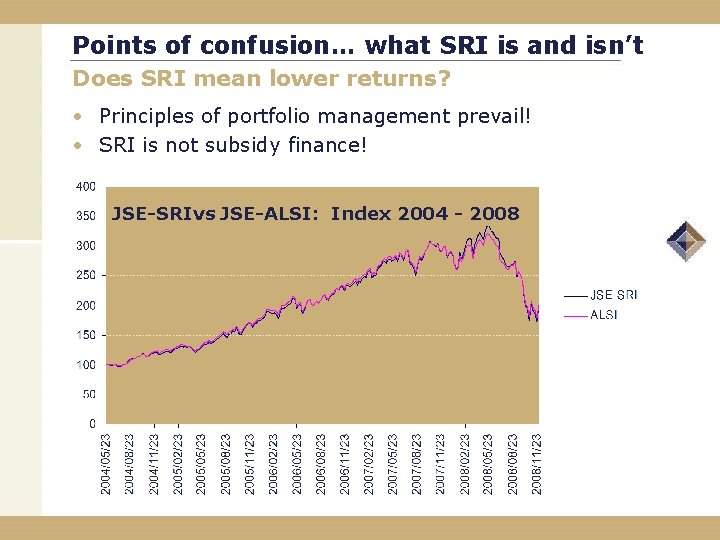
Points of confusion… what SRI is and isn’t Does SRI mean lower returns? • Principles of portfolio management prevail! • SRI is not subsidy finance! JSE-SRI vs JSE-ALSI: Index 2004 - 2008
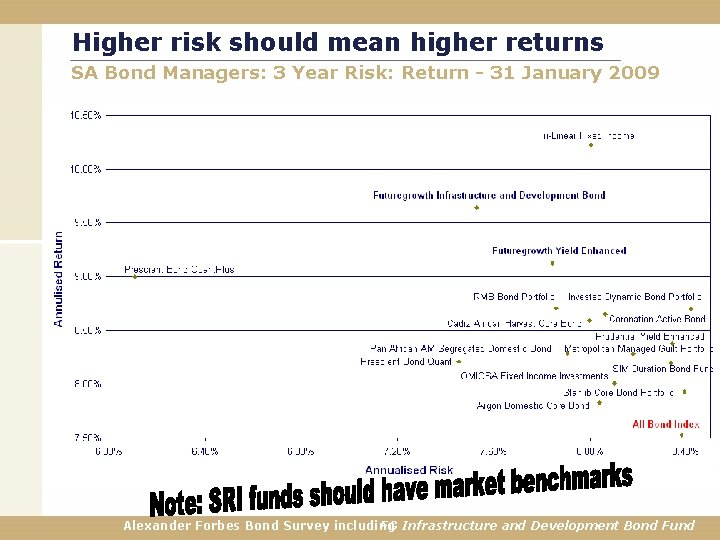
Higher risk should mean higher returns SA Bond Managers: 3 Year Risk: Return - 31 January 2009 Alexander Forbes Bond Survey including FG Infrastructure and Development Bond Fund
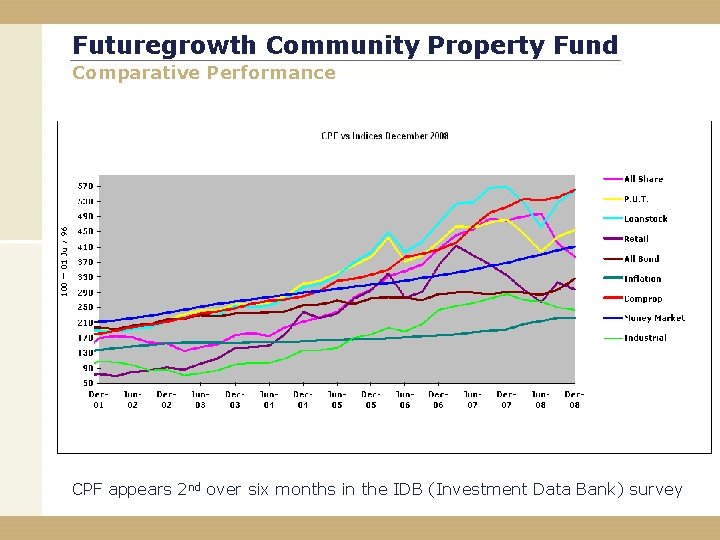
Futuregrowth Community Property Fund Comparative Performance CPF appears 2 nd over six months in the IDB (Investment Data Bank) survey
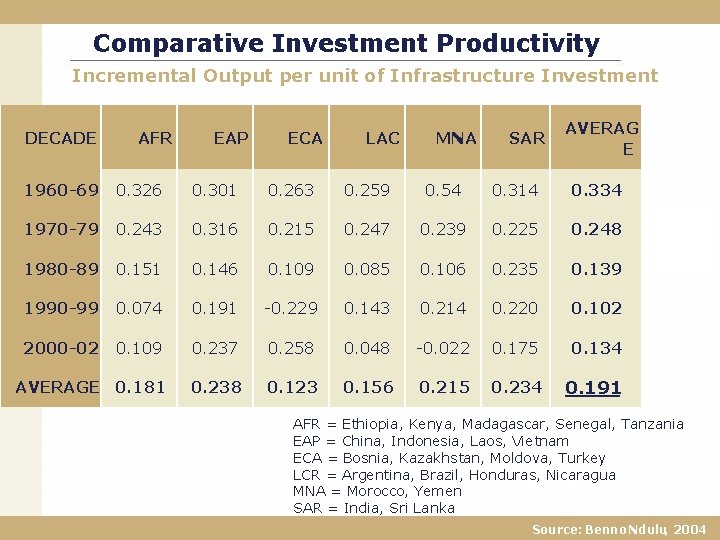
Comparative Investment Productivity Incremental Output per unit of Infrastructure Investment DECADE AFR EAP ECA LAC MNA SAR AVERAG E 1960 -69 0. 326 0. 301 0. 263 0. 259 0. 54 0. 314 0. 334 1970 -79 0. 243 0. 316 0. 215 0. 247 0. 239 0. 225 0. 248 1980 -89 0. 151 0. 146 0. 109 0. 085 0. 106 0. 235 0. 139 1990 -99 0. 074 0. 191 -0. 229 0. 143 0. 214 0. 220 0. 102 2000 -02 0. 109 0. 237 0. 258 0. 048 -0. 022 0. 175 0. 134 AVERAGE 0. 181 0. 238 0. 123 0. 156 0. 215 0. 234 0. 191 AFR = Ethiopia, Kenya, Madagascar, Senegal, Tanzania EAP = China, Indonesia, Laos, Vietnam ECA = Bosnia, Kazakhstan, Moldova, Turkey LCR = Argentina, Brazil, Honduras, Nicaragua MNA = Morocco, Yemen SAR = India, Sri Lanka Source: Benno Ndulu, 2004
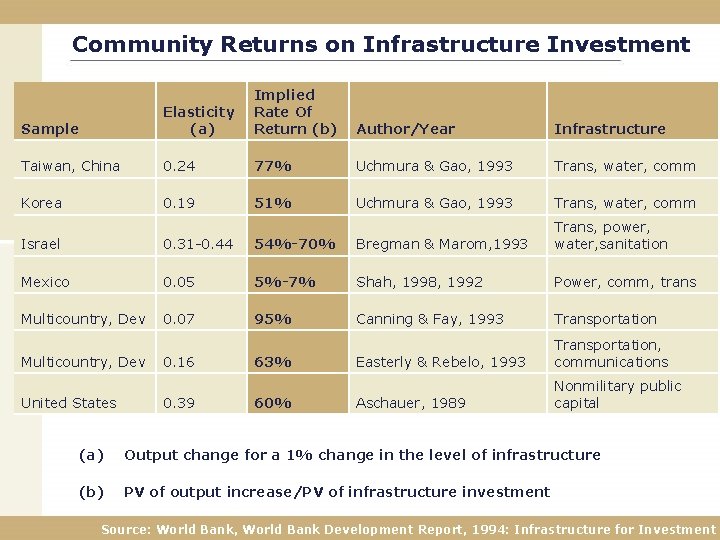
Community Returns on Infrastructure Investment Sample Elasticity (a) Implied Rate Of Return (b) Author/Year Infrastructure Taiwan, China 0. 24 77% Uchmura & Gao, 1993 Trans, water, comm Korea 0. 19 51% Uchmura & Gao, 1993 Trans, water, comm Israel 0. 31 -0. 44 54%-70% Bregman & Marom, 1993 Trans, power, water, sanitation Mexico 0. 05 5%-7% Shah, 1998, 1992 Power, comm, trans Multicountry, Dev 0. 07 95% Canning & Fay, 1993 Transportation Easterly & Rebelo, 1993 Transportation, communications Aschauer, 1989 Nonmilitary public capital Multicountry, Dev United States 0. 16 0. 39 63% 60% (a) Output change for a 1% change in the level of infrastructure (b) PV of output increase/PV of infrastructure investment Source: World Bank, World Bank Development Report, 1994: Infrastructure for Investment
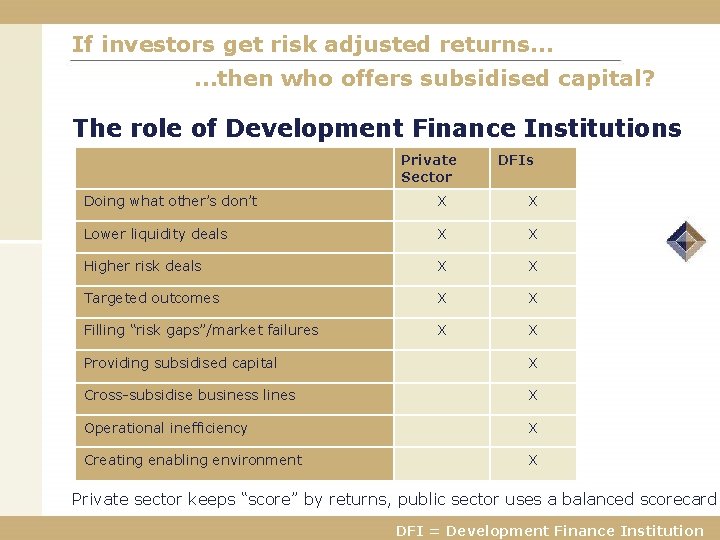
If investors get risk adjusted returns… …then who offers subsidised capital? The role of Development Finance Institutions Private Sector DFIs Doing what other’s don’t X X Lower liquidity deals X X Higher risk deals X X Targeted outcomes X X Filling “risk gaps”/market failures X X Providing subsidised capital X Cross-subsidise business lines X Operational inefficiency X Creating enabling environment X Private sector keeps “score” by returns, public sector uses a balanced scorecard DFI = Development Finance Institution
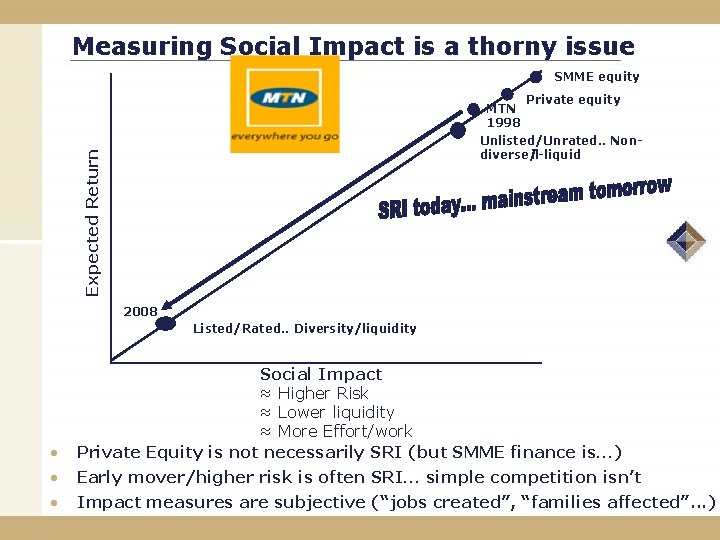
Measuring Social Impact is a thorny issue SMME equity MTN 1998 Private equity Expected Return Unlisted/Unrated. . Nondiverse/ il-liquid 2008 Listed/Rated. . Diversity/liquidity • Social Impact ≈ Higher Risk ≈ Lower liquidity ≈ More Effort/work Private Equity is not necessarily SRI (but SMME finance is…) • Early mover/higher risk is often SRI… simple competition isn’t • Impact measures are subjective (“jobs created”, “families affected”. . . )
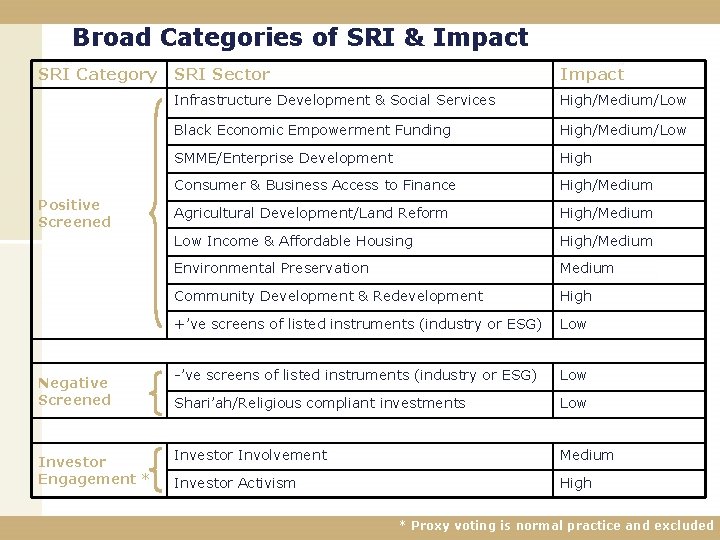
Broad Categories of SRI & Impact SRI Category Positive Screened Negative Screened Investor Engagement * SRI Sector Impact Infrastructure Development & Social Services High/Medium/Low Black Economic Empowerment Funding High/Medium/Low SMME/Enterprise Development High Consumer & Business Access to Finance High/Medium Agricultural Development/Land Reform High/Medium Low Income & Affordable Housing High/Medium Environmental Preservation Medium Community Development & Redevelopment High +’ve screens of listed instruments (industry or ESG) Low -’ve screens of listed instruments (industry or ESG) Low Shari’ah/Religious compliant investments Low Investor Involvement Medium Investor Activism High * Proxy voting is normal practice and excluded
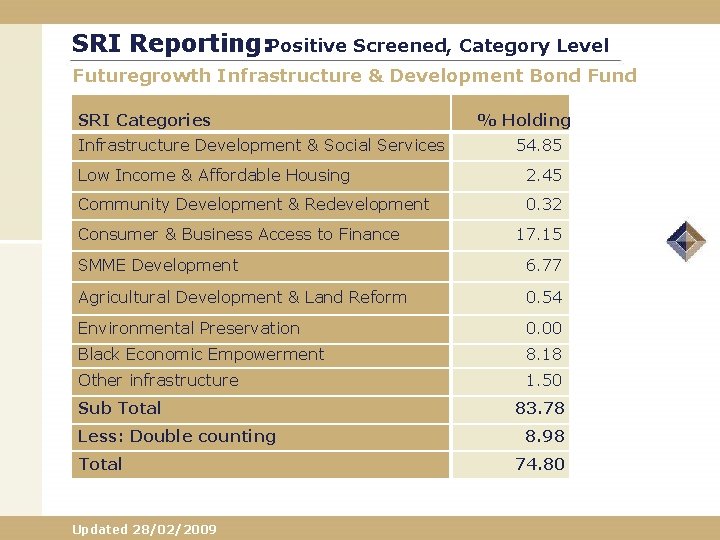
SRI Reporting: Positive Screened, Category Level Futuregrowth Infrastructure & Development Bond Fund SRI Categories Infrastructure Development & Social Services % Holding 54. 85 Low Income & Affordable Housing 2. 45 Community Development & Redevelopment 0. 32 Consumer & Business Access to Finance 17. 15 SMME Development 6. 77 Agricultural Development & Land Reform 0. 54 Environmental Preservation 0. 00 Black Economic Empowerment 8. 18 Other infrastructure 1. 50 Sub Total Less: Double counting Total Updated 28/02/2009 83. 78 8. 98 74. 80
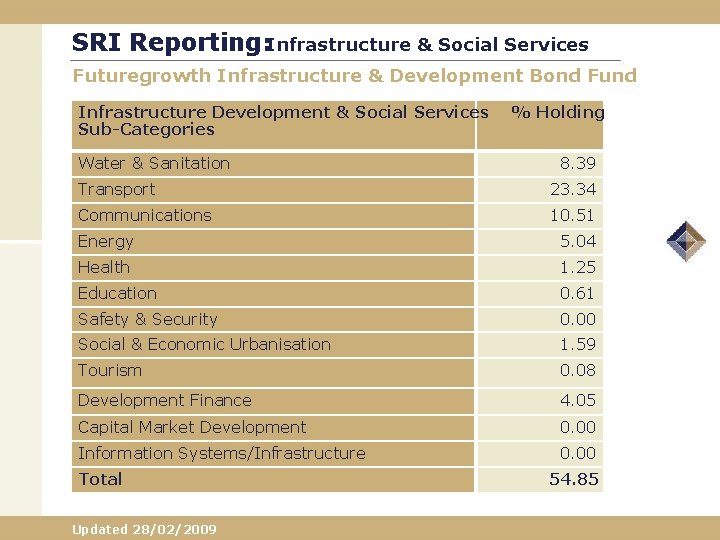
SRI Reporting: Infrastructure & Social Services Futuregrowth Infrastructure & Development Bond Fund Infrastructure Development & Social Services % Holding Sub-Categories Water & Sanitation 8. 39 Transport 23. 34 Communications 10. 51 Energy 5. 04 Health 1. 25 Education 0. 61 Safety & Security 0. 00 Social & Economic Urbanisation 1. 59 Tourism 0. 08 Development Finance 4. 05 Capital Market Development 0. 00 Information Systems/Infrastructure 0. 00 Total Updated 28/02/2009 54. 85
Where is SRI Going… …and how to get there
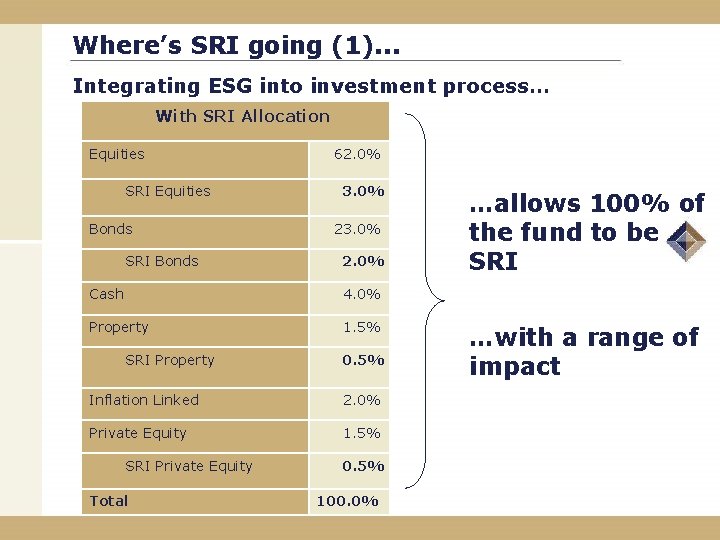
Where’s SRI going (1). . . Integrating ESG into investment process… With SRI Allocation Equities SRI Equities Bonds SRI Bonds 62. 0% 3. 0% 2. 0% Cash 4. 0% Property 1. 5% SRI Property 0. 5% Inflation Linked 2. 0% Private Equity 1. 5% SRI Private Equity Total 0. 5% 100. 0% …allows 100% of the fund to be SRI …with a range of impact
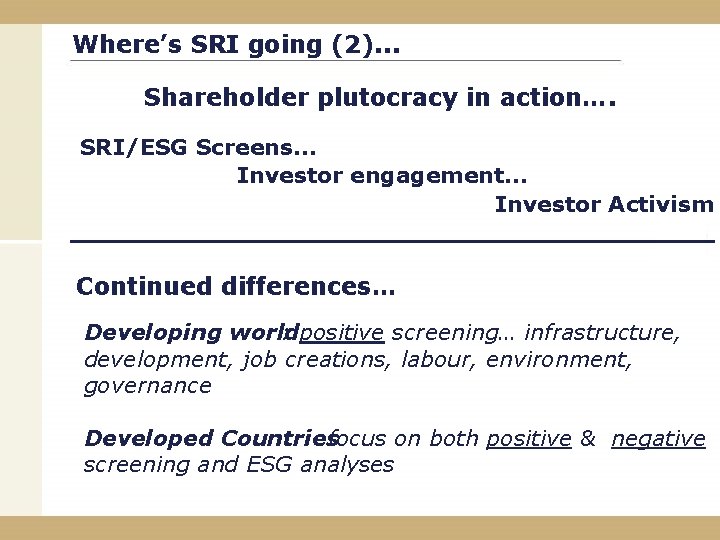
Where’s SRI going (2). . . Shareholder plutocracy in action…. SRI/ESG Screens… Investor engagement… Investor Activism Continued differences… Developing world : positive screening… infrastructure, development, job creations, labour, environment, governance Developed Countriesfocus on both positive & negative screening and ESG analyses
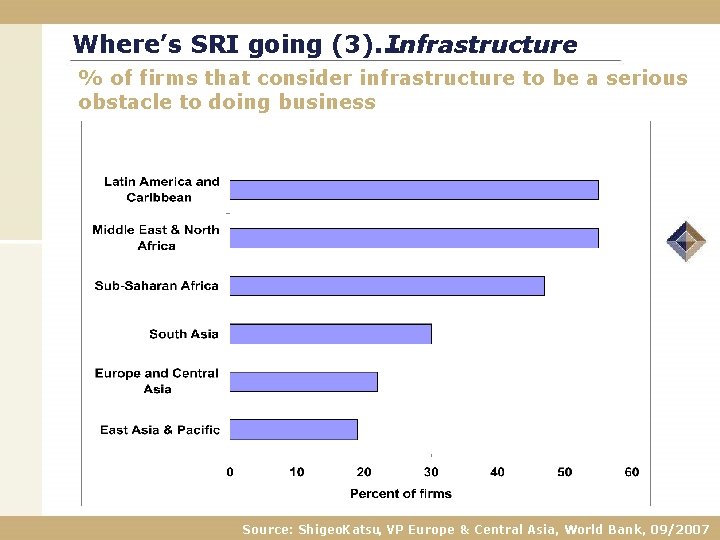
Where’s SRI going (3). . . Infrastructure % of firms that consider infrastructure to be a serious obstacle to doing business Source: Shigeo Katsu, VP Europe & Central Asia, World Bank, 09/2007
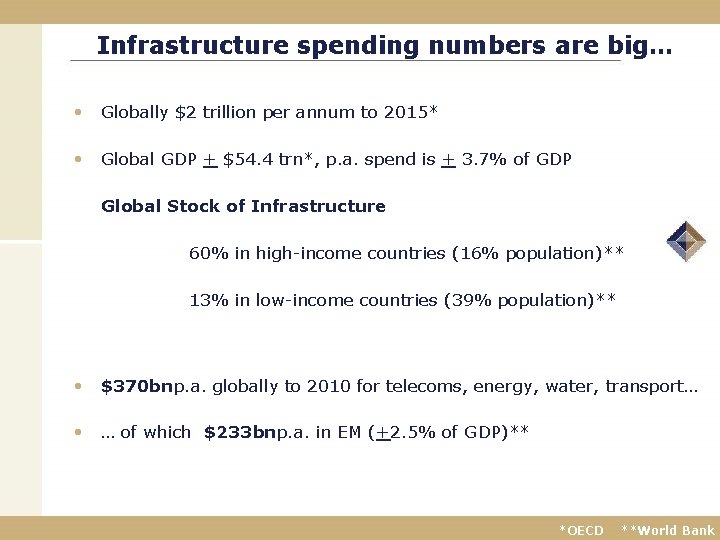
Infrastructure spending numbers are big… • Globally $2 trillion per annum to 2015* • Global GDP + $54. 4 trn*, p. a. spend is + 3. 7% of GDP Global Stock of Infrastructure 60% in high-income countries (16% population)** 13% in low-income countries (39% population)** • $370 bnp. a. globally to 2010 for telecoms, energy, water, transport… • … of which $233 bnp. a. in EM (+2. 5% of GDP)** *OECD **World Bank
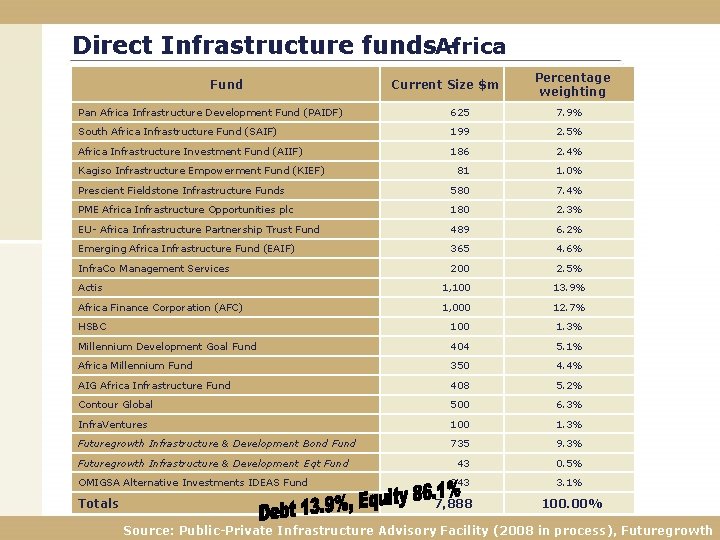
Direct Infrastructure funds - Africa Fund Current Size $m Percentage weighting Pan Africa Infrastructure Development Fund (PAIDF) 625 7. 9% South Africa Infrastructure Fund (SAIF) 199 2. 5% Africa Infrastructure Investment Fund (AIIF) 186 2. 4% 81 1. 0% Prescient Fieldstone Infrastructure Funds 580 7. 4% PME Africa Infrastructure Opportunities plc 180 2. 3% EU- Africa Infrastructure Partnership Trust Fund 489 6. 2% Emerging Africa Infrastructure Fund (EAIF) 365 4. 6% Infra. Co Management Services 200 2. 5% Kagiso Infrastructure Empowerment Fund (KIEF) Actis 1, 100 13. 9% Africa Finance Corporation (AFC) 1, 000 12. 7% HSBC 100 1. 3% Millennium Development Goal Fund 404 5. 1% Africa Millennium Fund 350 4. 4% AIG Africa Infrastructure Fund 408 5. 2% Contour Global 500 6. 3% Infra. Ventures 100 1. 3% Futuregrowth Infrastructure & Development Bond Fund 735 9. 3% 43 0. 5% 243 3. 1% Futuregrowth Infrastructure & Development Eqt Fund OMIGSA Alternative Investments IDEAS Fund Totals 7, 888 100. 00% Source: Public-Private Infrastructure Advisory Facility (2008 in process), Futuregrowth
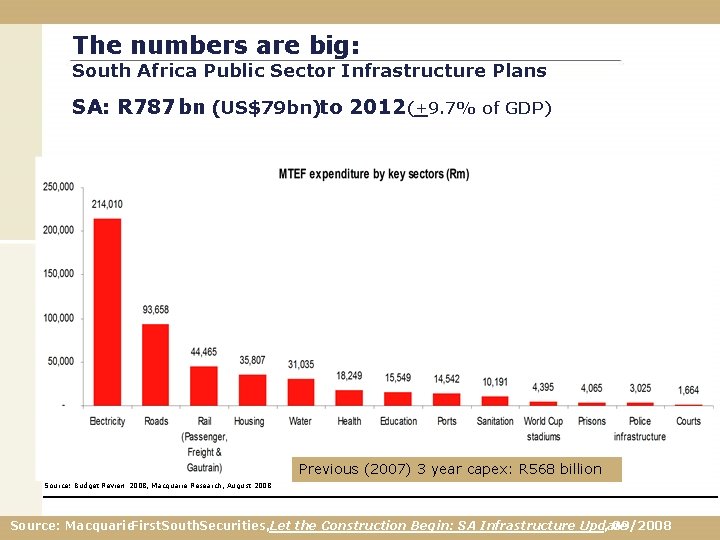
The numbers are big: South Africa Public Sector Infrastructure Plans SA: R 787 bn (US$79 bn) to 2012 (+9. 7% of GDP) Previous (2007) 3 year capex: R 568 billion Source: Budget Review 2008, Macquarie Research, August 2008 Source: Macquarie First. South Securities, Let the Construction Begin: SA Infrastructure Update , 09/2008
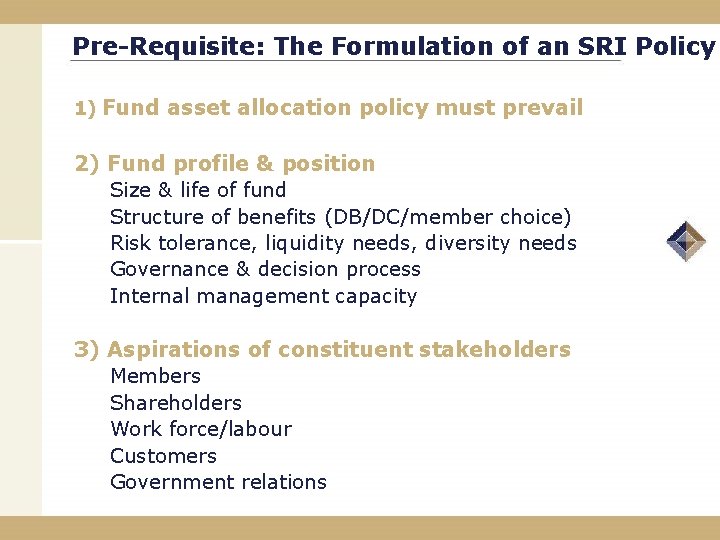
Pre-Requisite: The Formulation of an SRI Policy 1) Fund asset allocation policy must prevail 2) Fund profile & position Size & life of fund Structure of benefits (DB/DC/member choice) Risk tolerance, liquidity needs, diversity needs Governance & decision process Internal management capacity 3) Aspirations of constituent stakeholders Members Shareholders Work force/labour Customers Government relations
Formulation of SRI Policy Key Issues for SRI Policy • Set SRI Goals & Desired Impact • Adopt SRI definitions • Identify categories of SRI in which to participate • Establish risk: return guidelines • Set target percentage to SRIs (100% to 0%) • Delineate ramp-up period • Identify methods (direct, indirect) to employ • Identify measurement & reporting requirements
SRI Headlines: Funds Have a Choice… • SRI is “in the eye of the beholder”… fads & trends… • Non-Conformity of information, goals & methods: No “one size fits all” • Prescription is a non-starter… the problem isn’t money • SRI is a theme (screening/reporting), not an asset class … stick to your asset class measures … “social impact” is hard to define … SRI is always an additional analysis & decision process • Portfolio management principles prevail… • … don’t compromise your manager selection criteria • Returns & Social Impact must always be compatible • Government & DFIs do subsidised finance • Answer 1: Results happen when the investor engages! • Answer 2: Thought leadership by A. M. , consultants, clients
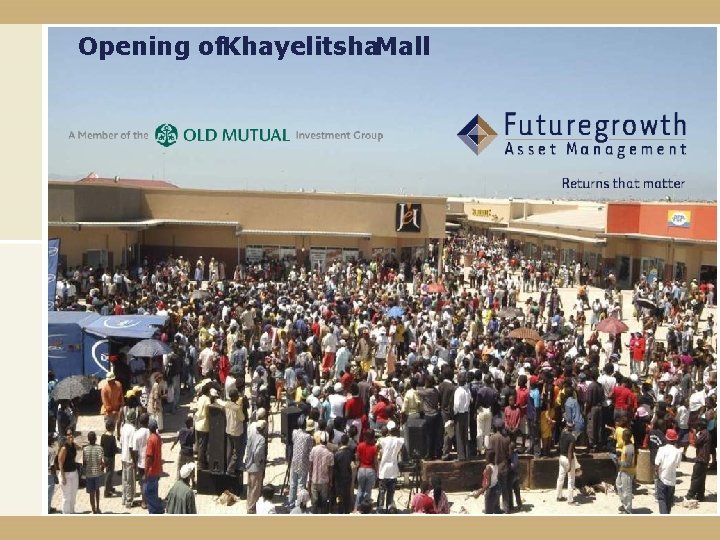
Opening of Khayelitsha Mall
Thank you
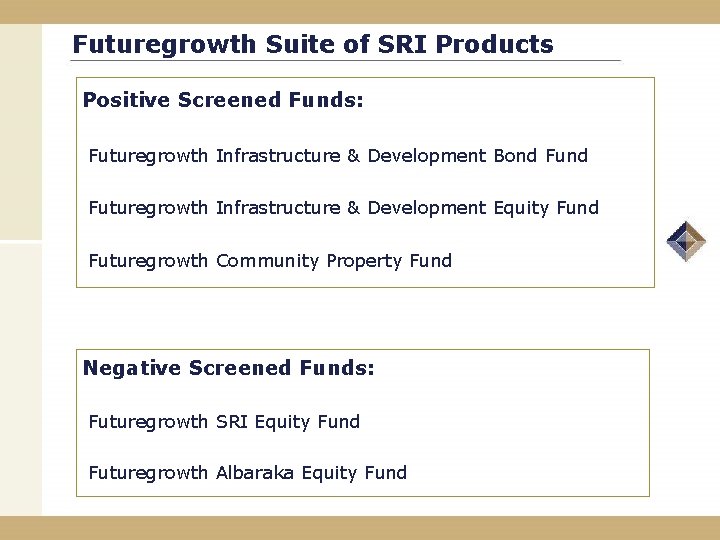
Futuregrowth Suite of SRI Products Positive Screened Funds: Futuregrowth Infrastructure & Development Bond Futuregrowth Infrastructure & Development Equity Fund Futuregrowth Community Property Fund Negative Screened Funds: Futuregrowth SRI Equity Fund Futuregrowth Albaraka Equity Fund
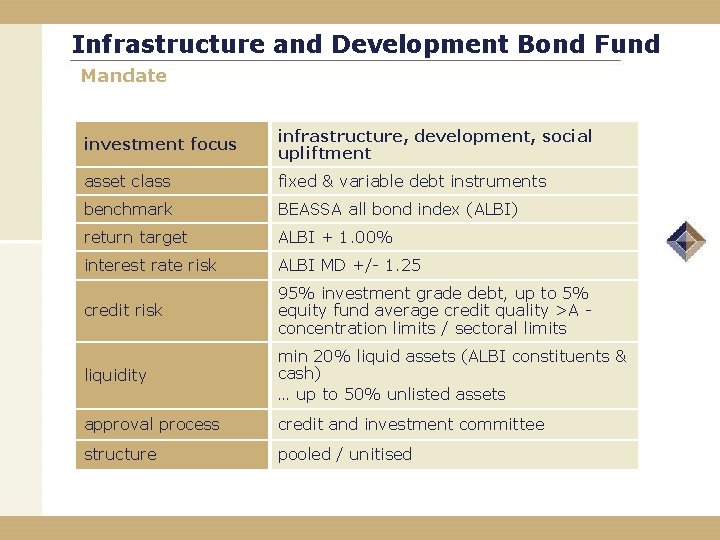
Infrastructure and Development Bond Fund Mandate investment focus infrastructure, development, social upliftment asset class fixed & variable debt instruments benchmark BEASSA all bond index (ALBI) return target ALBI + 1. 00% interest rate risk ALBI MD +/- 1. 25 credit risk 95% investment grade debt, up to 5% equity fund average credit quality >A concentration limits / sectoral limits liquidity min 20% liquid assets (ALBI constituents & cash) … up to 50% unlisted assets approval process credit and investment committee structure pooled / unitised
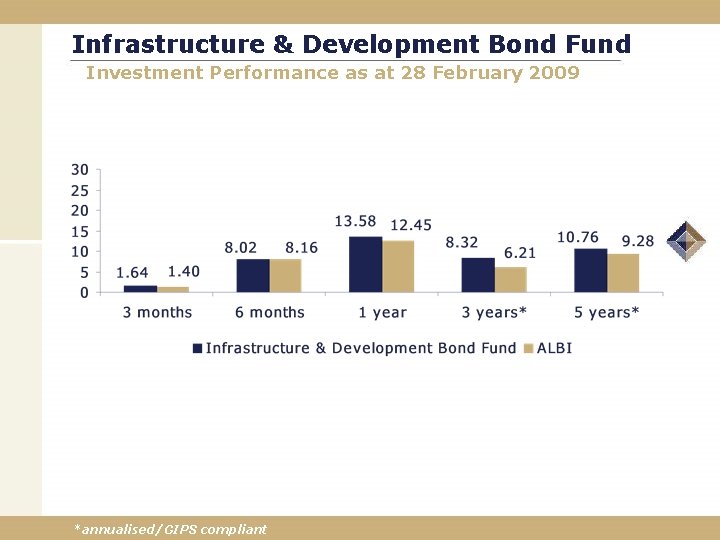
Infrastructure & Development Bond Fund Investment Performance as at 28 February 2009 *annualised/GIPS compliant
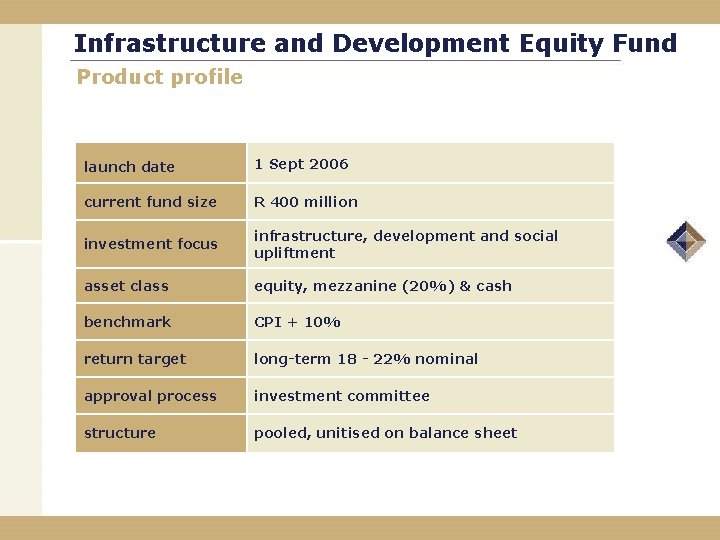
Infrastructure and Development Equity Fund Product profile launch date 1 Sept 2006 current fund size R 400 million investment focus infrastructure, development and social upliftment asset class equity, mezzanine (20%) & cash benchmark CPI + 10% return target long-term 18 - 22% nominal approval process investment committee structure pooled, unitised on balance sheet
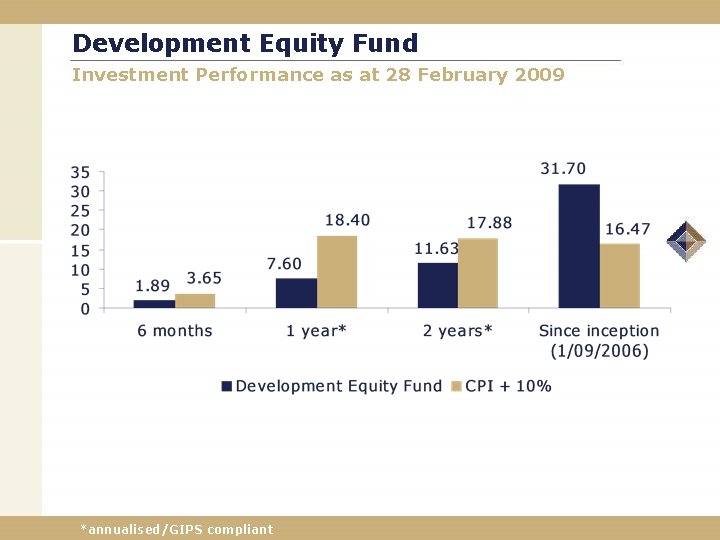
Development Equity Fund Investment Performance as at 28 February 2009 *annualised/GIPS compliant
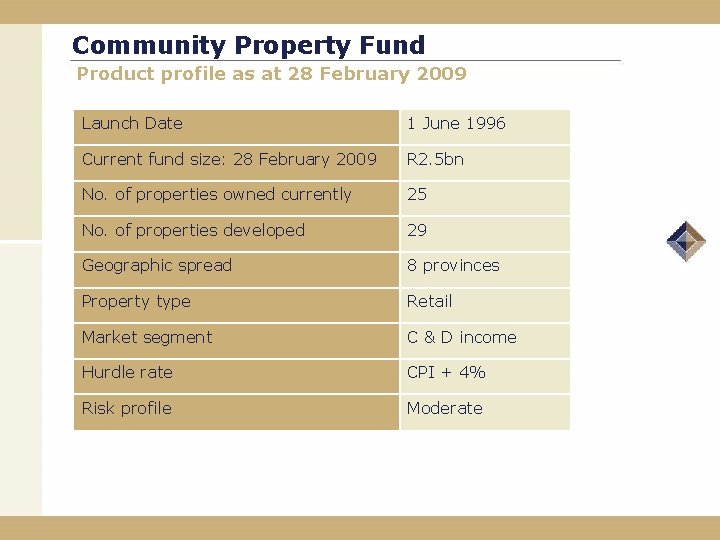
Community Property Fund Product profile as at 28 February 2009 Launch Date 1 June 1996 Current fund size: 28 February 2009 R 2. 5 bn No. of properties owned currently 25 No. of properties developed 29 Geographic spread 8 provinces Property type Retail Market segment C & D income Hurdle rate CPI + 4% Risk profile Moderate
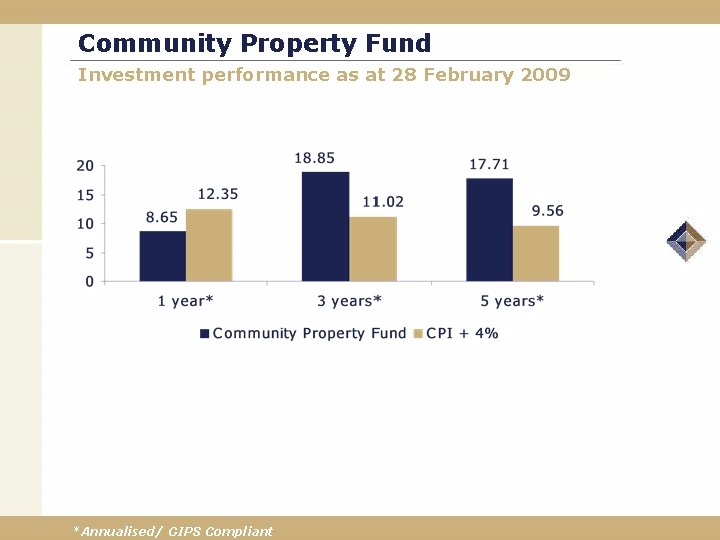
Community Property Fund Investment performance as at 28 February 2009 *Annualised/ GIPS Compliant
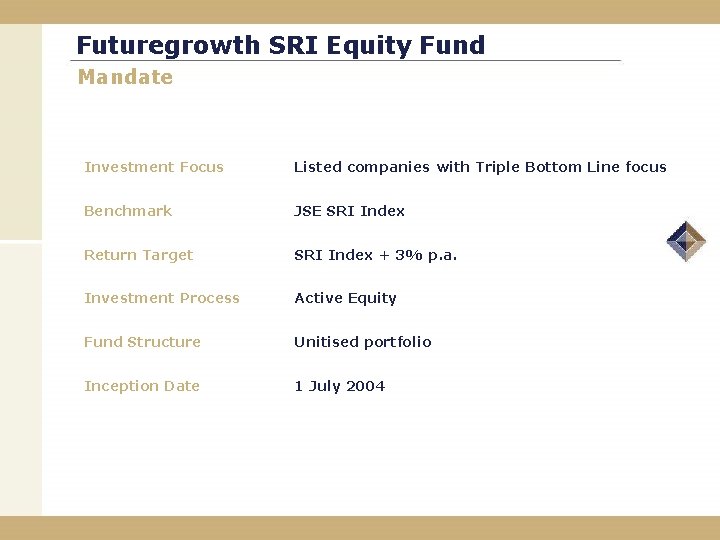
Futuregrowth SRI Equity Fund Mandate Investment Focus Listed companies with Triple Bottom Line focus Benchmark JSE SRI Index Return Target SRI Index + 3% p. a. Investment Process Active Equity Fund Structure Unitised portfolio Inception Date 1 July 2004
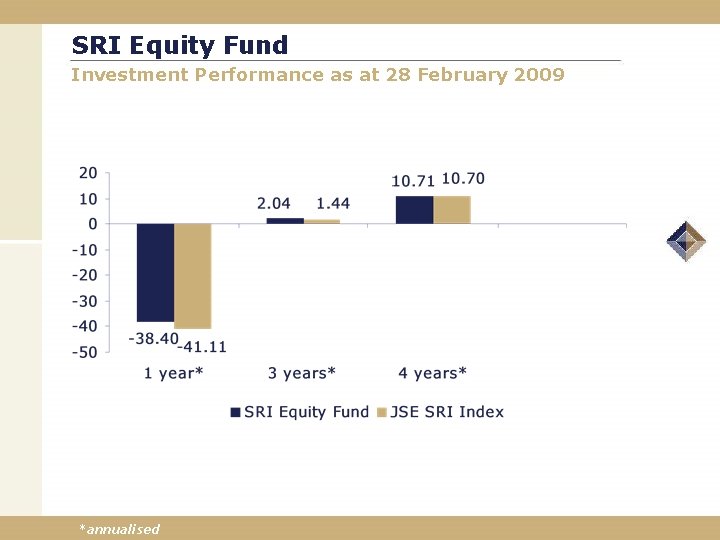
SRI Equity Fund Investment Performance as at 28 February 2009 *annualised
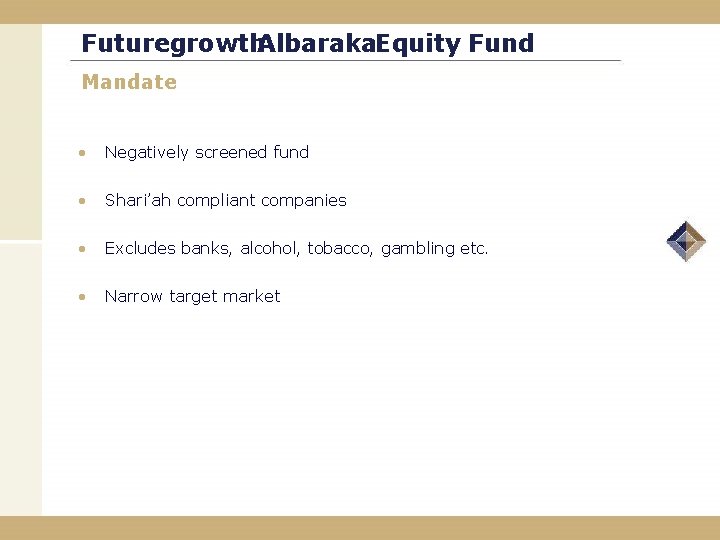
Futuregrowth Albaraka Equity Fund Mandate • Negatively screened fund • Shari’ah compliant companies • Excludes banks, alcohol, tobacco, gambling etc. • Narrow target market
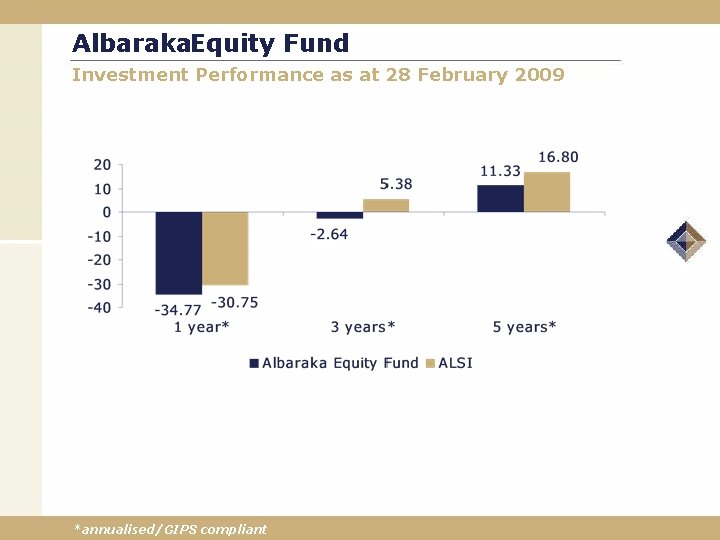
Albaraka Equity Fund Investment Performance as at 28 February 2009 *annualised/GIPS compliant
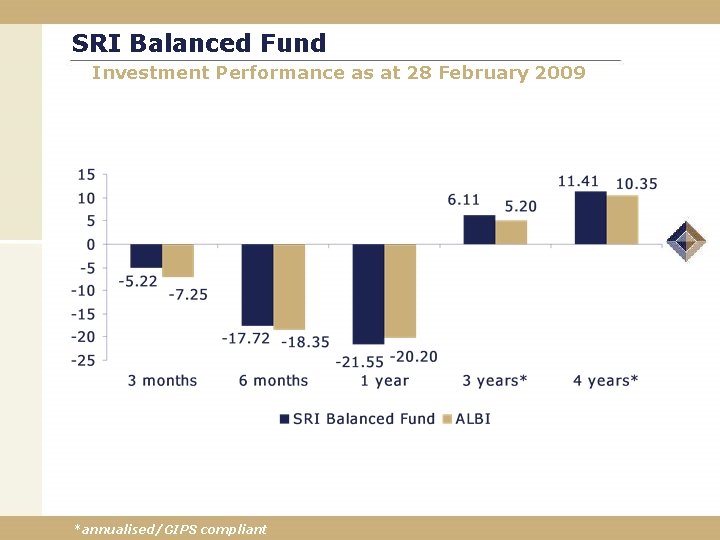
SRI Balanced Fund Investment Performance as at 28 February 2009 *annualised/GIPS compliant
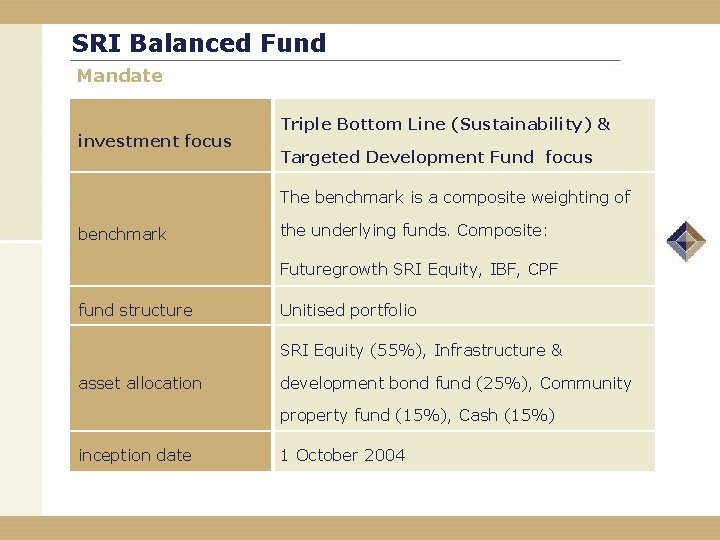
SRI Balanced Fund Mandate investment focus Triple Bottom Line (Sustainability) & Targeted Development Fund focus The benchmark is a composite weighting of benchmark the underlying funds. Composite: Futuregrowth SRI Equity, IBF, CPF fund structure Unitised portfolio SRI Equity (55%), Infrastructure & asset allocation development bond fund (25%), Community property fund (15%), Cash (15%) inception date 1 October 2004
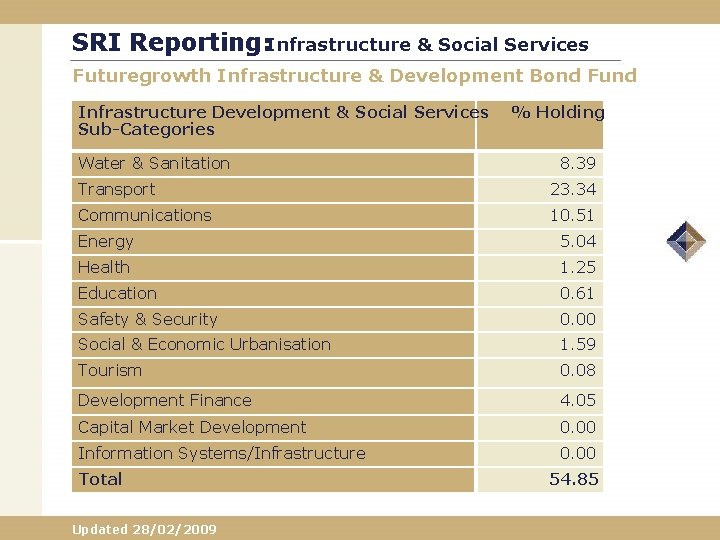
SRI Reporting: Infrastructure & Social Services Futuregrowth Infrastructure & Development Bond Fund Infrastructure Development & Social Services % Holding Sub-Categories Water & Sanitation 8. 39 Transport 23. 34 Communications 10. 51 Energy 5. 04 Health 1. 25 Education 0. 61 Safety & Security 0. 00 Social & Economic Urbanisation 1. 59 Tourism 0. 08 Development Finance 4. 05 Capital Market Development 0. 00 Information Systems/Infrastructure 0. 00 Total Updated 28/02/2009 54. 85
- Slides: 51