Central Tendency Quantitative Methods in HPELS 6210 Agenda


- Slides: 28
Central Tendency Quantitative Methods in HPELS 6210
Agenda Introduction n Mode n Median n Mean n Selection n
Introduction n Statistics of central tendency: ¨ Describe typical value within the distribution ¨ Describe the middle of the distribution ¨ Describe how values cluster around the middle of the distribution n Several statistics Appropriate measurement depends on: ¨ Scale of measurement ¨ Distribution
Introduction n The Three M’s: ¨ Mode ¨ Median ¨ Mean n Each statistic has its advantages and disadvantages
Agenda Introduction n Mode n Median n Mean n Selection n
Mode Definition: The score that occurs most frequently n Scale of measurement: n ¨ Appropriate for all scales ¨ Only statistic appropriate for nominal data n On a frequency distribution: ¨ Tallest portion of graph ¨ Category with greatest frequency
Central Tendency: Mode n Example: 2, 3, 4, 6, 7, 8, 8, 8, 9, 9, 10, 10 Mode?
Mode n Advantages ¨ Ease of determination ¨ Only statistic appropriate n for nominal data Disadvantages ¨ Unstable ¨ Terminal statistic ¨ Disregards majority of data ¨ Lack of precision (no decimals) ¨ There maybe more than one mode n Bimodal two n Multimodal > 2
Calculation of the Mode Instat Statistics tab n Summary tab n Group tab n ¨ Select “group” ¨ Select column of interest ¨ OK
Agenda Introduction n Mode n Median n Mean n Selection n
Median n n Definition: The score associated with the 50 th percentile Scale of measurement: ¨ Ordinal, n interval or ratio Methods of determination: ¨N n n = even List scores from low to high Median is the middle score = odd List scores from low to high Median = sum of two middle numbers / 2
Central Tendency: Median n Example 1: 1, 2, 3, 4, 5 n Example 2: 1, 2, 3, 4 Odd #: Median = middle number Even #: Median = middle two numbers / 2
Median n Advantages ¨ Ease of determination ¨ Effective with ordinal data ¨ Effective with skewed data n Not sensitive to extreme outliers n Examples: Housing costs n Disadvantages: ¨ Terminal statistic ¨ Not appropriate for nominal ¨ Disregards majority of data ¨ Lack of precision data
Calculation of the Median Instat Statistics tab n Summary tab n Describe tab n ¨ Choose “additional statistics” ¨ Choose “median” ¨ OK
Agenda Introduction n Mode n Median n Mean n Selection n
Mean Definition: Arithmetic average n Most common measure of central tendency n Scale of measurement: n ¨ Interval n or ratio Statistical notation: “myoo” ¨ Sample: x-bar or M ¨ Population:
Mean n Method of determination: ¨ = ΣX/N ¨ X-bar n or M = ΣX/n Advantages: ¨ Sensitive to all values ¨ Considers all data ¨ Not a terminal statistic ¨ Precision (decimals) n Disadvantages: ¨ Not appropriate with nominal or ordinal data ¨ Sensitive to extreme outliers
Calculation of the Mean Instat Same as median n Mean is calculated automatically n
Agenda Introduction n Mode n Median n Mean n Selection n
When to Use the Mode Appropriate for all scales of measurement n Use the mode with nominal data n
When to Use the Median n Appropriate with ordinal, interval and ratio data ¨ Especially effective with ordinal data DO NOT use with nominal data n Use the median with skewed data n
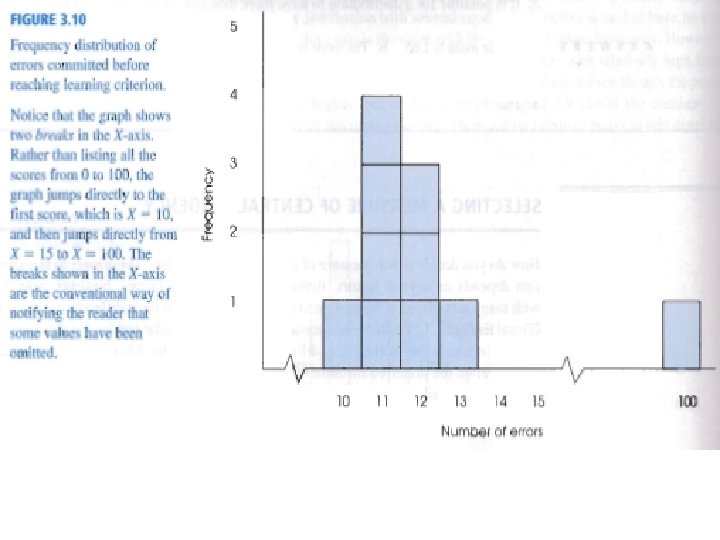
When to Use the Median n Use the median with undetermined values
When to Use the Median n Use the median with open-ended distributions
When to Use the Mean Use the mean with interval or ratio data n Use the mean when the distribution is normal or near normal n
Textbook Problem Assignment n Problems: 2, 4, 6, 8, 12, 16, 22.