CENTRAL MOMENTS SKEWNESS AND KURTOSIS Central Moments The


 Moments In mean moments, the deviations are taken from the mean.")
 Moments n Formula for Grouped Data:")


 for")


")
- Slides: 22
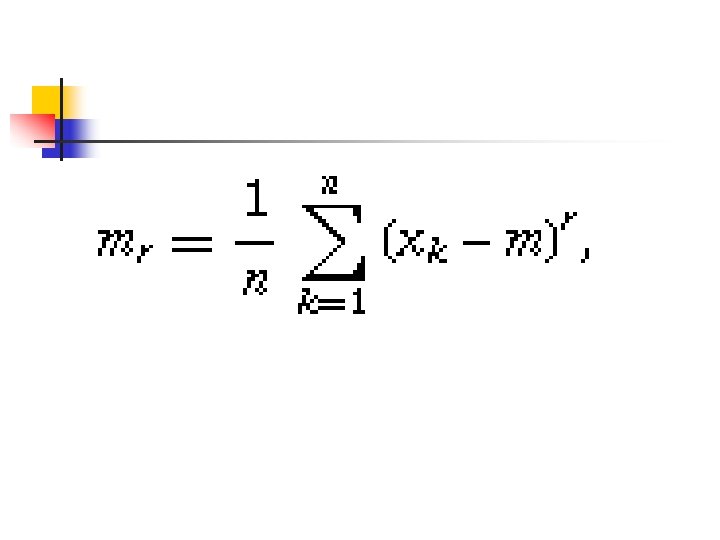
CENTRAL MOMENTS, SKEWNESS AND KURTOSIS Central Moments- The average of all the deviations of all observations in a dataset from the mean of the observations raised to the power r
In the previous equation, n is the number of observations, X is the value of each individual observation, m is the arithmetic mean of the observations, and r is a positive integer.
Central (or Mean) Moments In mean moments, the deviations are taken from the mean. For Ungrouped Data: In General,
Central (or Mean) Moments n Formula for Grouped Data:
There are 4 central moments: n n The first central moment, r=1, is the sum of the difference of each observation from the sample average (arithmetic mean), which always equals 0 The second central moment, r=2, is variance.
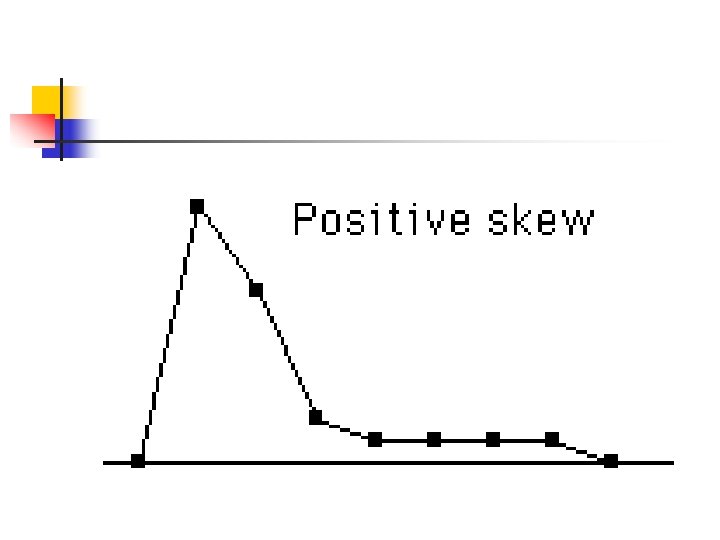
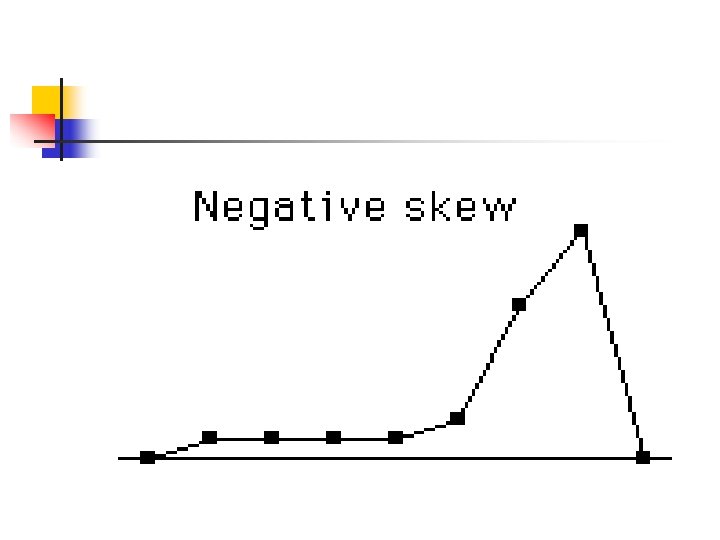
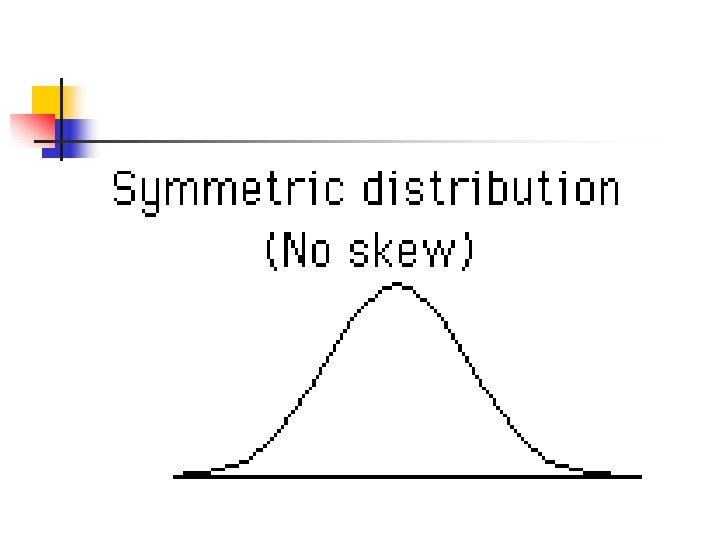
The third central moment, r=3, is skewness. Skewness describes how the sample differs in shape from a symmetrical distribution. If a normal distribution has a skewness of 0, right skewed is greater then 0 and left skewed is less than 0.
Negatively skewed distributions, skewed to the left, occur when most of the scores are toward the high end of the distribution. In a normal distribution where skewness is 0, the mean, median and mode are equal. In a negatively skewed distribution, the mode > median > mean.
Positively skewed distributions occur when most of the scores are toward the low end of the distribution. In a positively skewed distribution, mode< median< mean.
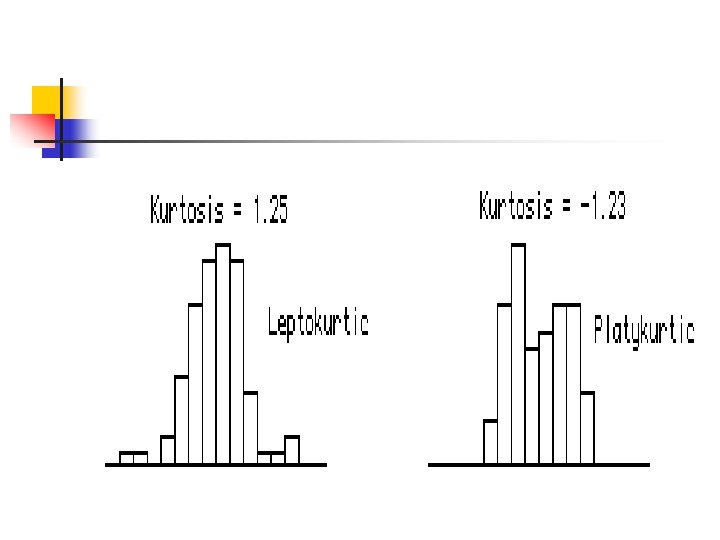
Kurtosis is the 4 th central moment. This is the “peakedness” of a distribution. It measures the extent to which the data are distributed in the tails versus the center of the distribution There are three types of peakedness. Leptokurtic- very peaked Platykurtic – relatively flat Mesokurtic – in between
Mesokurtic has a kurtosis of 0 Leptokurtic has a kurtosis that is + Platykurtic has a kurtosis that is -
Both skewness and kurtosis are sensitive to outliers and differences in the mean.
Skewness When the distribution is symmetric, the value of skewness should be zero. Karl Pearson defined coefficient of Skewness as: Since in some cases, Mode doesn’t exist, so using empirical relation, We can write, (it ranges b/w -3 to +3)
Kurtosis n Karl Pearson introduced the term Kurtosis (literally the amount of hump) for the degree of peakedness or flatness of a unimodal frequency curve. When the peak of a curve becomes relatively high then that curve is called Leptokurtic. When the curve is flat-topped, then it is called Platykurtic. Since normal curve is neither very peaked nor very flat topped, so it is taken as a basis for comparison. The normal Mesokurtic. curve is called
Kurtosis n n n For a normal distribution, kurtosis is equal to 3. When is greater than 3, the curve is more sharply peaked and has narrower tails than the normal curve and is said to be leptokurtic. When it is less than 3, the curve has a flatter top and relatively wider tails than the normal curve and is said to be platykurtic.
Kurtosis Another measure of Kurtosis, known as Percentile coefficient of kurtosis is: Where, Q. D is semi-interquartile range=Q. D=(Q 3 -Q 1)/2 P 90=90 th percentile P 10=10 th percentile
Example Calculate first four moments about the mean for the following set of examination marks: n X n 45 n 32 n 37 n 46 n 39 n 36 n 41 n 48 n 36
Example Calculate: first four moments about mean for the following frequency distribution: Weights (grams) Frequency (f) 65 -84 9 85 -104 10 105 -124 17 125 -144 10 145 -164 5 165 -184 4 185 -204 5 Total 60