CENSUS OF INDIA 2011 RELEASE OF DATA PRIMARY


 Total Rural Urban Final Population")
")

")


")


")
 – States 2001, 2011 • In 20 States/UTs")
 - India : 2001, 2011 2001 2011 Difference Variation")
")

 Total Males Females 2011 Census 1210.")
– 2011, 2001 India (In crore) Total Males")
 – India 2011 • The total number")


 India : 2001, 2011 • The sex ratio in")

 - 2011 Top 5 States/UTs Bottom 5")

 2001 2011 Difference (2011 – 2001)")


 Top 5 States/UTs Kerala Bottom 5")
 & Scheduled Tribes (ST)")

 166, 635, 694")
 Persons 8, 43, 26, 978")
 Proportion of SCs STs")


- 2011 1. Work is defined as participation in any")
- 2011 4. It even includes part time help or")

 Residence Sex 2001 2011 Change")
 Residence Sex 2001")
")
")
")


 Residence Sex")

")


 • Cultivators 1,")


 Residence Category")
 Residence Category")
 Residence Category")

- Slides: 88
CENSUS OF INDIA 2011 RELEASE OF DATA PRIMARY CENSUS ABSTRACT Dr. C. CHANDRAMOULI REGISTRAR GENERAL & CENSUS COMMISSIONER, INDIA MINISTRY OF HOME AFFAIRS 26 TH APRIL 2013
Background • This is the first set of data released from the Population Enumeration exercise held in February 2011 • So far the data released from Census 2011 pertained to Houselisting and Housing Census covering • All Households • SC & ST Households • Female Headed Households • Slum Households
Background • On 31 st March 2011, just after 25 days of completion of the Population Enumeration phase, PROVISIONAL POPULATION TOTALS of the Country, State & other levels administration level released • Today the FINAL POPULATION TOTALS are released along with information on few other characteristics • This has been possible as the first stage of data capture and data processing have been completed in record time.
Background • Stages of work involved: • 340 million Schedules in 16 languages • Return collection of filled-in Census Schedules • Inventory management • Scanning • Data Recognition using Intelligent Character Recognition (ICR) technology • Data Processing • Generation of Tables
Data Release – List of Indicators • Number of Households • Population* • Population (0 -6)* • Number of Literates* • Scheduled Castes Population • Scheduled Tribes Population • Number of Workers (Total, Main, Marginal) • Category of Workers (Cultivators, Agricultural Labourers, Household Industry Workers, Other Workers) * - Provisional data released earlier By Sex & Residence
Data Highlights Census of India 2011
Number of Households – India 2011 • In India there are 24. 95 crore (2, 495 million) households as per Census 2011 • The number has increased by 5. 58 crore over the last Census held in 2001 • Largest number of households are in Uttar Pradesh (3. 34 crore). • There are 10 States where more than one crore households have been returned.
Population – India 2011 • Final Total Population of the country is 1, 210, 569, 573 (or 1. 21 billion) • Provisional Population Total: 1, 210, 193, 422 • There is a marginal increase of 376, 151 persons in the country’s population in the Final Population compared to Provisional Population.
Population – Rural - Urban India: 2011 (In millions) Total Rural Urban Final Population 2011 1210. 6 833. 5 377. 1 Provisional Population 2011 1210. 2 833. 1 377. 1 +0. 4 0. 0 Difference
POPULATION (IN MILLION)
Largest and Smallest States - 2011 Top 5 States/UTs Bottom 5 States/UTs Uttar Pradesh 199, 812, 341 Sikkim 610, 577 Maharashtra 112, 374, 333 A. & N. Islands 380, 581 Bihar 104, 099, 452 D. & N. Haveli 343, 709 West Bengal 91, 276, 115 Daman & Diu 243, 247 Andhra Pradesh 84, 580, 777 Lakshadweep 64, 473
Districts Ranked by Population - 2011 Top 5 Districts Bottom 5 Districts Thane (Maharashtra) 11, 060, 148 Nicobars (Andaman & Nicobar Islands) 36, 842 North Twenty Four Parganas (West Bengal) 10, 009, 781 Upper Siang (Arunachal Pradesh) 35, 320 Bangalore (Karnataka) 9, 621, 551 Lahul & Spiti (Himachal Pradesh) 31, 564 Pune (Maharashtra) 9, 429, 408 Anjaw (Arunachal Pradesh) 21, 167 Mumbai Suburban (Maharashtra) 9, 356, 962 Dibang Valley (Arunachal Pradesh) 8, 004
Population – Rural Urban Distribution India : 2011 • 833 million persons live in Rural areas, which is more than two-third of the total population • Rural – Urban distribution : 68. 8% & 31. 2% • Level of Urbanization increased from 27. 81% in 2001 Census to 31. 2% in 2011. • The proportion of Rural population declined from 72. 19% to 68. 8%
Urbanization – India : 2011 • Among the States/UTs in India the level of Urbanization (proportion of urban population to total population) in Census 2001 is highest in NCT Delhi (97. 5%) • Top five most urbanized States (excl UTs): • Goa • Mizoram • Tamil Nadu • Kerala • Maharashtra 62. 17% 52. 11% 48. 40% 47. 70% 45. 22%
PROPORTION OF URBAN POPULATION (IN %)
Growth in Population – India 2001, 2011 Decadal Growth in Population: • Population of India grew by 17. 7% during 2001 -11 • In the previous decade the growth rate was 22. 7% • Thus, there has been a substantial decline in the growth of population of India • Among the major States, highest decadal growth in population has been recorded in Bihar (25. 4%) • 14 States/UTs have recorded population growth above 20%.
Growth in Population – India 2001, 2011 Growth in Population: • There has been an increase of 181. 96 million persons in the absolute number of population in India during 2001 -11 • Increase among males: 90. 97 million • Increase among females: 90. 99 million • Growth Rate in population among females (18. 3%) is higher than among males (17. 7%) during the last decade.
DECADAL GROWTH IN POPULATION (IN %)
Growth in Population (in Absolute Number) – States 2001, 2011 • In 20 States/UTs growth in female population during 2001 -11 exceeds growth in male population in absolute terms • Top 5 among these States are: Andhra Pradesh (541, 304), Kerala (447, 091), West Bengal (413, 834), Tamil Nadu (267, 219), Assam (225, 236) • This could be due to better enumeration of females in Census 2011 and improvement in preventing female mortality • On the other hand, Bihar, Gujarat, Rajasthan, Uttar Pradesh and Maharashtra showed significant higher growth among males than females.
Child Population (0 -6 years) - India : 2001, 2011 2001 2011 Difference Variation (in %) 16, 38, 19, 589 16, 44, 78, 150 658, 561 +0. 4 Males 8, 49, 99, 186 8, 57, 32, 470 733, 284 +0. 8 Females 7, 88, 20, 403 7, 87, 45, 680 -74, 723 -0. 09 Persons
PROPORTION OF CHILD POPULATION (IN %)
Child Population - 2011 • The total number of children in India in the age-group 0 -6 years, as per the final population totals of Census 2011, is 16. 45 crore, about 6. 6 lakh less than the number recorded in 2001 • Though there is increase in Male Child (0 -6) population, population of Female Child (0 -6) has actually decreased marginally between 2001 & 2011 • Twenty States and Union Territories now have over ten lakh children in the age group 0 -6 years each. • In ten States/UTs the number of children in the age-group 0 -6 years are between 1 to 9 lakh.
Sex Composition – 2011, 2001 India (In millions) Total Males Females 2011 Census 1210. 6 623. 1 587. 5 2001 Census 1028. 6 532. 2 496. 5 +17. 7 +17. 1 +18. 3 Growth 2001 -11 (%)
Sex Composition of Child Population (0 -6)– 2011, 2001 India (In crore) Total Males Females 2011 Census 16. 45 8. 57 7. 87 2001 Census 16. 38 8. 50 7. 88 Growth 2001 -11 (%) +0. 40 +0. 86 -0. 09
Sex Composition of Child Population (0 -6) – India 2011 • The total number of children in India in the age-group 0 -6 years, as per the final population totals of Census 2011, is 16. 45 crore, about 6. 6 lakh less than the number recorded in 2001 • Though there is increase in Male Child (0 -6) population, population of Female Child (0 -6) has actually decreased marginally between 2001 & 2011 • Twenty States and Union Territories now have over ten lakh children in the age group 0 -6 years each. • In ten States/UTs the number of children in the age-group 0 -6 years are between 1 to 9 lakh.
Sex Ratio of Population India : 2001, 2011 • Sex ratio is defined as the number of females per 1000 males in a population. • It is an important indicator to measure the extent of prevailing equity between males and females at a given point of time. Residence 2001 2011 Change Total 933 943 +10 Rural 946 949 +3 Urban 900 929 +29
SEX RATIO
States Ranked by Sex Ratio - 2011 Top 5 States/UTs Bottom 5 States/UTs Sex Ratio Kerala 1, 084 Andaman & Nicobar Is 878 Puducherry 1, 038 NCT of Delhi 866 Tamil Nadu 995 Chandigarh 818 Andhra Pradesh 992 Dadra & Nagar Haveli 775 Manipur 987 Daman & Diu 618 * Sex Ratio is defined as the number of females per 1000 males
Child Sex Ratio (0 -6) India : 2001, 2011 • The sex ratio in the age group 0 -6 attempts to bring out the recent changes in our society in its attitude and outlook towards the girl child. • It provides a broad indicator reflecting ground realities as they exist in the society and more importantly is an indicator of the likely future trends of sex ratio of the population. Residence 2001 2011 Change Total 927 919 -8 Rural 934 923 -11 Urban 906 905 -1
CHILD SEX RATIO
States Ranked by Child Sex Ratio (06) - 2011 Top 5 States/UTs Bottom 5 States/UTs Sex Ratio (0 -6 yrs) Arunachal Pd 972 Chandigarh 880 Mizoram 970 NCT of Delhi 871 Meghalaya 970 Jammu & Kashmir 862 Chhattisgarh 969 Punjab 846 A. & N Islands 968 Haryana 834 States/UTs Sex Ratio (0 -6 yrs) * Child Sex Ratio (0 -6) is defined as the number of females per 1000 males in the age group 0 -6 years.
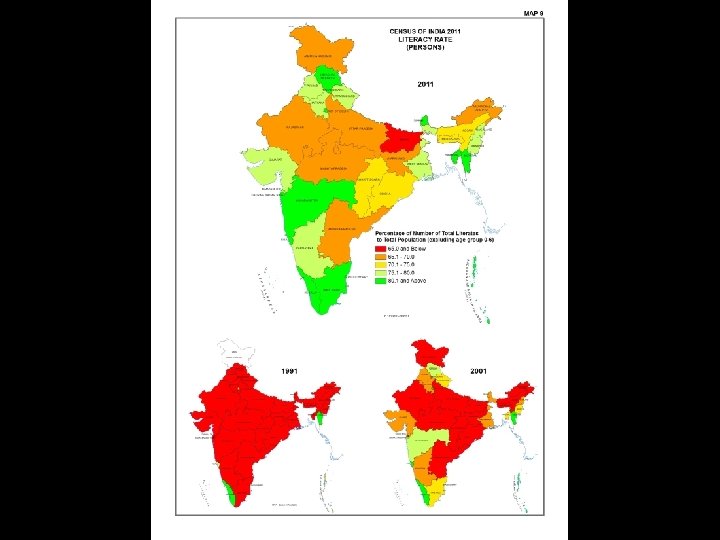
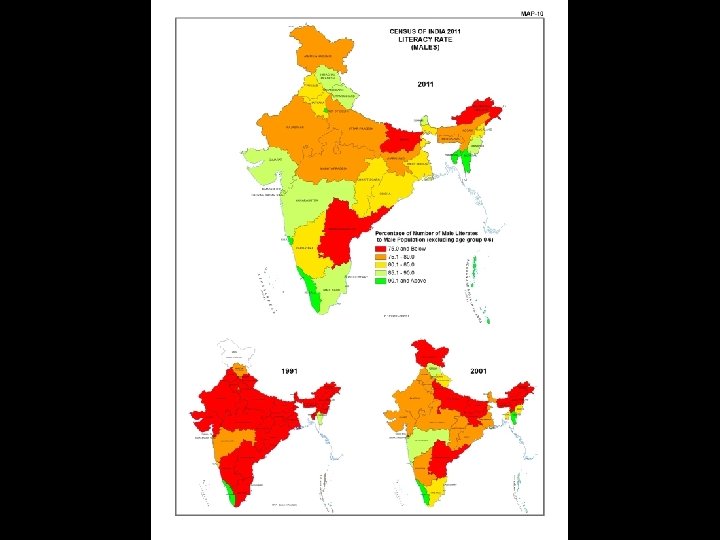
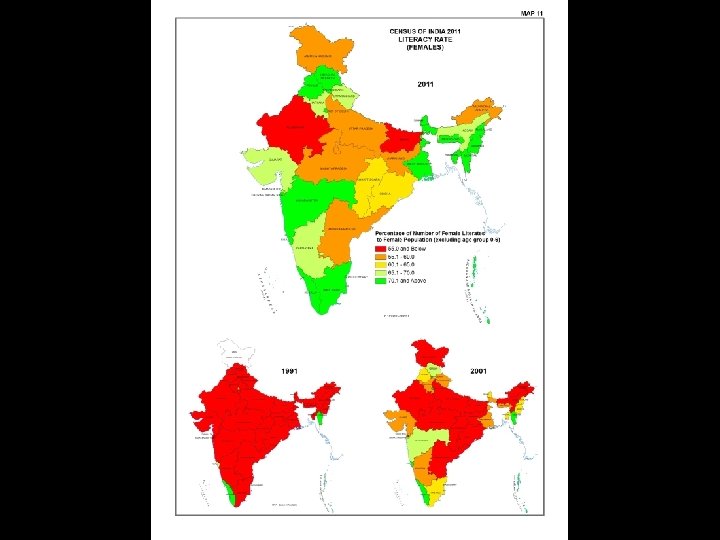
Number of Literates India : 2001, 2011 • A person is considered literate if he or she can read and write, with understanding, in any language. • Literacy rate: The total percentage of the population of an area at a particular time aged seven years or above who can read and write with understanding. Here the denominator is the population aged seven years or more. (in crore) Sex 2001 2011 Change Persons 56. 07 76. 35 +20. 28 Males 33. 65 43. 47 +9. 82 Females 22. 42 32. 88 +10. 46
Literacy Rate – India 2001, 2011 (in %) 2001 2011 Difference (2011 – 2001) Persons 64. 8 73. 0 +8. 2 Males 75. 3 80. 9 +5. 6 Females 53. 7 64. 7 +10. 9
Literacy Rate – Rural Urban Differential India - 2001, 2011 Residence Sex 2001 2011 Change Rural Persons 58. 7 67. 8 + 9. 1 Males 70. 7 77. 2 + 6. 5 Females 46. 1 57. 9 + 11. 8 Gender Gap 24. 6 19. 3 Persons 79. 9 84. 1 + 4. 2 Males 86. 3 88. 2 + 1. 9 Females 72. 9 79. 1 + 6. 2 Gender Gap 13. 4 9. 1 Urban
Literacy Rate by Sex- 2011 • The Literacy Rate of the population of the country has increased by 8. 2 percentage points from 64. 8% to 73. 0% over 2001 -11 • The largest increase in Literacy Rate has been recorded in • Dadra & Nagar Haveli by 18. 6 points (from 57. 6% to 76. 2%) • Bihar by 14. 8 points (from 47. 0% to 61. 8%) • Tripura by 14. 0 points (from 73. 2% to 87. 2%) • Highest increase in Female Literacy Rate has been reported from Dadra & Nagar Haveli (by 14. 0 points) • Nagaland Bihar also recorded high increase in Female Literacy Rate in Census 2011 compared to 2001.
States Ranked by Literacy Rate- 2011 (In %) Top 5 States/UTs Kerala Bottom 5 States/UTs Literacy Rate 94. 0 States/UTs Andhra Pradesh Literacy Rate 67. 0 Lakshadweep 91. 8 Jharkhand 66. 4 Mizoram 91. 3 Rajasthan 66. 1 Tripura 88. 7 Arunachal Pradesh 65. 4 Goa 87. 2 Bihar 61. 8
Scheduled Castes (SC) & Scheduled Tribes (ST)
SCs/STs in India • Scheduled Castes are notified in 32 States/UTs of India and Scheduled Tribes in 30 States • There altogether 99999 individual ethnic groups or parts thereof notified as Scheduled Castes in different States/UTs • Number of individual ethnic groups or parts thereof notified as Scheduled Tribes is 99999 • There has been some changes in the List of SCs/STs in States/ Uts.
Population of SCs - India - 2011 2001 2011 Variation (%) 166, 635, 694 201, 378, 086 +20. 8 Males 86, 088, 757 103, 535, 165 +20. 3 Females 80, 547, 930 97, 842, 921 +21. 5 Persons
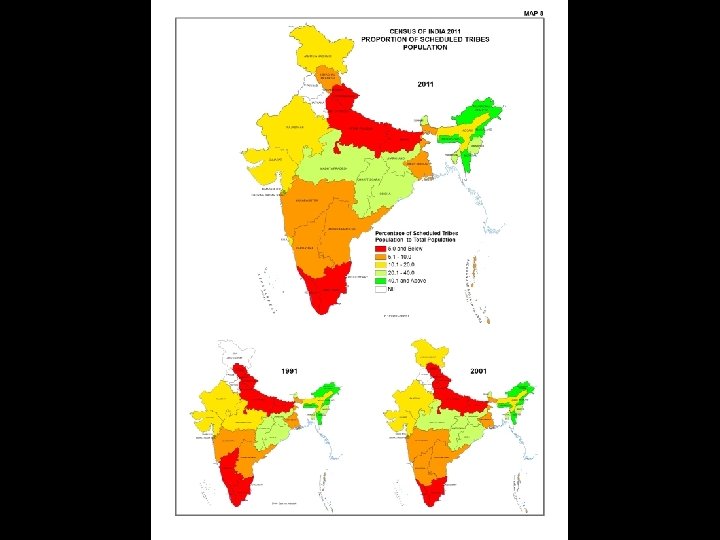
Population of STs - India - 2011 Variation (%) Persons 8, 43, 26, 978 10, 42, 81, 034 +23. 7 Males 4, 26, 41, 217 5, 24, 09, 823 +22. 9 Females 4, 16, 85, 761 5, 18, 71, 211 +24. 4 Sex 2001
Proportion of SC/ST Population - India - 2011 (In %) Proportion of SCs STs Total Population Total 1, 210, 569, 573 16. 6 8. 6 Rural 833, 463, 448 18. 5 11. 3 Urban 377, 106, 125 12. 6 2. 8
Distribution of SCs Population by States - 2011
Distribution of STs Population by States - 2011
Proportion of SCs Highest & Lowest States - 2011 Top 5 States/UTs Bottom 5 States/UTs Punjab 31. 9% Daman & Diu 2. 5% Himachal Pradesh 25. 2% Dadra & Nagar Haveli 1. 8% West Bengal 23. 5% Goa 1. 7% Uttar Pradesh 20. 7% Meghalaya 0. 6% Haryana 20. 2% Mizoram 0. 1%
Proportion of STs Largest and Smallest States - 2011 Top 5 States/UTs Bottom 5 States/UTs Lakshadweep 94. 8% Uttarakhand 2. 9% Mizoram 94. 4% Kerala 1. 5% Nagaland 86. 5% Bihar 1. 3% Meghalaya 86. 1% Tamil Nadu 1. 1% Arunachal Pradesh 68. 8% Uttar Pradesh 0. 6%
SELECTED ECONOMIC INDICATORS
Definition of Work (Economic Activity)- 2011 1. Work is defined as participation in any economically productive activity with or without compensation, wages or profit. 2. Participation may be physical and/or mental in nature. 3. Work involves not only actual work but also includes effective supervision and direction of work.
Definition of Work (Economic Activity)- 2011 4. It even includes part time help or unpaid work on farm, family enterprises or in any other economic activity. 5. The important point to note is that the. activity should be economically productive Worker: A person who has participated in any economically productive activity at any time during the reference period (one year preceding the date of enumeration).
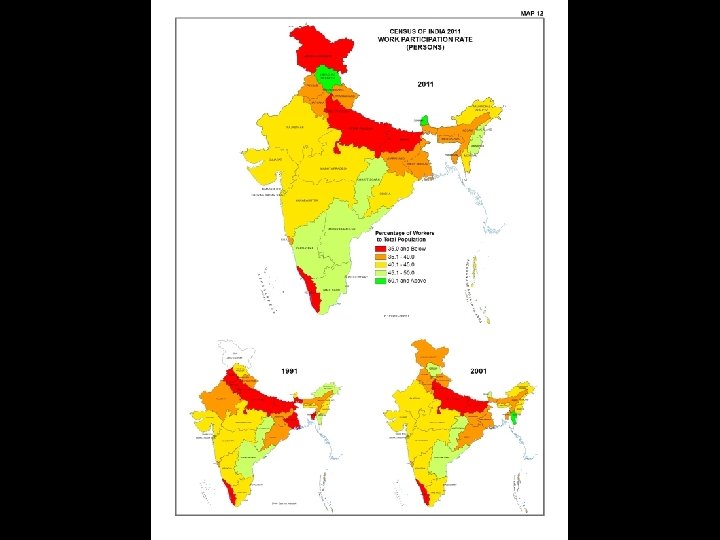
Number of Workers by Residence India : 2011 Residence Total Population Work Number of Participation Workers Rate* Total 1, 210, 569, 573 481743311 39. 8% Rural 833, 463, 448 348597535 41. 8% Urban 377, 106, 125 133145776 35. 3% * - Work Participation Rate is defined as the number of workers per 100 population
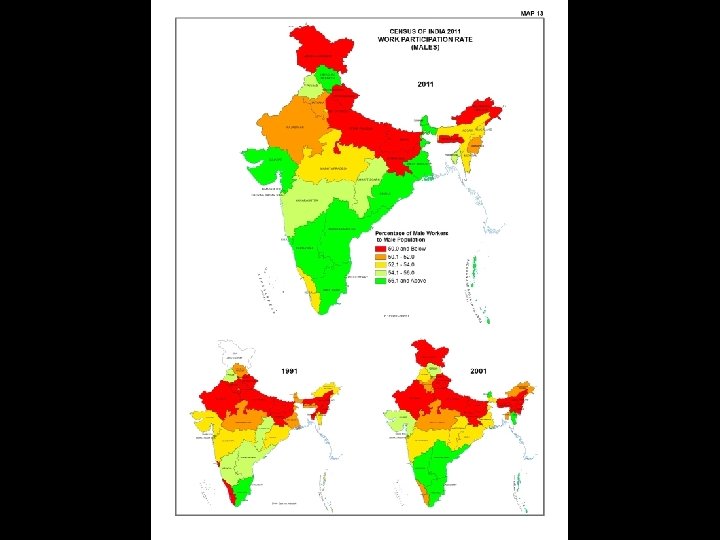
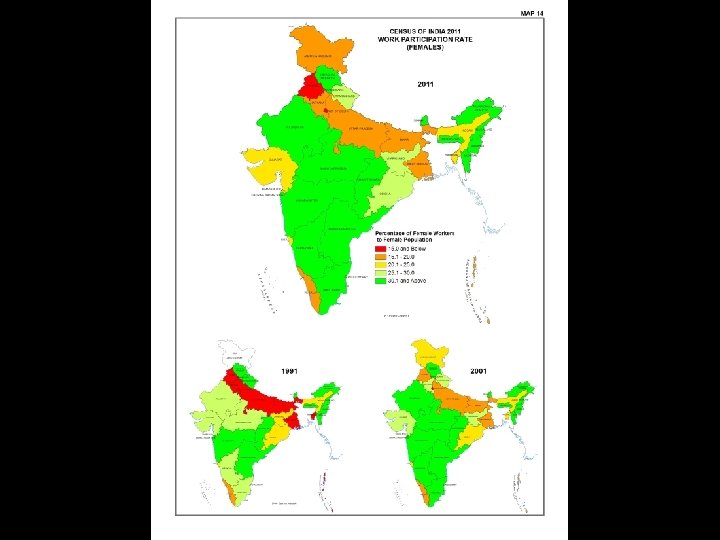
Work Participation Rate India : 2001, 2011 (In %) Residence Sex 2001 2011 Change Total Persons 39. 1 39. 8 +0. 7 Males 51. 7 53. 3 +1. 6 Females 25. 6 25. 5 -0. 1
Work Participation Rate – India By Residence: 2001, 2011 (In %) Residence Sex 2001 2011 Change Rural Persons 41. 7 41. 8 +0. 1 Males 52. 1 53. 0 +0. 9 Females 30. 8 30. 0 -0. 8 Persons 32. 3 35. 3 +3. 0 Males 50. 6 53. 8 +3. 2 Females 11. 9 15. 4 +3. 5 Urban
Distribution of States by Work Participation Rate : 2001, 2011 Range (Work Participation Rate) (in %) 2001 2011 Change Persons Up to 10. 0 0 0 0 10. 1 - 20. 0 0 20. 1 - 30. 0 1 1 0 30. 1 - 40. 0 17 16 -1 40. 1 - 50. 0 15 16 +1 50. 1 - 60. 0 2 2 0 Above 60. 0 0 0 0 Total 35 35
Distribution of States by Work Participation Rate : 2001, 2011 Range (Work Participation Rate) (in %) 2001 2011 Change Males Up to 10. 0 0 10. 1 - 20. 0 0 20. 1 - 30. 0 0 30. 1 - 40. 0 0 40. 1 - 50. 0 11 8 -3 50. 1 - 60. 0 22 24 +2 Above 60. 0 2 3 +1 35 35 Total
Distribution of States by Work Participation Rate : 2001, 2011 Range (Work Participation Rate) (in %) 2001 2011 Change Females Up to 10. 0 2 0 -2 10. 1 - 20. 0 9 13 +4 20. 1 - 30. 0 9 8 -1 30. 1 - 40. 0 13 12 -1 40. 1 - 50. 0 2 2 0 50. 1 - 60. 0 0 Above 60. 0 0 35 35 Total
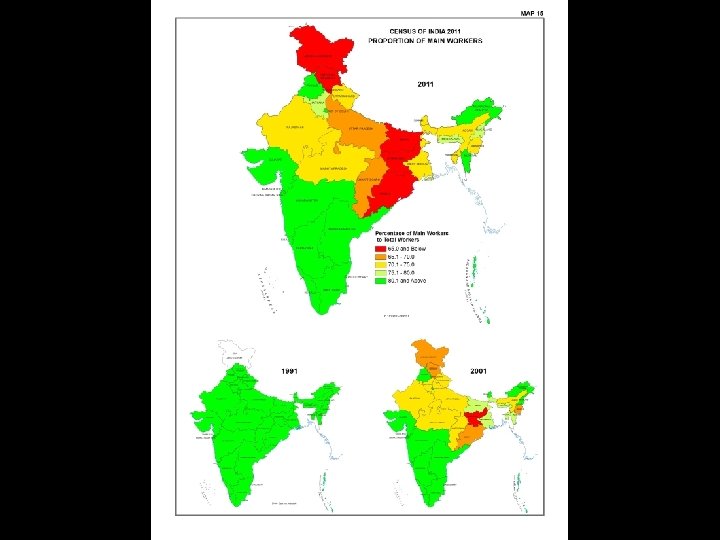
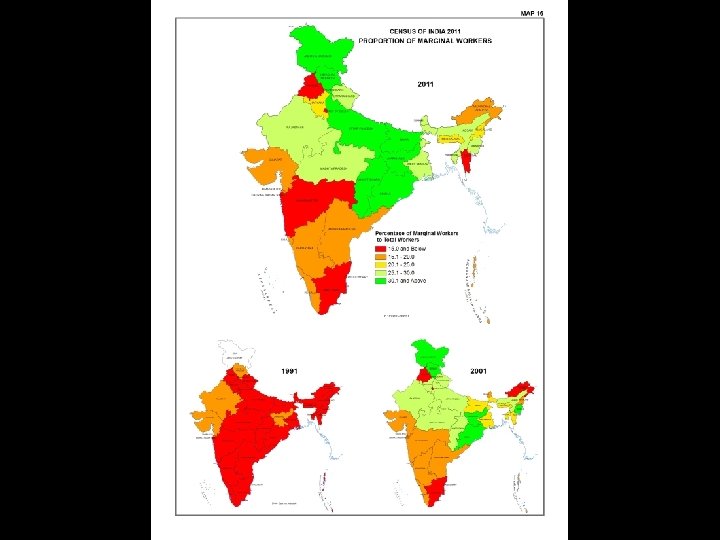
Type of Workers- 2011 • Main worker: Person who had ‘worked’ for 6 months or more during the reference period • Marginal worker: Person who had ‘worked’ for less than 6 months • Non-worker: Person who did not ‘work’ at all during the reference period (code 4). They will include students, persons engaged in household duties, dependents, pensioners, beggars, etc.
Distribution of Workers by Type – India - 2011 Persons Males Females
Change in Type of Workers – India : 2001, 2011 (in %) Residence Sex 2001 2011 Change Main Workers Persons 77. 8 75. 2 -2. 6 Males 87. 3 82. 3 -5. 0 Females 57. 3 59. 6 2. 3 Persons 22. 2 24. 8 2. 6 Males 12. 7 17. 7 5. 0 Females 42. 4 40. 4 -2. 3 Marginal Workers
Variation in Proportion of Total Workers - States: 2001, 2011 Total Workers • The Proportion of Total Workers in the country has recorded a marginal increase from 39. 1% in 2001 to 39. 8% in 2011 • Majority of the States/ UTs have shown increase in the proportion of total workers between 2001 -2011, • However, in 9 States/UTs, this proportion has actually declined during the decade (Mizoram (-8. 2 percentage points), D & N Haveli, Haryana, Jammu & Kashmir, Meghalaya, Punjab, Arunachal Pradesh, Gujarat, Bihar (-0. 3 pp).
Variation in Proportion of Workers - States: 2001, 2011 Total Workers State (in %) 2001 2011 Change 1. Mizoram 52. 6 44. 4 -8. 2 2. D & N Haveli # 51. 8 45. 7 -6. 0 3. Haryana 39. 6 35. 2 -4. 4 4. Jammu & Kashmir 37. 0 34. 5 5. Meghalaya 41. 8 40. 0 -1. 9 6. Punjab 37. 5 35. 7 -1. 8 7. Arunachal Pradesh 44. 0 42. 5 8. Gujarat 41. 9 41. 0 -1. 0 9. Bihar 33. 7 33. 4 -2. 5 -1. 5 -0. 3
Variation in Proportion of Main Workers - States: 2001, 2011 Main Workers • The proportion of Main Workers in the country has declined by 2. 6 percentage points between 2001 & 2011 • In 23 States/ UTs this proportion has declined, the prominent among them are: Lakshadweep (by 18. 7 percentage point), Bihar (by 13. 7 pp) and Jharkhand (by 11. 7 pp) • Decline in proportion of main workers in such a large number of States needs further exploration.
Variation in Proportion of Main Workers - States: 2001, 2011 Marginal Workers • The Proportion of Marginal Workers in the country has increased by 2. 6 percentage points from 22. 2% to 24. 8% between 2001 & 2011 • Majority of the States/UTs have shown increase in the proportion of Marginal Workers during the last decade • In 10 States/ UTs this proportion has declined, including Mizoram (by 7. 7 pp), Haryana, Maharashtra, Gujarat, Karnataka pointing to reversal of trend.
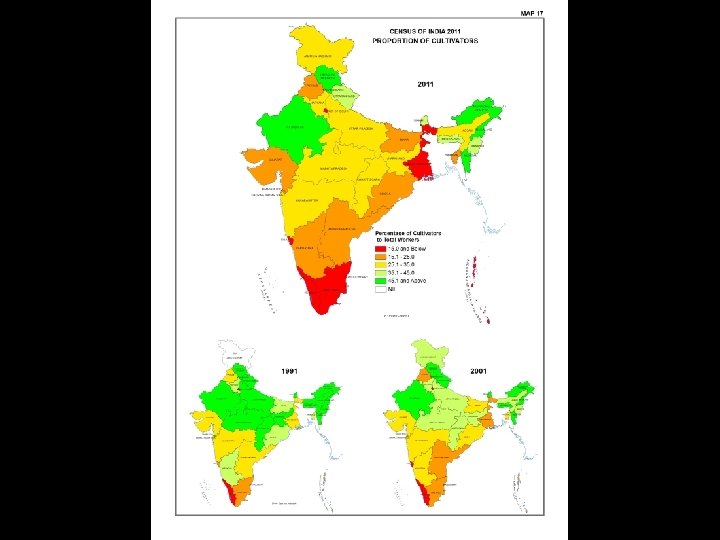
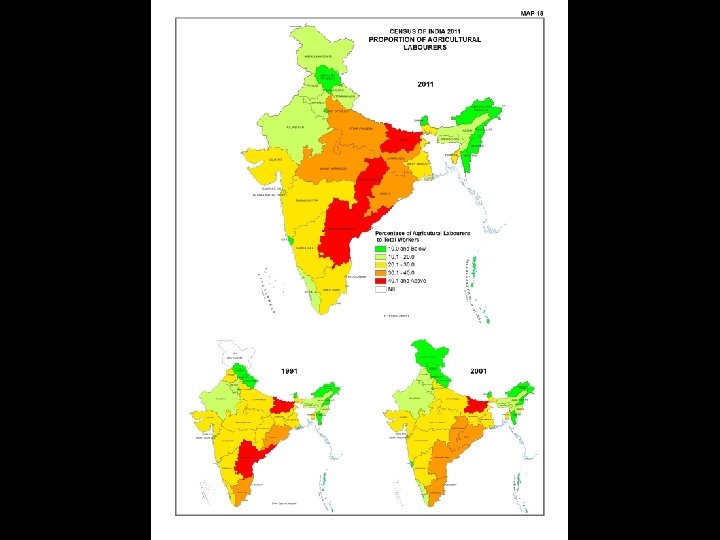
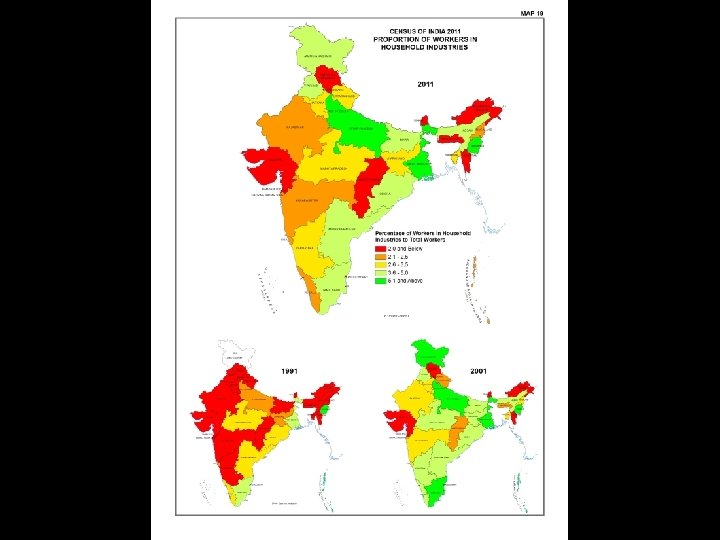
Category of Workers - India: 2011 Total Workers (Main + Marginal) • Cultivators 1, 187 lakh (24. 6%) • Agricultural Labourers 1, 443 lakh (30. 0%) • Household Industries Workers 183 lakh ( 3. 8%) • Other Workers (41. 6%) 2, 004 lakh
Cultivators Number and Proportions - India: 2011 Residence Sex Main Marginal Worker Total Worker Number of Cultivators (in lakh) All Areas Persons 958 229 1187 Males 730 97 827 Females 228 132 360 Proportion of Cultivators among Workers (in %) All Areas Persons 26. 4 19. 2 24. 6 Males 26. 7 16. 5 24. 9 Females 25. 6 21. 7 24. 0
Agricultural Labourers Number and Proportions - India: 2011 Residence Sex Main Marginal Worker Total Worker Number of Agricultural Labourers (in lakh) All Areas Persons 862 582 1443 Males 553 275 827 Females 309 307 616 Proportion of Agricultural Labourers among Workers (in %) All Areas Persons 23. 8 48. 8 30. 0 Males 20. 2 46. 8 24. 9 Females 34. 6 50. 6 41. 1
Workers in Household Industries Number and Proportions - India: 2011 Residence Sex Main Marginal Worker Total Worker Number of HHI Workers (in lakh) All Areas Persons 123 60 183 Males 75 22 98 Females 48 38 86 Proportion of HHI Workers among total workers (in %) All Areas Persons 3. 4 5. 0 3. 8 Males 2. 8 3. 8 2. 9 Females 5. 4 6. 2 5. 7
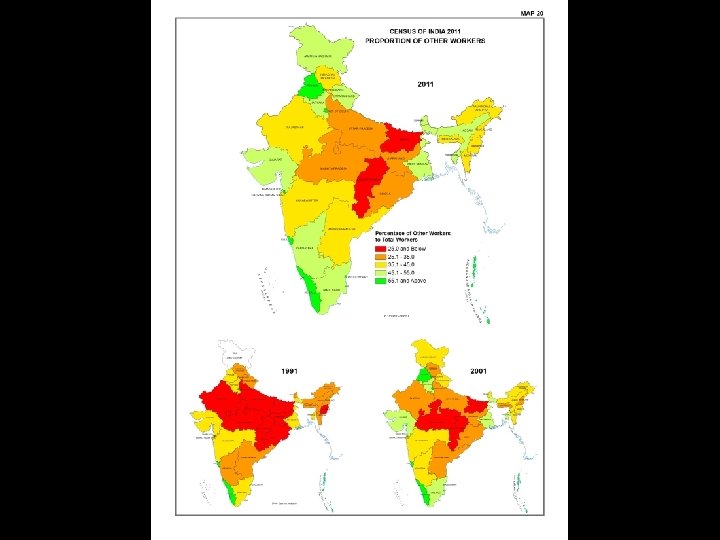
Other Workers Number and Proportions - India: 2011 Residence Sex Main Marginal Worker Total Worker Number of Other Workers (in lakh) All Areas Persons 1681 323 2004 Males 1373 193 1566 308 130 437 Females Proportion of Other Workers among total workers (in %) All Areas Persons 46. 4 27. 1 41. 6 Males 50. 3 32. 9 47. 2 Females 34. 5 21. 4 29. 2
Category of Workers Change in Proportions - India: 2001 &2011 (in %) Residence Category 2001 2011 Change 100. 0 Cultivators 31. 7 24. 6 - 7. 1 Ag. Labourers 26. 5 30. 0 +3. 4. 2 3. 8 -0. 4 37. 6 41. 6 +4. 0 Workers (Main + Marginal) All Areas Total Workers HHI Workers Other Workers
Category of Workers Change in Proportions - India: 2001 &2011 (in %) Residence Category 2001 2011 Change 100. 0 Cultivators 40. 2 33. 0 -7. 2 Ag. Labourers 33. 0 39. 3 +6. 3 3. 9 3. 4 -0. 5 22. 8 24. 3 +1. 5 Workers (Main + Marginal) Rural Total Workers HHI Workers Other Workers
Category of Workers Change in Proportions - India: 2001 &2011 (in %) Residence Category 2001 2011 Change 100. 0 Cultivators 2. 8 0. 0 Ag. Labourers 4. 7 5. 5 +0. 8 HHI Workers 5. 2 4. 8 -0. 4 87. 3 86. 9 -0. 4 Workers (Main + Marginal) Urban Total Workers Other Workers
Thank you http: //www. censusindia. gov. in