Cell Image Analysis Part 1 David Julian University


#/media/File: Animal_cell_structure_en. svg Blausen. com staff. \"Blausen gallery 2014\".")


- Slides: 17
Cell Image Analysis, Part 1 David Julian University of Florida ASCB Conference 2016
With your student hats on…. 1. Take two minutes to draw an animal cell that includes: • the nucleus • mitochondria • at least two other organelles • a scale bar with an appropriate unit of measurement 2. Take one minute to compare your drawing with 2 -3 people around you. 3. Take two minutes to discuss misconceptions your students have about cell structure.
Representative Diagrams https: //en. wikipedia. org/wiki/Cell_(biology)#/media/File: Animal_cell_structure_en. svg Blausen. com staff. "Blausen gallery 2014". Wikiversity Journal of Medicine. DOI: 10. 15347/wjm/2014. 010. ISSN 20018762.
Student Learning Goals Overall • Use basic bioimage informatics techniques to acquire quantitative data from images of cultured cells, and then use these data to test a hypothesis about the effect of a genetic mutation on cellular phenotypes. Part 1 • Analyze fluorescence emission images of cultured cells to determine the appearance, characteristics, and dimensions of some cellular features and then create a composite, color image. Part 2 • Use image analysis to count and measure the nuclei of control cells and cells with a mutation in a proto-oncogene.
Part 1 Learning Outcomes Research Skills • Using the image analysis software Image. J to measure cellular features and create composite images. Learning Objectives • Explain the role of fluorescent dyes in studying the phenotypes of cells. • Describe the overall appearance of a representative mammalian cell line in culture. • Identify some characteristics of eukaryotic cells that are overly simplified in typical textbook diagrams. • Define the typical dimensions of cells, nuclei and mitochondria.
A 549 Cells • Tumor-cell line • Alveolar cell carcinoma • Originated with a lung cancer patient in 1972
Materials for the Activity • Image set • A 549 cells imaged with 63 x objective • Labeled with five fluorescent dyes: DNA, RNA, ER, mitochondria, and AGP (actin, Golgi apparatus, and plasma membrane) • Computer with Image. J (or FIJI) • Windows XP, Vista, 7, 8 and 10 • Mac OS X 10. 8 "Mountain Lion" or later • Linux on amd 64 and x 86 architectures Anne Carpenter, Imaging Platform Director, Broad Institute of MIT and Harvard
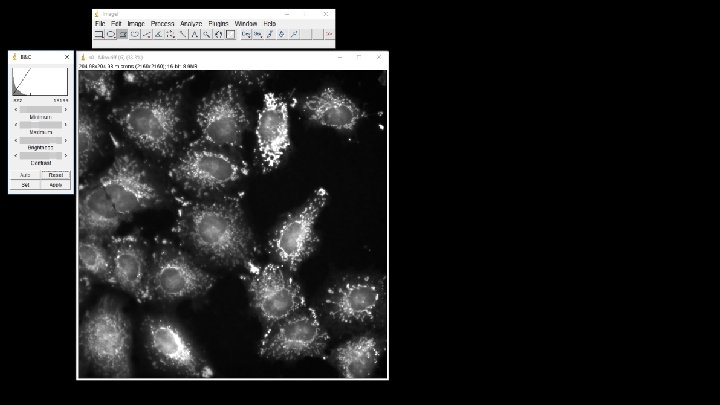
Image. J Interface
Measuring DNA Object Diameters
Measuring DNA Object Diameters
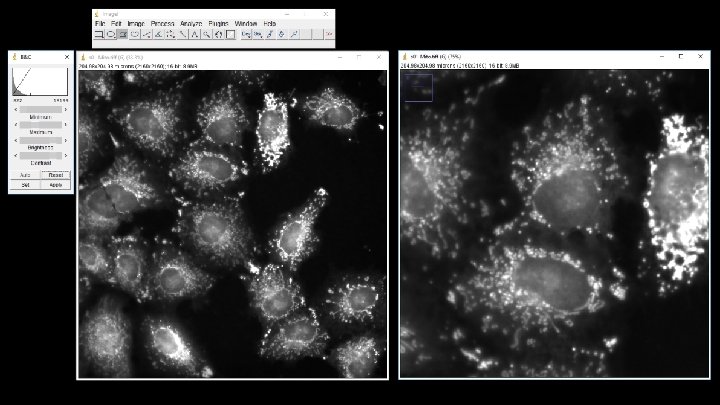
Analyzing AGP Channel
Analyzing AGP Channel
Analyzing AGP Channel
Analyzing AGP Channel
Resources • Image. J: https: //imagej. nih. gov/ij/ • Free, open-source, fast, versatile, widely-used biomedical image analysis software. Versions are available for most operating systems. Runs on almost any computer. • FIJI: https: //fiji. sc/ • Image. J bundle that comes with many pre-installed plug-ins. Very powerful, but probably unnecessarily confusing for a typical undergraduate course. • HHMI Bio. Interactive: https: //www. hhmi. org/biointeractive • Rich, diverse multimedia resources to bring scientific discovery into the classroom. • X-Laboratory: http: //x-laboratory. org/ • Latest versions of this exercise, along with other cross-disciplinary laboratory exercises.