
Cell Biology Molecular Biology Lecturer Dr Kamal E

Cell Biology & Molecular Biology Lecturer Dr. Kamal E. M. Elkahlout, Assistant Professor of Biotechnnolgy Lecture 5
Lodish • Berk • Kaiser • Krieger • Scott • Bretscher • Ploegh • Matsudaira Molecular Cell Biology 6 th Edition Chapter 15: Cell signaling I: Signal transduction and short-term cellular responses - 15. 1 From extracelluar signal to cellular response. - 15. 2 Studying cell-surface receptors. - 15. 3 Highly conserved components of intracelluar signal-transduction pathways. - 15. 4 General elements of G protein-coupled receptor systems. - 15. 6 G protein-coupled receptors that activate or inhibit adenylyl cyclase. - 15. 7 G protein-coupled receptors that activate phospholipase C.
• No cell lives in isolation • Communication is an intrinsic property • Even single-celled organisms can communicate with each other c& with the environment • Eukaryotic microorganism (yeast, molds, protozoans, … etc ) secret pheromones for aggregation of cells for sexual matting or differentiation. • Yeast matting-type factors as example of pheromonemediated cell to cell signaling. • Plant and animals secret signals as extracellular molecules serve within the organism for, control of metabolism of sugars, fats, amino acids growth & differentiation of tissues, synthesis & secretion of proteins and the composition of intracellular and extracellular fluids. • Animals respond to external signals from the environment including light, oxygene, odorants, tastants in food.

From Extracellular signals to cellular responses • Cell signaling is part of a complex system of communication that governs basic cellular activities and coordinates cell actions. The ability of cells to perceive and correctly respond to their microenvironment is the basis of development, tissue repair, and immunity as well as normal tissue homeostasis. Errors in cellular information processing are responsible for diseases such as cancer, autoimmunity, and diabetes. By understanding cell signaling, diseases may be treated effectively and, theoretically, artificial tissues may be created.
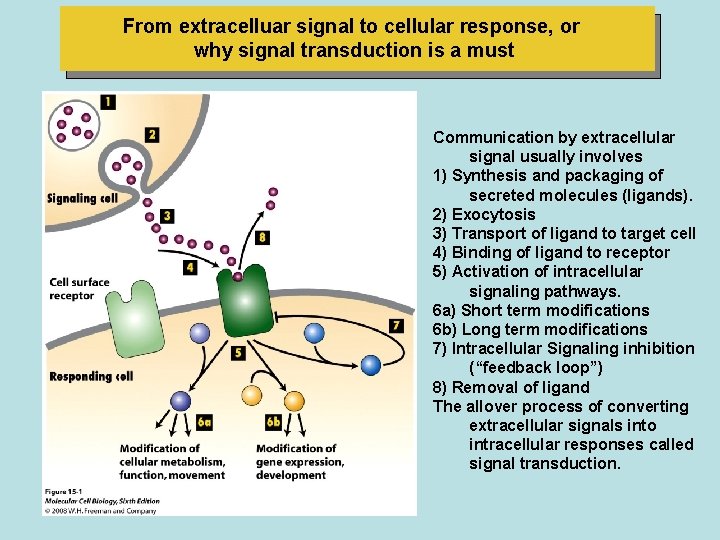
From extracelluar signal to cellular response, or why signal transduction is a must Communication by extracellular signal usually involves 1) Synthesis and packaging of secreted molecules (ligands). 2) Exocytosis 3) Transport of ligand to target cell 4) Binding of ligand to receptor 5) Activation of intracellular signaling pathways. 6 a) Short term modifications 6 b) Long term modifications 7) Intracellular Signaling inhibition (“feedback loop”) 8) Removal of ligand The allover process of converting extracellular signals into intracellular responses called signal transduction.
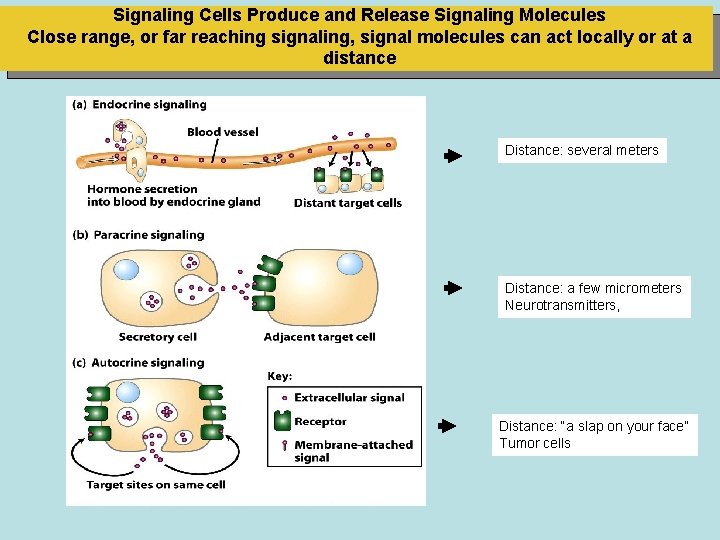
Signaling Cells Produce and Release Signaling Molecules Close range, or far reaching signaling, signal molecules can act locally or at a distance Distance: several meters Distance: a few micrometers Neurotransmitters, Distance: “a slap on your face” Tumor cells
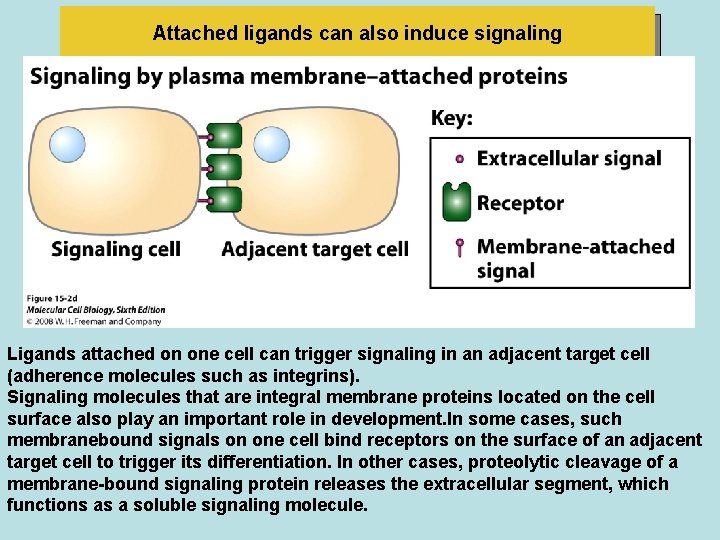
Attached ligands can also induce signaling Ligands attached on one cell can trigger signaling in an adjacent target cell (adherence molecules such as integrins). Signaling molecules that are integral membrane proteins located on the cell surface also play an important role in development. In some cases, such membranebound signals on one cell bind receptors on the surface of an adjacent target cell to trigger its differentiation. In other cases, proteolytic cleavage of a membrane-bound signaling protein releases the extracellular segment, which functions as a soluble signaling molecule.
• Some signaling molecules can act at both short and long ranges. • Epinephrine, for example, functions as a neurotransmitter (paracrine signaling) and as a systemic hormone (endocrine signaling). • Another example is epidermal growrh factor (EGF), which is synthesized as an integral plasma membrane protein. • Membrane-bound EGF can bind to and signal an adjacent cell by direct contact. Cleavage by an extracellular matrix protease releases a soluble form of EGF, which can signal in either an autocrine or a paracrine manner.
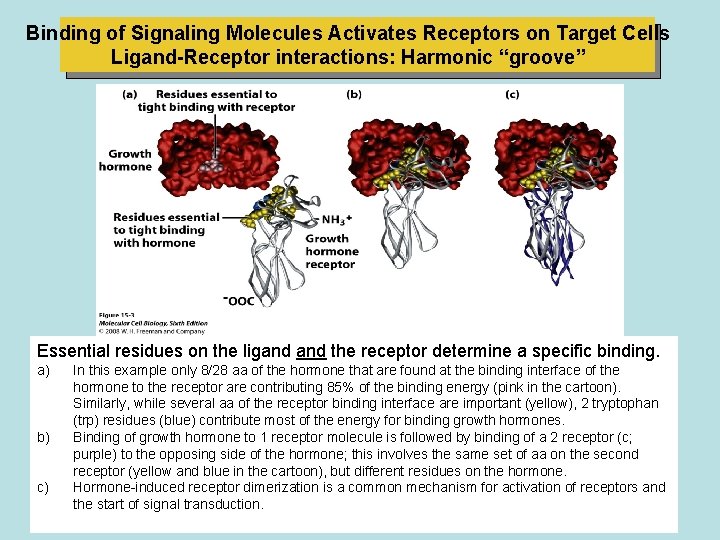
Binding of Signaling Molecules Activates Receptors on Target Cells Ligand-Receptor interactions: Harmonic “groove” Essential residues on the ligand the receptor determine a specific binding. a) b) c) In this example only 8/28 aa of the hormone that are found at the binding interface of the hormone to the receptor are contributing 85% of the binding energy (pink in the cartoon). Similarly, while several aa of the receptor binding interface are important (yellow), 2 tryptophan (trp) residues (blue) contribute most of the energy for binding growth hormones. Binding of growth hormone to 1 receptor molecule is followed by binding of a 2 receptor (c; purple) to the opposing side of the hormone; this involves the same set of aa on the second receptor (yellow and blue in the cartoon), but different residues on the hormone. Hormone-induced receptor dimerization is a common mechanism for activation of receptors and the start of signal transduction.
Studying cell surface receptors • The response of a cell or tissue to specific external signals is dictated • (a) by the cell's complement of receptors that can recognize the signals, • (b) the signal-transduction pathways • activated by those receptors, and • (c) the intracellular processes affected by those pathways. • Recall that the interaction between ligand receptor causes a conformational change in the receptor protein that enables it to interact with other proteins, thereby initiating a signaling cascad. • Receptor Proteins Bind Ligands Specifically, binding depends on weak, multiple noncovalent forces (i. e. , ionic, van der faals, and hydrophobic interactions) and molecular complementarity between the interacting surfaces of a receptor and ligand.
Studying cell surface receptors • Typical cell-surface receptors are present in 1000 to 50, 000 copies per cell. This may seem like a-large number, but a "typical" mammalian cell contains ≈1010 total protein molecules and ≈106 proteins on the plasma membrane. • Thus the receptor for a particular signaling molecule commonly constitutes only 0. 1 to 5 percent of plasma membrane proteins. • This low abundance complicates the isolation and purification of cell-surface receptors. • The purification of receptors is also difficult because these integral membrane proteins first must be solubilized from the membrane with a nonionic detergent and then separated from other cellular proteins
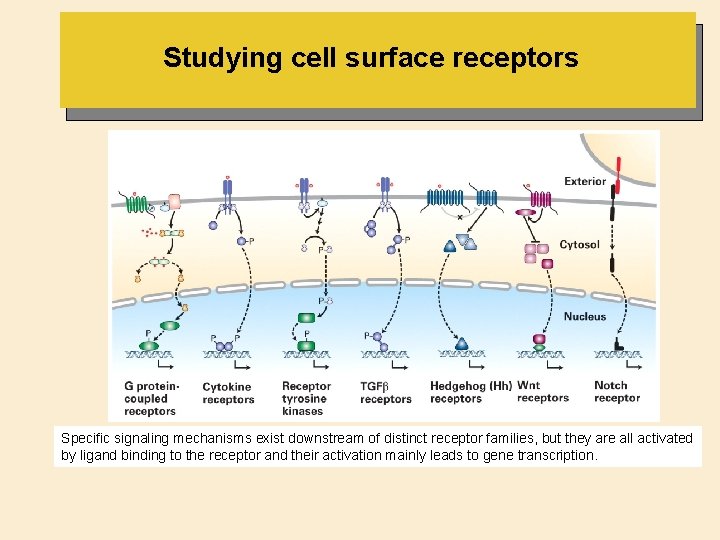
Studying cell surface receptors Specific signaling mechanisms exist downstream of distinct receptor families, but they are all activated by ligand binding to the receptor and their activation mainly leads to gene transcription.
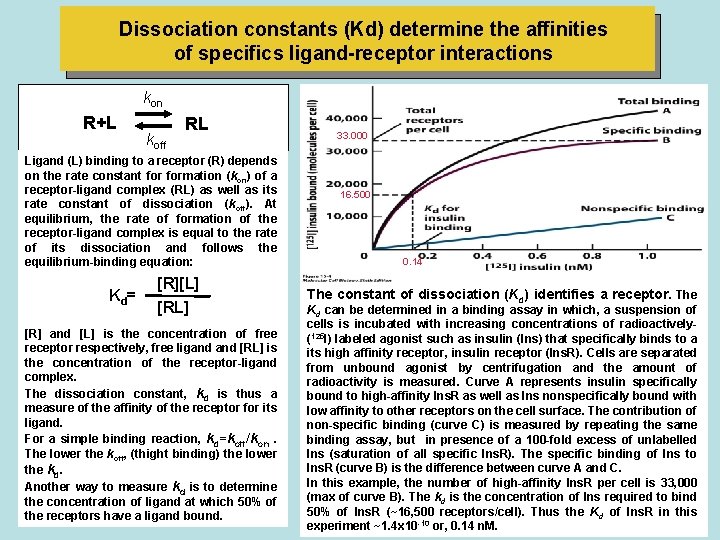
Dissociation constants (Kd) determine the affinities of specifics ligand-receptor interactions kon R+L koff RL Ligand (L) binding to a receptor (R) depends on the rate constant formation (kon) of a receptor-ligand complex (RL) as well as its rate constant of dissociation (koff). At equilibrium, the rate of formation of the receptor-ligand complex is equal to the rate of its dissociation and follows the equilibrium-binding equation: Kd = [R][L] [R] and [L] is the concentration of free receptor respectively, free ligand [RL] is the concentration of the receptor-ligand complex. The dissociation constant, kd is thus a measure of the affinity of the receptor for its ligand. For a simple binding reaction, kd=koff/kon. The lower the koff, (thight binding) the lower the kd. Another way to measure kd is to determine the concentration of ligand at which 50% of the receptors have a ligand bound. 33. 000 16. 500 0. 14 The constant of dissociation (Kd) identifies a receptor. The Kd can be determined in a binding assay in which, a suspension of cells is incubated with increasing concentrations of radioactively(125 I) labeled agonist such as insulin (Ins) that specifically binds to a its high affinity receptor, insulin receptor (Ins. R). Cells are separated from unbound agonist by centrifugation and the amount of radioactivity is measured. Curve A represents insulin specifically bound to high-affinity Ins. R as well as Ins nonspecifically bound with low affinity to other receptors on the cell surface. The contribution of non-specific binding (curve C) is measured by repeating the same binding assay, but in presence of a 100 -fold excess of unlabelled Ins (saturation of all specific Ins. R). The specific binding of Ins to Ins. R (curve B) is the difference between curve A and C. In this example, the number of high-affinity Ins. R per cell is 33, 000 (max of curve B). The kd is the concentration of Ins required to bind 50% of Ins. R (~16, 500 receptors/cell). Thus the Kd of Ins. R in this experiment ~1. 4 x 10 -10 or, 0. 14 n. M.
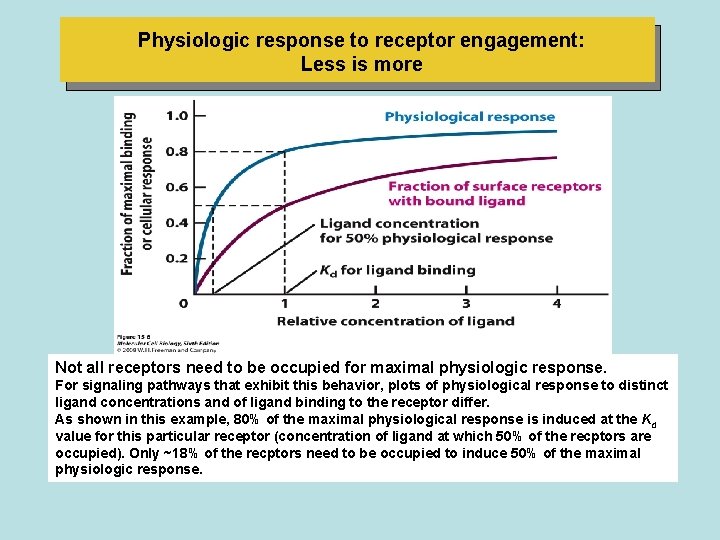
Physiologic response to receptor engagement: Less is more Not all receptors need to be occupied for maximal physiologic response. For signaling pathways that exhibit this behavior, plots of physiological response to distinct ligand concentrations and of ligand binding to the receptor differ. As shown in this example, 80% of the maximal physiological response is induced at the Kd value for this particular receptor (concentration of ligand at which 50% of the recptors are occupied). Only ~18% of the recptors need to be occupied to induce 50% of the maximal physiologic response.
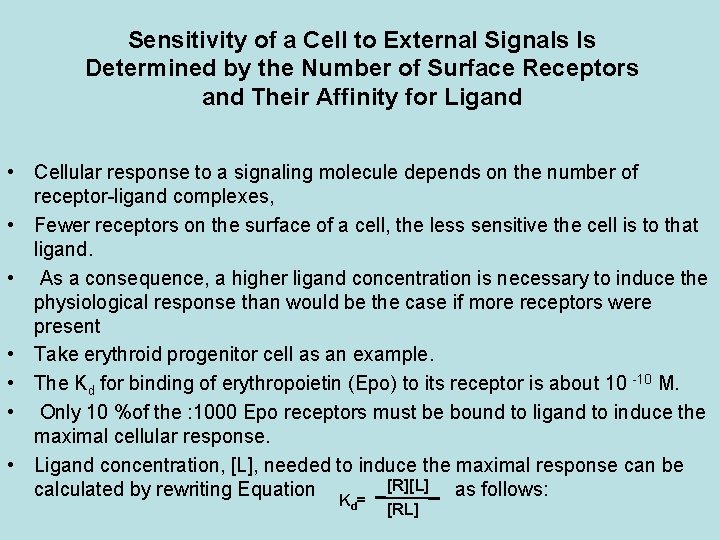
Sensitivity of a Cell to External Signals ls Determined by the Number of Surface Receptors and Their Affinity for Ligand • Cellular response to a signaling molecule depends on the number of receptor-ligand complexes, • Fewer receptors on the surface of a cell, the less sensitive the cell is to that ligand. • As a consequence, a higher ligand concentration is necessary to induce the physiological response than would be the case if more receptors were present • Take erythroid progenitor cell as an example. • The Kd for binding of erythropoietin (Epo) to its receptor is about 10 -10 M. • Only 10 %of the : 1000 Epo receptors must be bound to ligand to induce the maximal cellular response. • Ligand concentration, [L], needed to induce the maximal response can be [R][L] calculated by rewriting Equation as follows: Kd = [RL]
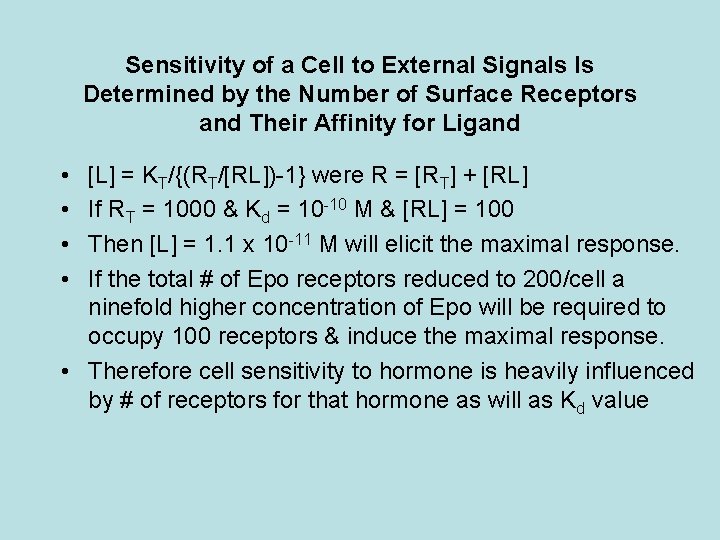
Sensitivity of a Cell to External Signals ls Determined by the Number of Surface Receptors and Their Affinity for Ligand • • [L] = KT/{(RT/[RL])-1} were R = [RT] + [RL] If RT = 1000 & Kd = 10 -10 M & [RL] = 100 Then [L] = 1. 1 x 10 -11 M will elicit the maximal response. If the total # of Epo receptors reduced to 200/cell a ninefold higher concentration of Epo will be required to occupy 100 receptors & induce the maximal response. • Therefore cell sensitivity to hormone is heavily influenced by # of receptors for that hormone as will as Kd value
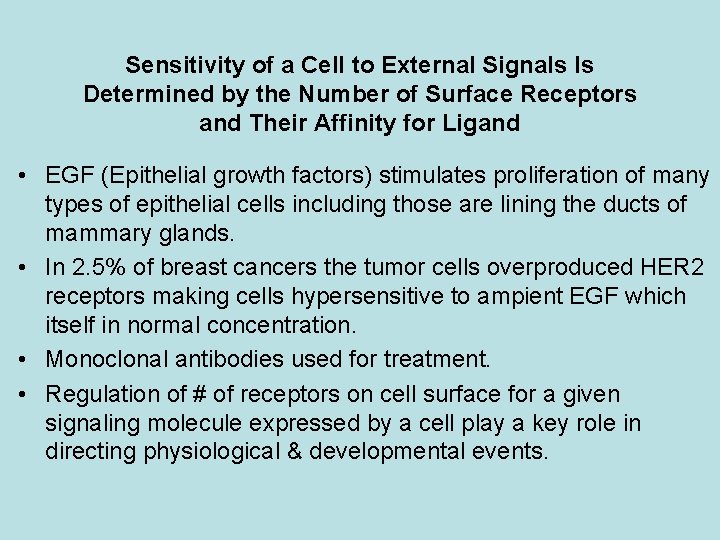
Sensitivity of a Cell to External Signals ls Determined by the Number of Surface Receptors and Their Affinity for Ligand • EGF (Epithelial growth factors) stimulates proliferation of many types of epithelial cells including those are lining the ducts of mammary glands. • In 2. 5% of breast cancers the tumor cells overproduced HER 2 receptors making cells hypersensitive to ampient EGF which itself in normal concentration. • Monoclonal antibodies used for treatment. • Regulation of # of receptors on cell surface for a given signaling molecule expressed by a cell play a key role in directing physiological & developmental events.
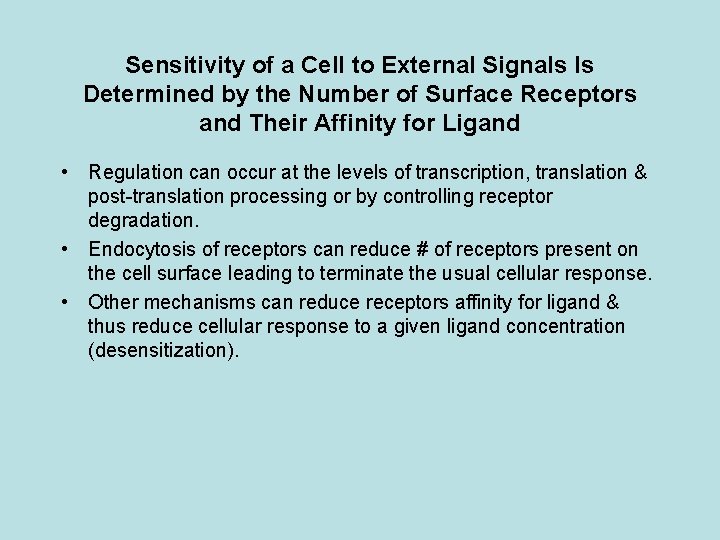
Sensitivity of a Cell to External Signals ls Determined by the Number of Surface Receptors and Their Affinity for Ligand • Regulation can occur at the levels of transcription, translation & post-translation processing or by controlling receptor degradation. • Endocytosis of receptors can reduce # of receptors present on the cell surface leading to terminate the usual cellular response. • Other mechanisms can reduce receptors affinity for ligand & thus reduce cellular response to a given ligand concentration (desensitization).
Receptors can be Purified by Affinity Techniques • Cell-surface receptors can be identified and followed through isolation procedures by affinity labeling. • In this technique, cells are mixed with an excess of a radio-labeled ligand for the receptor of interest. • After unbound ligand is washed away the cells are treated with a chemical agent that covalently crosslinks the bound labeled ligand molecules to receptors on the cell surface. • Once a radiolabeled ligand is covalently cross-linked to its receptor, it remains bound even in the presence of detergents • and other denaturing agents that are used to solubilize receptor • proteins from the cell membrane. • The labeled ligand provides a means for detecting the receptor during purification procedures.
Receptors can be Purified by Affinity Techniques • Another technique often used in purifying cell-surface receptors that retain their ligand-binding ability when solubilized by detergents is similar to affinity chromatography using antibodies. • A ligand for the receptor of interest, rather than an antibody, is chemically linked to the beads used to form a column. • A crude, detergent-solubilized preparation of membrane proteins is passed through the column; only the receptor binds, while other proteins are washed away. • Passage of an excess of the soluble ligand through the column causes the bound receptor to be displaced from the beads and eluted from the column. • In some cases a receptor can be purified as much as 100, 000 -fold in a single affinity chromatographic step.
Receptors Are Frequently Expressed from Cloned Genes • Cell-surface receptors for many signaling molecules are present in such small amounts that they cannot be purified by affinity chromatography and other conventional biochemical techniques. • These low-abundance receptor proreins can now be identified and cloned by various recombinant DNA techniques, eliminating the need to isolate and purify them from cell extracts. • Functional expression assays can determine if a c. DNA encodes a particular receptor and are useful in studying the effects on receptor function of specific mutations in its sequence.
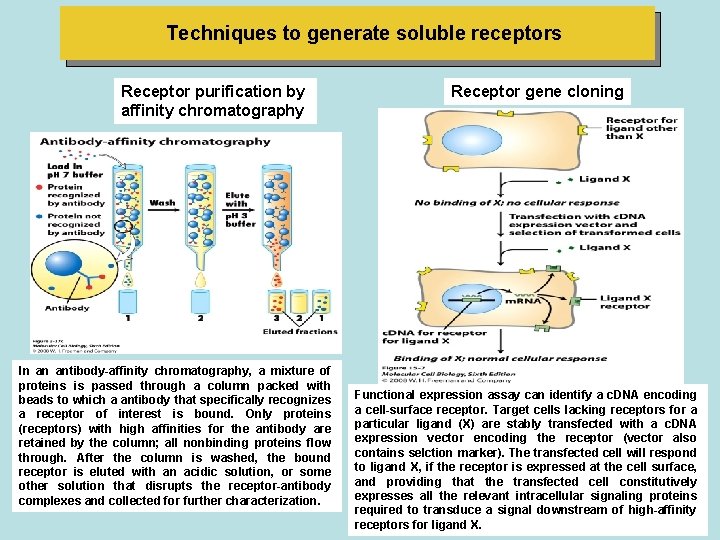
Techniques to generate soluble receptors Receptor purification by affinity chromatography Receptor gene cloning Fig 3 -37 c In an antibody-affinity chromatography, a mixture of proteins is passed through a column packed with beads to which a antibody that specifically recognizes a receptor of interest is bound. Only proteins (receptors) with high affinities for the antibody are retained by the column; all nonbinding proteins flow through. After the column is washed, the bound receptor is eluted with an acidic solution, or some other solution that disrupts the receptor-antibody complexes and collected for further characterization. Functional expression assay can identify a c. DNA encoding a cell-surface receptor. Target cells lacking receptors for a particular ligand (X) are stably transfected with a c. DNA expression vector encoding the receptor (vector also contains selction marker). The transfected cell will respond to ligand X, if the receptor is expressed at the cell surface, and providing that the transfected cell constitutively expresses all the relevant intracellular signaling proteins required to transduce a signal downstream of high-affinity receptors for ligand X.
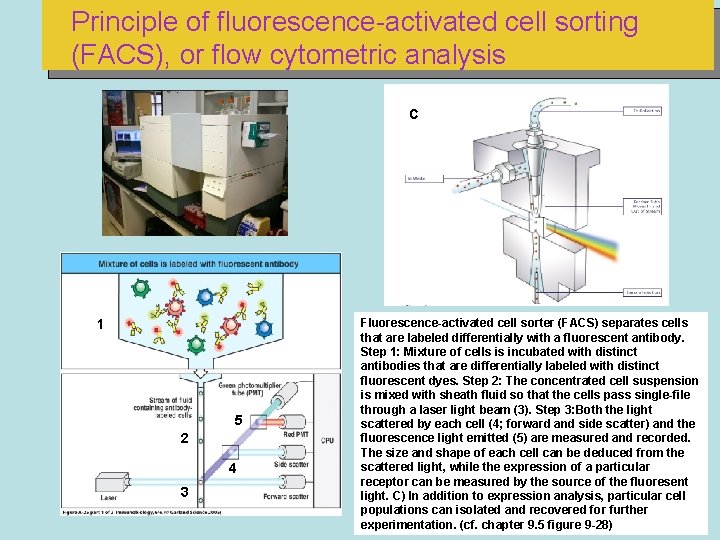
Principle of fluorescence-activated cell sorting (FACS), or flow cytometric analysis C 1 5 2 4 3 Fluorescence-activated cell sorter (FACS) separates cells that are labeled differentially with a fluorescent antibody. Step 1: Mixture of cells is incubated with distinct antibodies that are differentially labeled with distinct fluorescent dyes. Step 2: The concentrated cell suspension is mixed with sheath fluid so that the cells pass single-file through a laser light beam (3). Step 3: Both the light scattered by each cell (4; forward and side scatter) and the fluorescence light emitted (5) are measured and recorded. The size and shape of each cell can be deduced from the scattered light, while the expression of a particular receptor can be measured by the source of the fluoresent light. C) In addition to expression analysis, particular cell populations can isolated and recovered for further experimentation. (cf. chapter 9. 5 figure 9 -28)
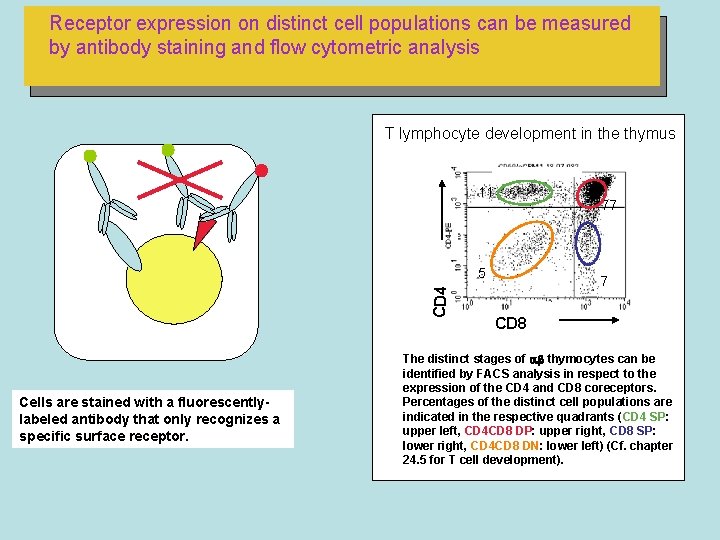
Receptor expression on distinct cell populations can be measured by antibody staining and flow cytometric analysis T lymphocyte development in the thymus 11 77 CD 4 5 Cells are stained with a fluorescentlylabeled antibody that only recognizes a specific surface receptor. 7 CD 8 The distinct stages of thymocytes can be identified by FACS analysis in respect to the expression of the CD 4 and CD 8 coreceptors. Percentages of the distinct cell populations are indicated in the respective quadrants (CD 4 SP: upper left, CD 4 CD 8 DP: upper right, CD 8 SP: lower right, CD 4 CD 8 DN: lower left) (Cf. chapter 24. 5 for T cell development).
Highly conserved components of intracellular signaling pathways
• External signals induce two major types of cellular responses: • ( 1 ) changes in the activity or function of specific enzymes and other proteins that pre-exist in the cell, and • (2) changes in the amounts of specific proteins produced by a cell, most commonly by modification of transcription factors that stimulate or repress gene expression. • First type of response occurs more rapidly than the second. • Signaling from G protein-coupled receptors, often results in changes in the activity of pre-existing proteins, although activation of these receptors on some cells also induces changes in gene expression. • Other classes o f receptors operate primarily but not exclusively to modulate gene expression. • Transcription factors activated in the cytosol by these pathways move into the nucleus, where they stimulate (or occasionally repress) transcription of specific target genes. • Several intracellular proteins or small molecules are employed • in a variety of signal-transduction pathways. • These include cytosolic enzymes that add or remove phosphate groups from specific target proteins.
• Ligand binding to a receptor activates or inhibits these enzymes, whose action in turn activates or inhibits the function of their target proteins. • G proteins, another component of many signal-transduction pathways, shuttle between a state with a bound GTP that is capable of activating other proteins and a state with a bound GDP that is inactive. • A number of small molecules (e. g. , Ca 2* and cyclic AMP) are also frequently used in intracellular signal-transduction pathways: A rise in the concentration of one of these molecules results in its binding to an intracellular target protein, causing a conformational change in the protein that modulates its function.
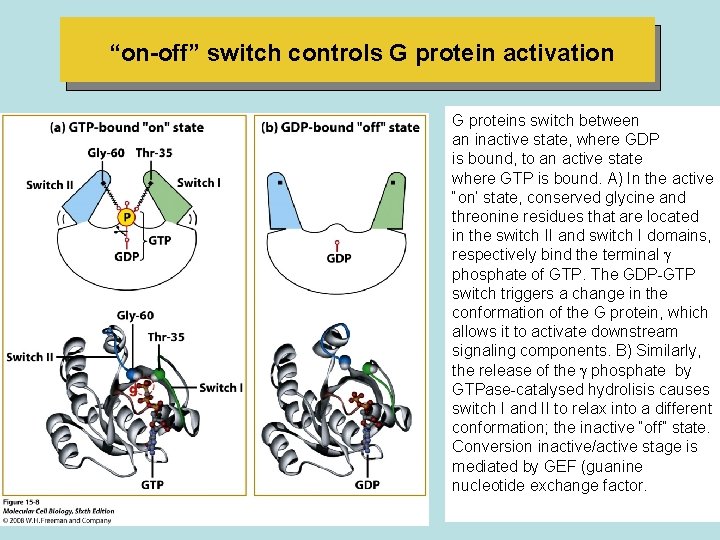
“on-off” switch controls G protein activation G proteins switch between an inactive state, where GDP is bound, to an active state where GTP is bound. A) In the active “on’ state, conserved glycine and threonine residues that are located in the switch II and switch I domains, respectively bind the terminal phosphate of GTP. The GDP-GTP switch triggers a change in the conformation of the G protein, which allows it to activate downstream signaling components. B) Similarly, the release of the phosphate by GTPase-catalysed hydrolisis causes switch I and II to relax into a different conformation; the inactive “off” state. Conversion inactive/active stage is mediated by GEF (guanine nucleotide exchange factor.
• Conversion of active/inactive form of G-protein is mediated by GTP hydrolysis activity of the G-protein itself. • The rate of GTP hydrolysis regulates the length of time the switch protein remains in the active conformation and able to signal downstream: • The slower the rate of GTP hydrolysis, the longer the protein remains in the active state. • The rate of GTP hydrolysis is often modulated by other proteins. • For instance , both GTPase-activating proteins (GAP) and regulator of G protein signaling (RGS) proteins accelerate GTP hydrolysis. • Many regulators of G protein activity are themselves controlled by extracellular signals.
Protein Kinases and Phosphatases are employed in virtually all signaling pathways • At last count the human genome encodes about 500 protein kinases and 100 different phosphatases. • In some signaling pathways, the receptor itself possesses intrinsic kinase or phosphatase activity; in other pathways, the receptor interacts with cytosolic or membrane-associated kinases. • Importantly the activity of all kinases is highly regulated. Commonly the catalytic activity of a protein kinase itself is modulated by phosphorylation by other kinases, by direct binding to other proteins or by changes in the levels of various small intracellular signaling molecules. • The resulting cascades of kinase activity are a common feature of many signaling pathways.
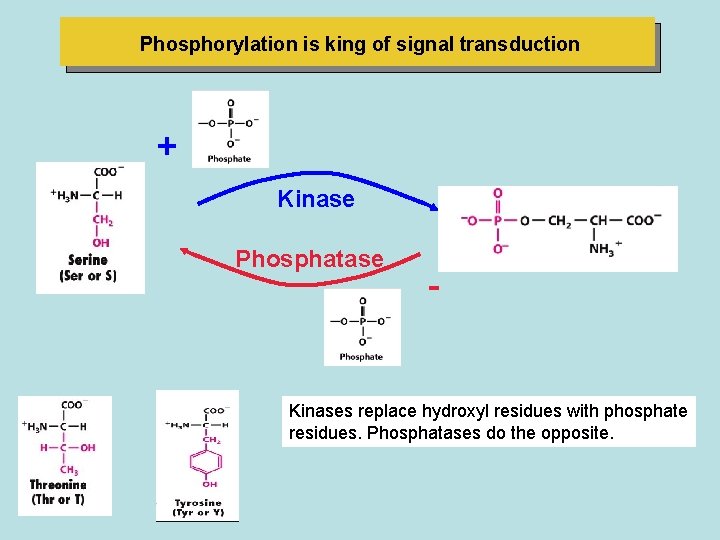
Phosphorylation is king of signal transduction + Kinase Phosphatase - Kinases replace hydroxyl residues with phosphate residues. Phosphatases do the opposite.
Second messengers carry and amplify signals From many receptors
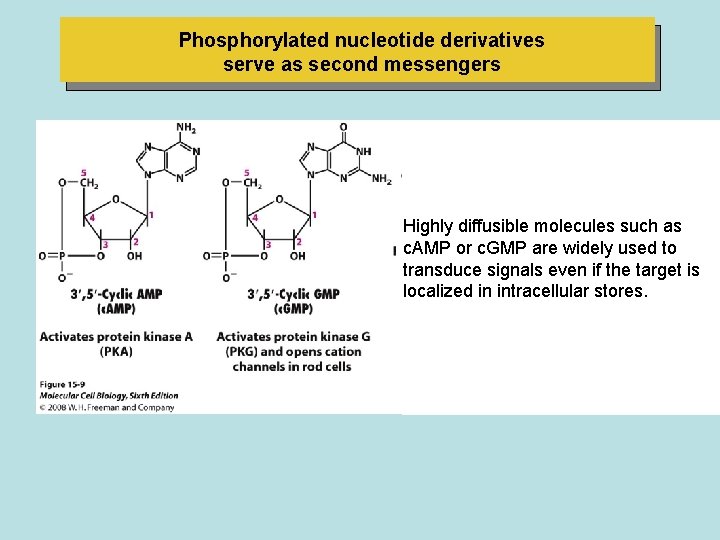
Phosphorylated nucleotide derivatives serve as second messengers Highly diffusible molecules such as c. AMP or c. GMP are widely used to transduce signals even if the target is localized in intracellular stores.
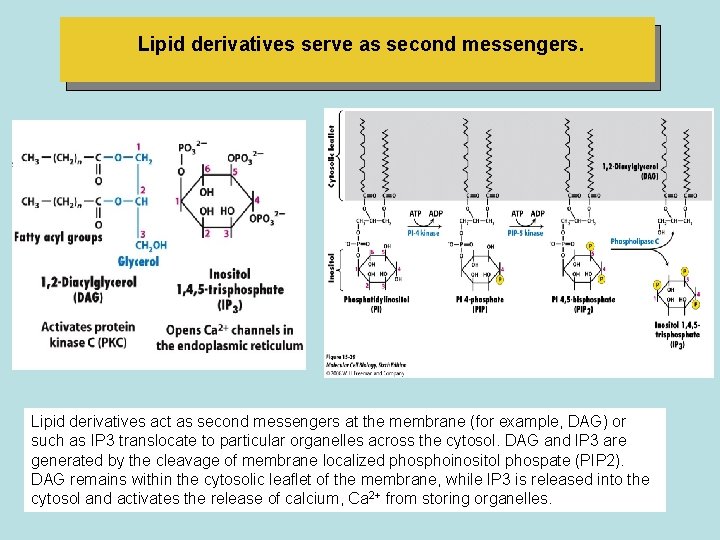
Lipid derivatives serve as second messengers. Lipid derivatives act as second messengers at the membrane (for example, DAG) or such as IP 3 translocate to particular organelles across the cytosol. DAG and IP 3 are generated by the cleavage of membrane localized phosphoinositol phospate (PIP 2). DAG remains within the cytosolic leaflet of the membrane, while IP 3 is released into the cytosol and activates the release of calcium, Ca 2+ from storing organelles.
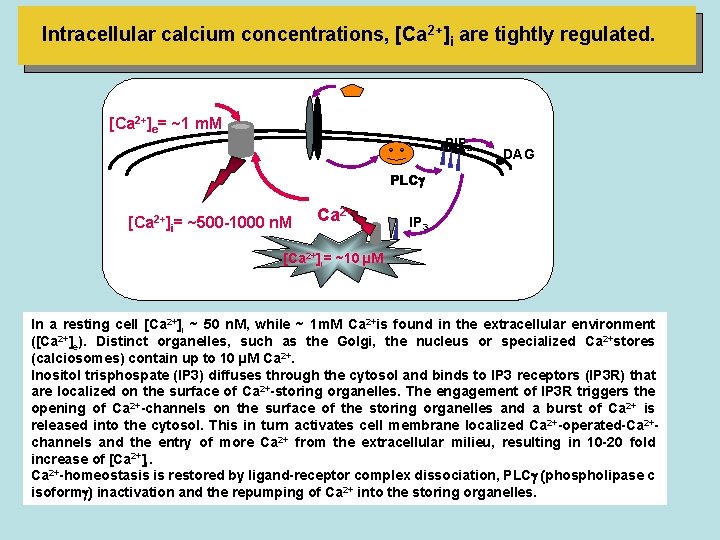
Intracellular calcium concentrations, [Ca 2+]i are tightly regulated. [Ca 2+]e= ~1 m. M PIP 2 DAG PLC [Ca 2+2+] =]i= ~50 n. M [Ca i ~500 -1000 2+ Ca 2+ IP 3 [Ca 2+]i= ~10 µM In a resting cell [Ca 2+]i ~ 50 n. M, while ~ 1 m. M Ca 2+is found in the extracellular environment ([Ca 2+]e). Distinct organelles, such as the Golgi, the nucleus or specialized Ca 2+stores (calciosomes) contain up to 10 µM Ca 2+. Inositol trisphospate (IP 3) diffuses through the cytosol and binds to IP 3 receptors (IP 3 R) that are localized on the surface of Ca 2+-storing organelles. The engagement of IP 3 R triggers the opening of Ca 2+-channels on the surface of the storing organelles and a burst of Ca 2+ is released into the cytosol. This in turn activates cell membrane localized Ca 2+-operated-Ca 2+channels and the entry of more Ca 2+ from the extracellular milieu, resulting in 10 -20 fold increase of [Ca 2+]i. Ca 2+-homeostasis is restored by ligand-receptor complex dissociation, PLC (phospholipase c isoform ) inactivation and the repumping of Ca 2+ into the storing organelles.
• In muscles, a signal-induced rise in cytosolic Ca 2+ triggers contraction. • In endocrine cells, a similar increasei n Ca 2+ induces exocytosiso f secretory vesicles containing hormones. • In nerve cells, a Ca 2+ increasel eadst o the exocytosis of neurotransmitter-containing vesicles. • ln all cells this rise in cytosolic Ca 2+ is sensed by Ca 2+ -binding proteins, particularly those of the EF hand family, such as calmodulin, all of which contain the helix loop-helix motif. • The binding of Ca 2+ to calmodulin and other EF hand proteins causes a conformational change that permits the protein to bind various target proteins, thereby switching their activities on or off. • Because second messenger such as Ca 2* and c. AMP diffuse through the cytosol much faster than do proteins, they are employed in pathways where the downstream target is located in an intracellular particle or organelle (such as a secretory vesicle) distant from the plasma membrane receptor.
• Another advantage of second messengers is that they facilitate amplification of an extracellular signal. • Activation of a single cell-surfacer eceptor moleculec an result in an increase in perhaps thousands of c. AMP molecules or Ca 2+ ions in the cytosol. • Each of these, in turn, by activating its target protein affects the activity of multiple downstream proteins.
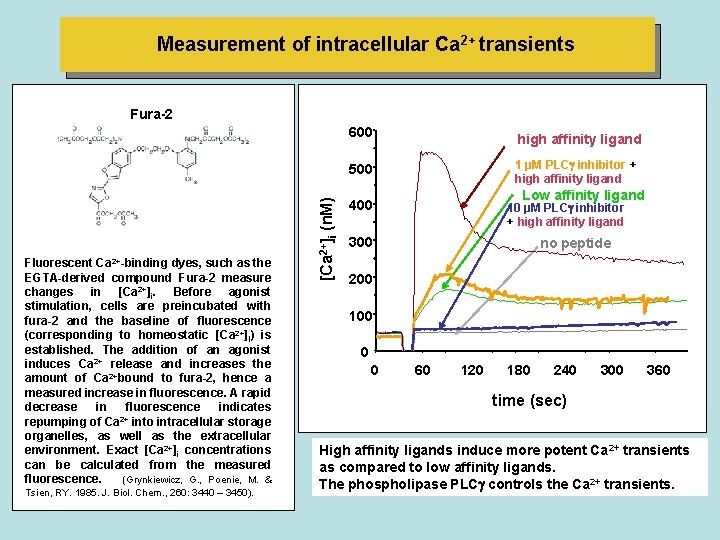
Measurement of intracellular Ca 2+ transients Fura-2 600 high affinity ligand 1 µM PLC inhibitor + high affinity ligand Fluorescent Ca 2+-binding dyes, such as the EGTA-derived compound Fura-2 measure changes in [Ca 2+]i. Before agonist stimulation, cells are preincubated with fura-2 and the baseline of fluorescence (corresponding to homeostatic [Ca 2+]I) is established. The addition of an agonist induces Ca 2+ release and increases the amount of Ca 2+bound to fura-2, hence a measured increase in fluorescence. A rapid decrease in fluorescence indicates 2+ repumping of Ca into intracellular storage organelles, as well as the extracellular environment. Exact [Ca 2+]i concentrations can be calculated from the measured fluorescence. (Grynkiewicz, G. , Poenie, M. & Tsien, RY. 1985. J. Biol. Chem. , 260: 3440 – 3450). [Ca 2+]i (n. M) 500 Low affinity ligand 400 10 µM PLC inhibitor + high affinity ligand 300 no peptide 200 100 0 0 60 120 180 240 300 360 time (sec) High affinity ligands induce more potent Ca 2+ transients as compared to low affinity ligands. The phospholipase PLC controls the Ca 2+ transients.
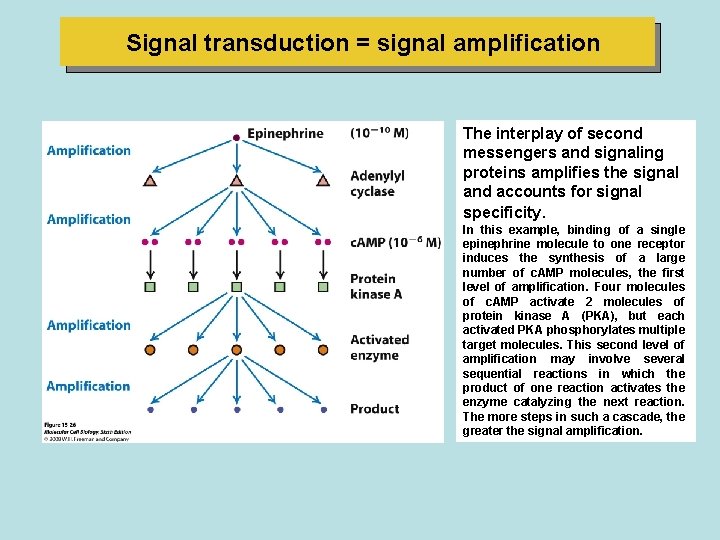
Signal transduction = signal amplification The interplay of second messengers and signaling proteins amplifies the signal and accounts for signal specificity. In this example, binding of a single epinephrine molecule to one receptor induces the synthesis of a large number of c. AMP molecules, the first level of amplification. Four molecules of c. AMP activate 2 molecules of protein kinase A (PKA), but each activated PKA phosphorylates multiple target molecules. This second level of amplification may involve several sequential reactions in which the product of one reaction activates the enzyme catalyzing the next reaction. The more steps in such a cascade, the greater the signal amplification.
General elements of G protein-coupled receptor (GPCR) systems
• The most numerous class of receptors-found in organisms from yeast to man-are the G protein coupled receptors (GPCRs). • Receptor activation by ligand binding triggers activation of the coupled trimeric G protein, which interacts with downstream signal-transduction proteins. • All GPCR signaling pathways share the following common elements: • (1) a receptor that contains seven membrane-spanning domains; • (2) a coupled trimeric G protein, which functions as a switch by cycling between active and inactive forms; (3) a membrane-bound effector protein; and • (4) feedback regulation and desensitization of the signaling pathway. A second messenger also occurs in many GPCR pathways. • GPCR pathways usually have short-term effects in the cell by quickly modifying existing proteins' either enzymes or ion channels. • These pathways allow cells to respond rapidly to a variety of signals, whether they be environmental stimuli such as light or hormonal stimuli such as epinephrine.
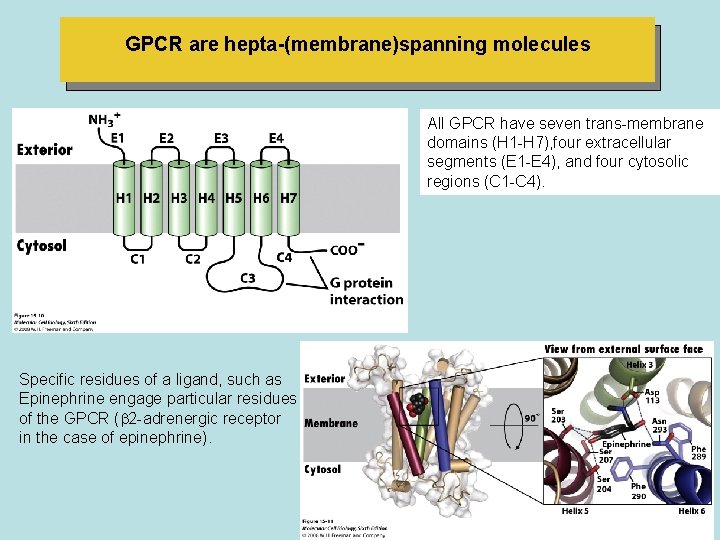
GPCR are hepta-(membrane)spanning molecules All GPCR have seven trans-membrane domains (H 1 -H 7), four extracellular segments (E 1 -E 4), and four cytosolic regions (C 1 -C 4). Specific residues of a ligand, such as Epinephrine engage particular residues of the GPCR ( 2 -adrenergic receptor in the case of epinephrine).
• In mammals, the liberation of glucose and fatty acids can be triggered by binding of epinephrine (or its derivative norepinephrine) to -adrenergic receptors on the surface of hepatic (liver) and adipose cells. • Epinephrine bound to -adrenergic receptors on heart muscle cells increases the contraction rate, which increases the blood supply to the tissues. • In contrast, epinephrine stimulation of -adrenergic receptors on smooth muscle cells of the intestine causes them to relax. • Another type of epinephrine receptor, the -adrenergic receptor, is found on smooth muscle cells lining the blood vessels in the intestinal tract, skin, and kidneys. • Binding of epinephrinet o these receptors causes the arteries to constrict, cutting off circulation to these peripheral organs. • The diverse effects of epinephrine help orchestrate integrated responses throughout the body all directed to a common end: supplying energy that can be used for the rapid movement of major locomotor muscles in response to bodily stress
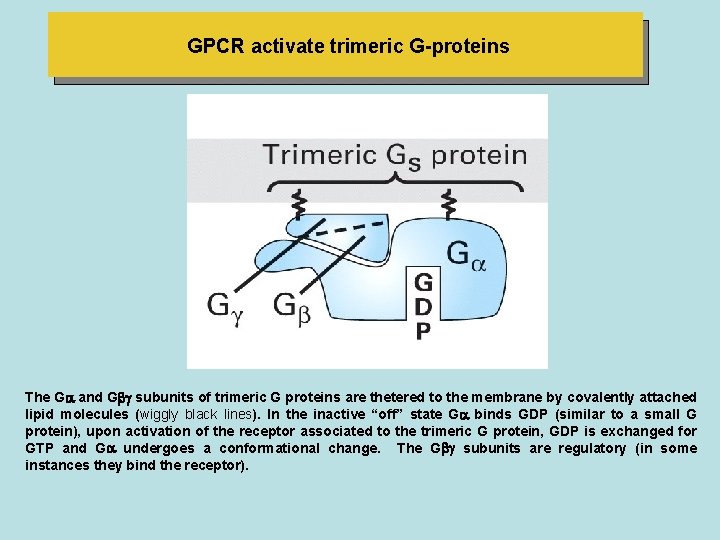
GPCR activate trimeric G-proteins The G-Protein The G and G subunits of trimeric G proteins are thetered to the membrane by covalently attached lipid molecules (wiggly black lines). In the inactive “off” state G binds GDP (similar to a small G protein), upon activation of the receptor associated to the trimeric G protein, GDP is exchanged for GTP and G undergoes a conformational change. The G subunits are regulatory (in some instances they bind the receptor).
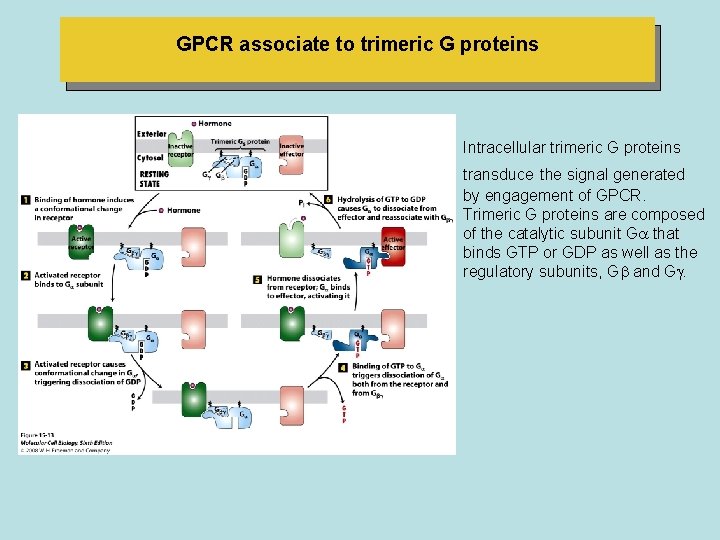
GPCR associate to trimeric G proteins Intracellular trimeric G proteins transduce the signal generated by engagement of GPCR. Trimeric G proteins are composed of the catalytic subunit G that binds GTP or GDP as well as the regulatory subunits, G and G
• The GPCR signal transduction system contains a built-in feedback mechanism that ensures the effector protein becomes activated only for a few seconds or minutes following receptor activation; continual activation of receptors via Iigand binding is essential for prolonged activation of the effector. • Model is supported by results from experiments with compounds that can bind to G subunits as well as GTP does, but cannot be hydrolyzed by the intrinsic GTPase. • In some of these compounds, the P-O-P phosphodiester linkage connecting to & phosphates GTP is replaced by a non- hydrolyzable PCH 2 -P or P-NH-P linkage. • Addition of such a GTP analog to a plasma membrane prepararion in the presence of the natural ligand or an agonist for a particular receptor results in a much longer-lived activation of the associated effector protein than occurs with GTP. • In this experiment, once the nonhydrolyzable GTP analog is exchanged for GDP bound to Go, it remains permanently bound to G. • Because the G -analog complex is as functional as the normal G - GTP complex in activating the effector protein, the effector remains permanently active.
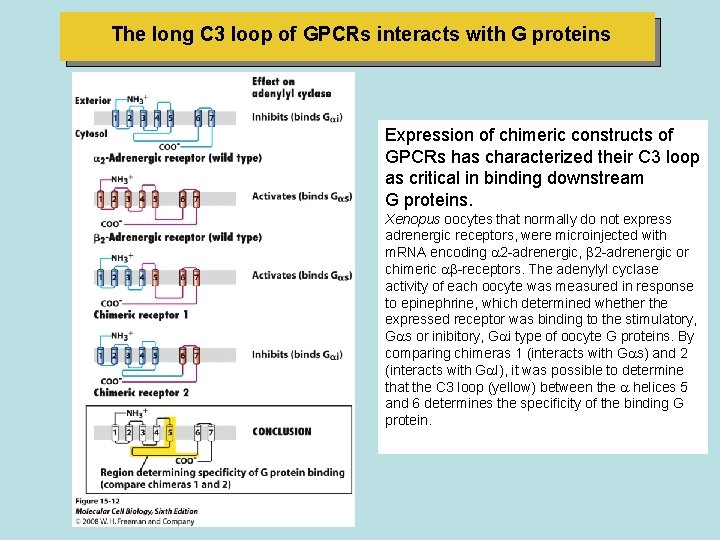
The long C 3 loop of GPCRs interacts with G proteins Expression of chimeric constructs of GPCRs has characterized their C 3 loop as critical in binding downstream G proteins. Xenopus oocytes that normally do not express adrenergic receptors, were microinjected with m. RNA encoding 2 -adrenergic, 2 -adrenergic or chimeric -receptors. The adenylyl cyclase activity of each oocyte was measured in response to epinephrine, which determined whether the expressed receptor was binding to the stimulatory, G s or inibitory, G i type of oocyte G proteins. By comparing chimeras 1 (interacts with G s) and 2 (interacts with G I), it was possible to determine that the C 3 loop (yellow) between the helices 5 and 6 determines the specificity of the binding G protein.
Different G proteins are activated by different GPCRs and in turn regulate different effector proteins • Table 15 -1 summarizes the functions of the major classes of G proteins with different Go subunits. • Some bacterial toxins contain a subunit that penetrates the plasma membrane of target mammalian cells and in the cytosol catalyzes a chemical modification of G proteins that prevents hydrolysis of bound GTP to GDP. • For example, toxins produced by the bacterium Vibrio cholera, which causes cholera or certain strains of E. coli modify the G , protein in intestinal epithelial cells. • As a result, Go, remains in the active state, continuously activating the effector adenylyl cyclase in the absence of hormonal stimulation. • The resulting excessive rise in intracellular c. AMP leads to the loss of electrolytes and water into the intestinal lumen, producing the watery diarrhea characteristic of infection by these bacteria.
• The toxin produced by Bordetella pertwssis, a bacterium that commonly infects the respiratory tract and causes whooping cough, catalyzes a modification of G i that prevents release of bound GDP. • As a result, G i is locked in the inactive state, reducing the inhibition of adenylyl cyclase. • The resulting increase in c. AMP in epithelial cells of the arrways promotes loss of fluids and electrolytesa nd mucus secretion. I
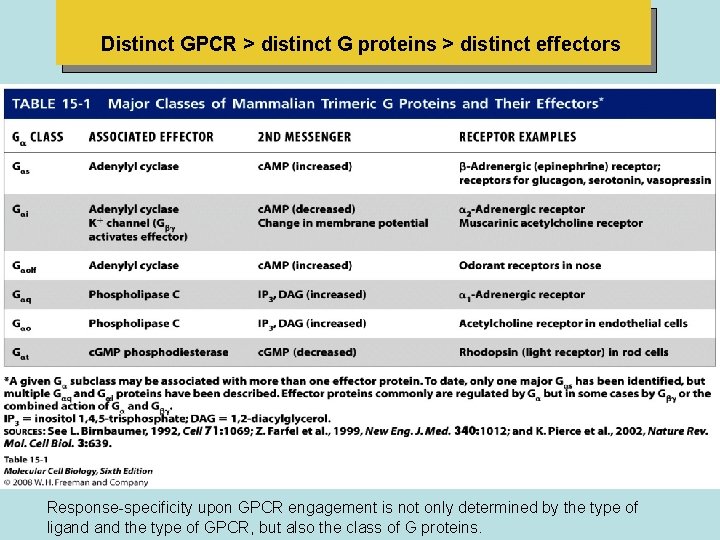
Distinct GPCR > distinct G proteins > distinct effectors Response-specificity upon GPCR engagement is not only determined by the type of ligand the type of GPCR, but also the class of G proteins.
GPCRs that activate or inhibit Adenylyl Cyclase
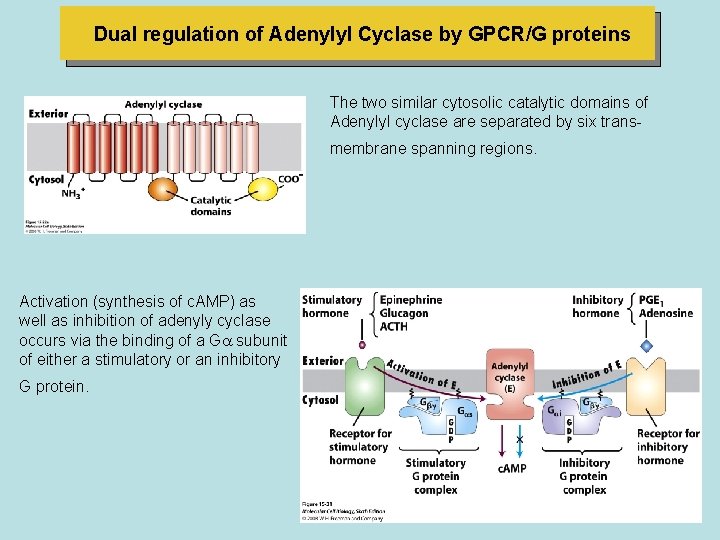
Dual regulation of Adenylyl Cyclase by GPCR/G proteins The two similar cytosolic catalytic domains of Adenylyl cyclase are separated by six transmembrane spanning regions. Activation (synthesis of c. AMP) as well as inhibition of adenyly cyclase occurs via the binding of a G subunit of either a stimulatory or an inhibitory G protein.
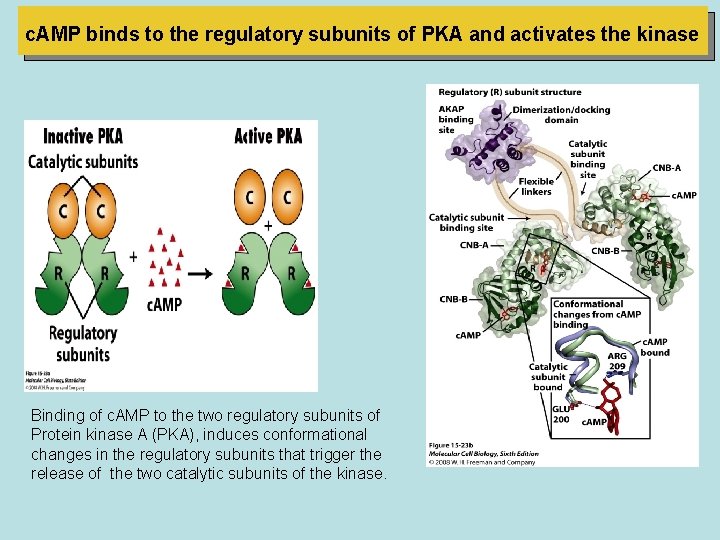
c. AMP binds to the regulatory subunits of PKA and activates the kinase Binding of c. AMP to the two regulatory subunits of Protein kinase A (PKA), induces conformational changes in the regulatory subunits that trigger the release of the two catalytic subunits of the kinase.
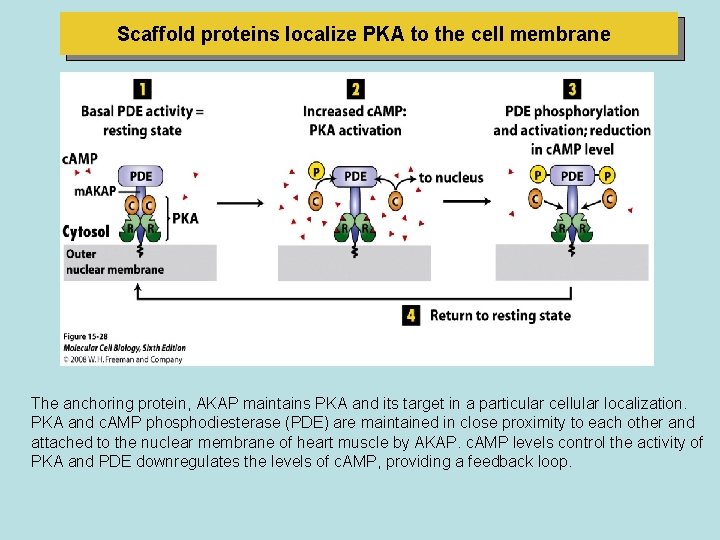
Scaffold proteins localize PKA to the cell membrane The anchoring protein, AKAP maintains PKA and its target in a particular cellular localization. PKA and c. AMP phosphodiesterase (PDE) are maintained in close proximity to each other and attached to the nuclear membrane of heart muscle by AKAP. c. AMP levels control the activity of PKA and PDE downregulates the levels of c. AMP, providing a feedback loop.
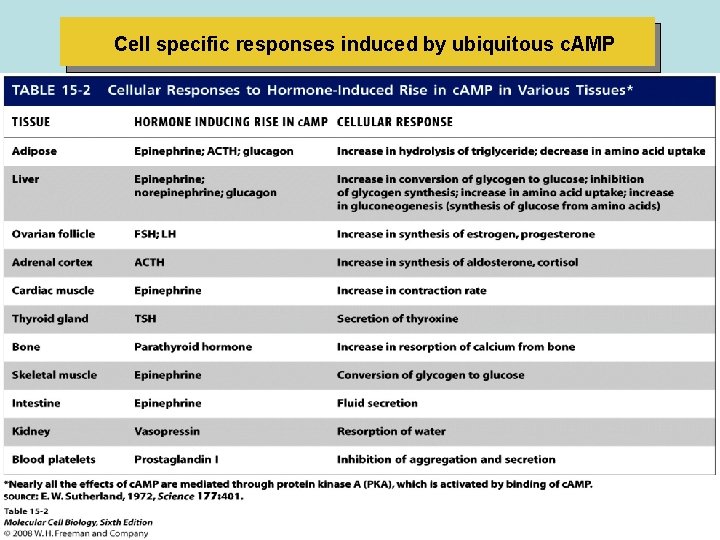
Cell specific responses induced by ubiquitous c. AMP
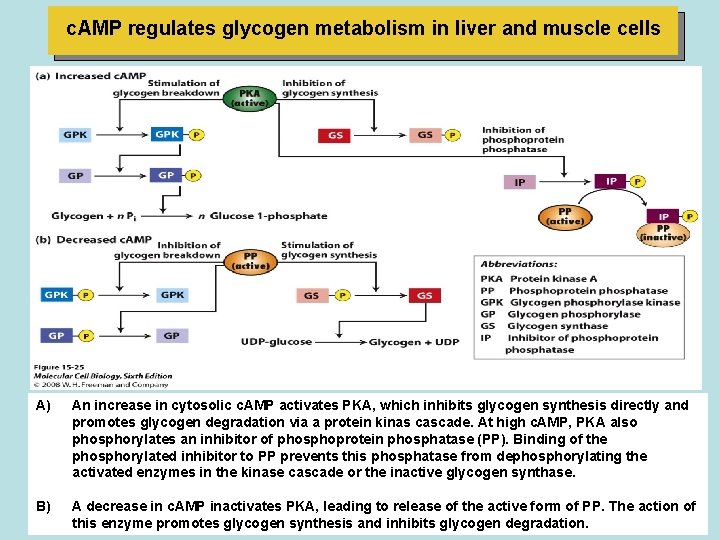
c. AMP regulates glycogen metabolism in liver and muscle cells A) An increase in cytosolic c. AMP activates PKA, which inhibits glycogen synthesis directly and promotes glycogen degradation via a protein kinas cascade. At high c. AMP, PKA also phosphorylates an inhibitor of phosphoprotein phosphatase (PP). Binding of the phosphorylated inhibitor to PP prevents this phosphatase from dephosphorylating the activated enzymes in the kinase cascade or the inactive glycogen synthase. B) A decrease in c. AMP inactivates PKA, leading to release of the active form of PP. The action of this enzyme promotes glycogen synthesis and inhibits glycogen degradation.
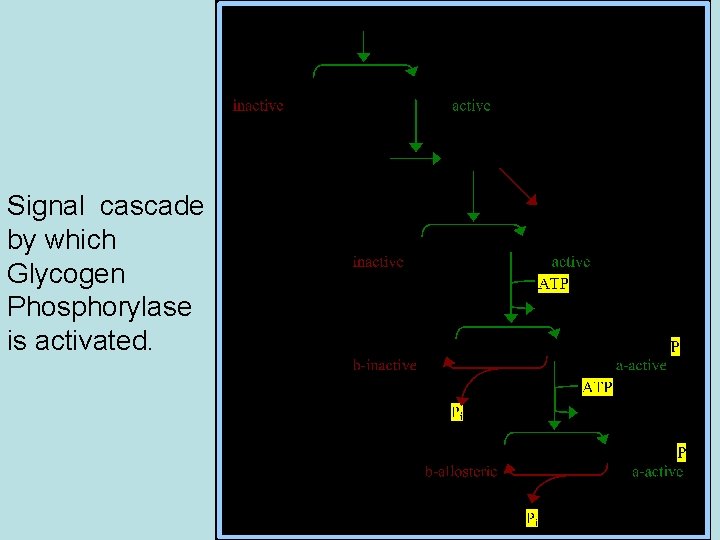
Signal cascade by which Glycogen Phosphorylase is activated.
GPCRs that activate phospholipase C (PLC)
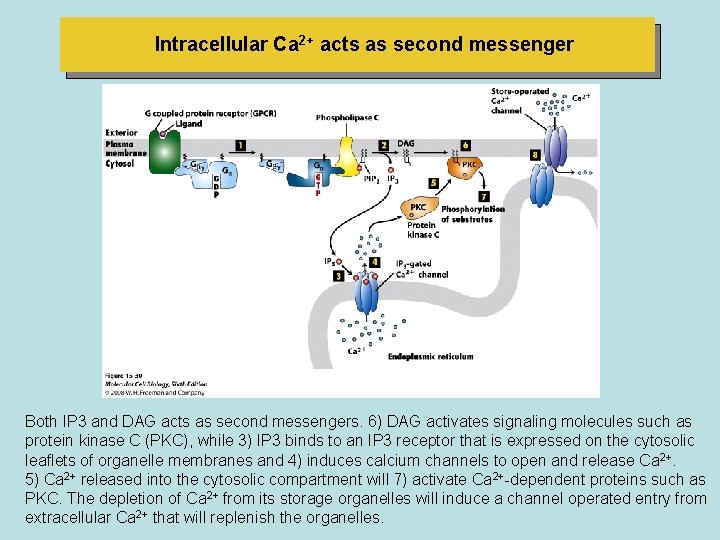
Intracellular Ca 2+ acts as second messenger Both IP 3 and DAG acts as second messengers. 6) DAG activates signaling molecules such as protein kinase C (PKC), while 3) IP 3 binds to an IP 3 receptor that is expressed on the cytosolic leaflets of organelle membranes and 4) induces calcium channels to open and release Ca 2+. 5) Ca 2+ released into the cytosolic compartment will 7) activate Ca 2+-dependent proteins such as PKC. The depletion of Ca 2+ from its storage organelles will induce a channel operated entry from extracellular Ca 2+ that will replenish the organelles.
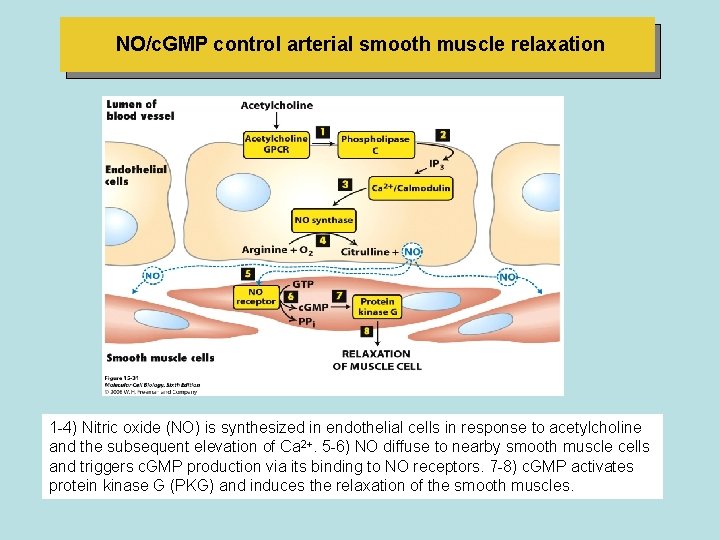
NO/c. GMP control arterial smooth muscle relaxation 1 -4) Nitric oxide (NO) is synthesized in endothelial cells in response to acetylcholine and the subsequent elevation of Ca 2+. 5 -6) NO diffuse to nearby smooth muscle cells and triggers c. GMP production via its binding to NO receptors. 7 -8) c. GMP activates protein kinase G (PKG) and induces the relaxation of the smooth muscles.
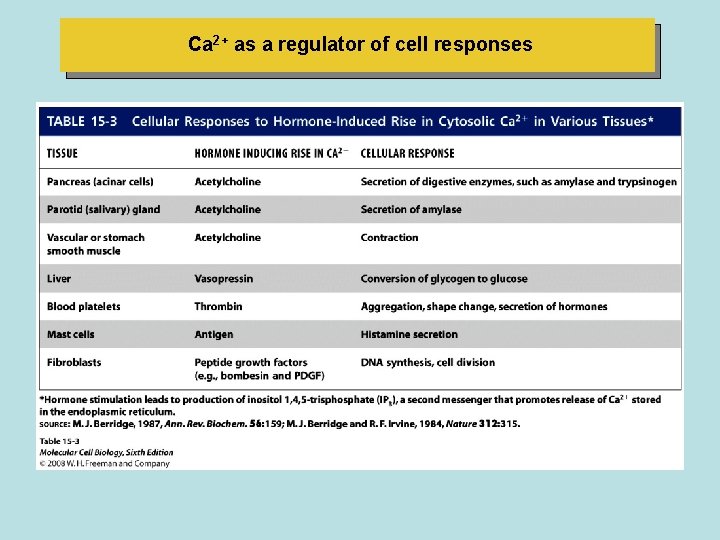
Ca 2+ as a regulator of cell responses
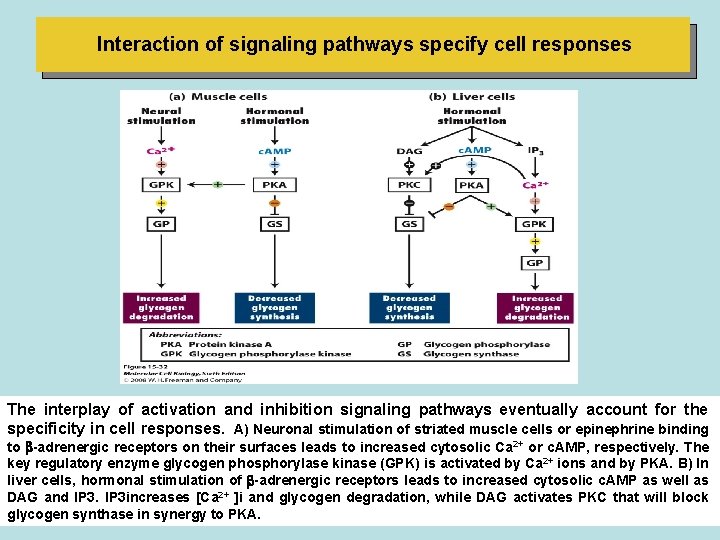
Interaction of signaling pathways specify cell responses The interplay of activation and inhibition signaling pathways eventually account for the specificity in cell responses. A) Neuronal stimulation of striated muscle cells or epinephrine binding to -adrenergic receptors on their surfaces leads to increased cytosolic Ca 2+ or c. AMP, respectively. The key regulatory enzyme glycogen phosphorylase kinase (GPK) is activated by Ca 2+ ions and by PKA. B) In liver cells, hormonal stimulation of -adrenergic receptors leads to increased cytosolic c. AMP as well as DAG and IP 3 increases [Ca 2+ ]i and glycogen degradation, while DAG activates PKC that will block glycogen synthase in synergy to PKA.
- Slides: 62