CEILINGS AND FLOORS GENDER WAGE GAPS BY EDUCATION

CEILINGS AND FLOORS: GENDER WAGE GAPS BY EDUCATION IN SPAIN Sara de la Rica *, Juan J. Dolado* * & Vanesa Llorens** * (*) UPV & IZA (**) UCIII & CEPR & IZA (***) LECG
 (Wm- Wf)/ Wf • Traditional: At the mean")
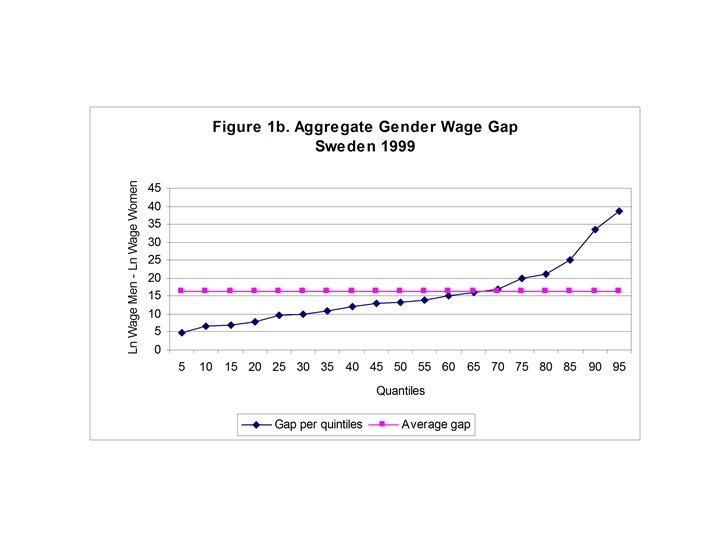
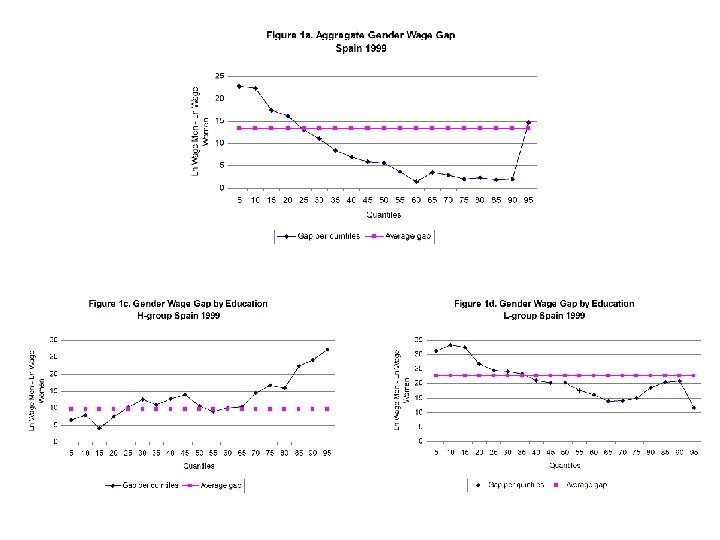
Motivation • Gender wage gaps: ln(Wm/Wf) (Wm- Wf)/ Wf • Traditional: At the mean vs. New: At the quantiles • Recent evidence about Glass Ceilings in Sweden (Albrecht et al. , 2003) • Southern vs. Central & Northern Europe
: High female participation rate (80%")
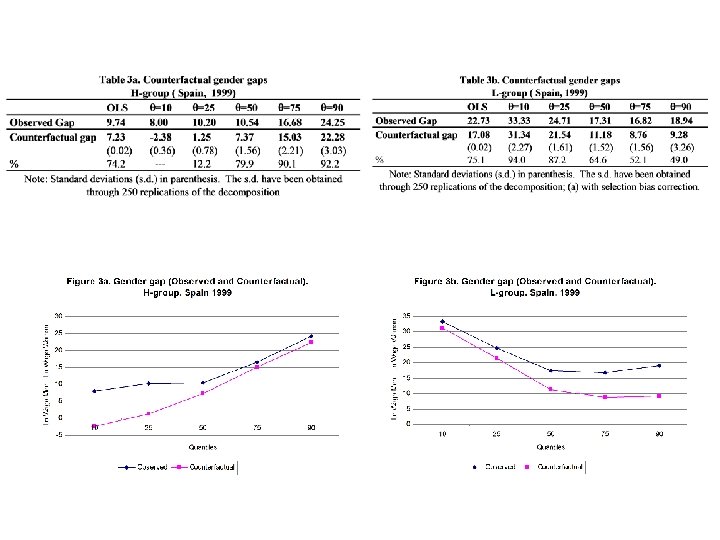
• Composition effect by Education ØGlass Ceiling (H-Group): High female participation rate (80% vs 85%) Lower job stability (Lazear and Rosen, 1990) leads to lower promotion opportunities and higher wages (PUZZLE) ØGlass Floor (L-Group): Low female participation rate (48% vs 68%) Statistical discrimination at the bottom of the wage distribution

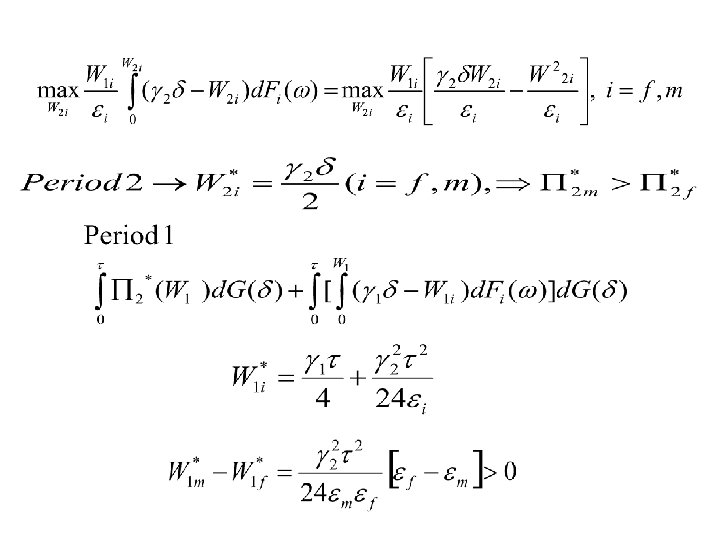
INTERPRETATIVE MODELS • L-Group Ø Ability for men and women: , c. d. f. G( ) Ø Need of training in period 1 (2 periods) Ø Productivity: 1 , 0< 1 <1 (period 1), 2 , 1 < 1< 2 (period 2) Ø Firms know at the begining of period 2 Ø Workers receive a disutility shock with c. d. f. F( ) after wages in period 1 & 2, Wi (i=1, 2) are chosen by the firm. Workers do not quit if Wi - 0. Ø No wage renegotiation nor outside wage offers (monopsony) Ø Fm( )>Ff( ) Ø G( )= U[0, ]; fm( ) =U[0, m]; ff( ) =U[0, f]; f> m
 Ø A model of job ladders: A")
• H-Group (Lazear and Rosen, 1990) Ø A model of job ladders: A (no training), B (training) Ø A: , ; B: 1 , 2 Ø Firms pay competitive wages in period 2: WA 2= , WB 2= 2 Ø Cut-off points to allocate to B: *f> *m Less women are promoted but conditional on being promoted they should be earn higher wages Ø Explanations: (i) Different ability distribution (Mincer and Polacheck, 1974), (ii) Different outside offers (Booth et. al. , 2003), (iii) Different competing skills (Gneezy et al. , 2003, Babcock and Laschever, 2003)
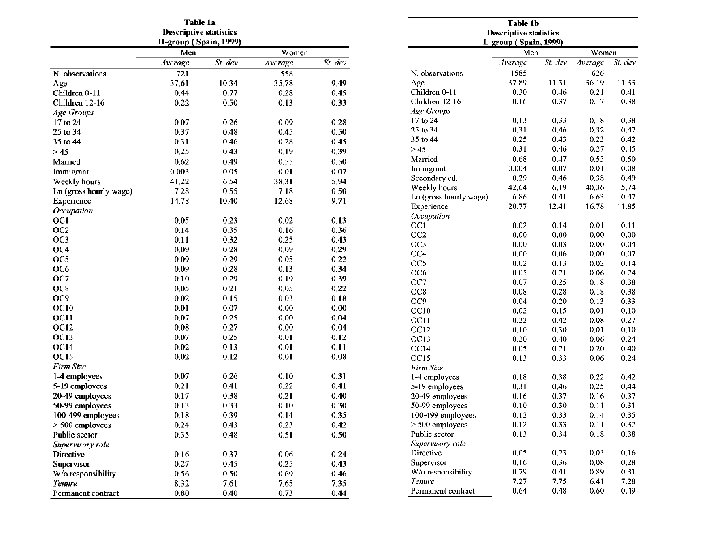
 –H-Group: 721 (Men), 558 (Women) –L-Group: 1585 (Men), 626")
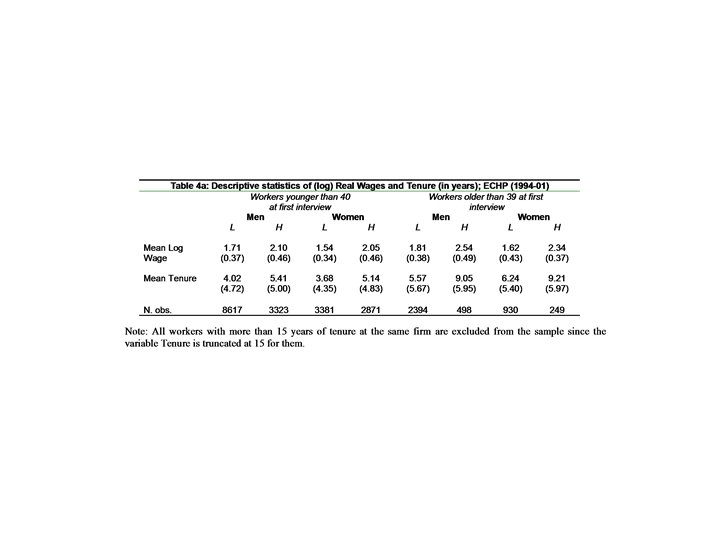
• Data –ECHP (1999) –H-Group: 721 (Men), 558 (Women) –L-Group: 1585 (Men), 626 (Women) • Quantile Regressions (QR) Buchinsky (1998), Koenker and Basset (1978)
, marital st. , tenure, children age, Sec. Edn (L-W) , type")
Covariates -Exp (age), marital st. , tenure, children age, Sec. Edn (L-W) , type of contract, immigrant, public, firm size, supervisory role, region, size local council, occupations.
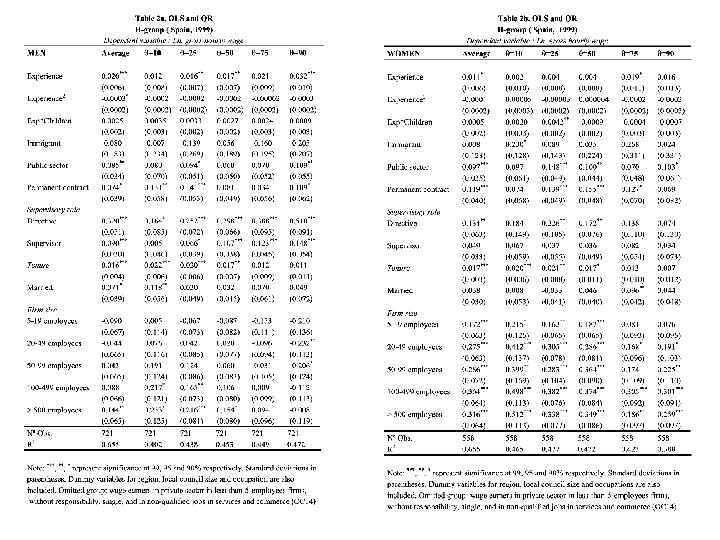
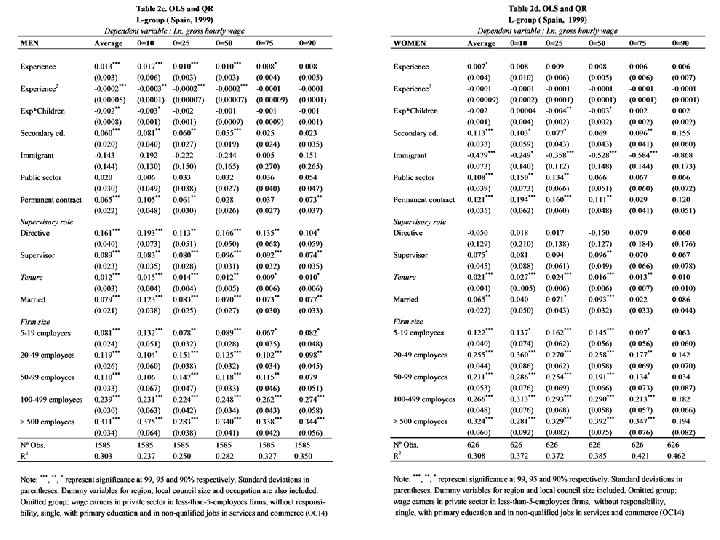
![• Different QR by gender and by education [Tables 2 a-d] i. H-group](http://slidetodoc.com/presentation_image_h2/058ec2ba929aa56fae4f44e8e460342b/image-16.jpg "• Different QR by gender and by education [Tables 2 a-d] i. H-group")
• Different QR by gender and by education [Tables 2 a-d] i. H-group § Higher returns to experience ( ), being married ( ), supervisory role ( ), (Men) § Higher returns for public sector, size>20, OC 4 -6 (Women) ii. L-group § Higher returns for experience ( ), being married and supervisory role ( ) (Men) § Higher returns to tenure ( ) (Women) , § Higher returns for public sector, permanent contract, secondary attainment, public sector (Women)
")
GENDER GAP DECOMPOSITION (Oaxaca-Blinder)
![MM decomposition • • Draw θ-th quantile from U[0, 1] Estimate βm (θ) Draw](http://slidetodoc.com/presentation_image_h2/058ec2ba929aa56fae4f44e8e460342b/image-18.jpg "MM decomposition • • Draw θ-th quantile from U[0, 1] Estimate βm (θ) Draw")
MM decomposition • • Draw θ-th quantile from U[0, 1] Estimate βm (θ) Draw xf and construct βm (θ) xf. Repeat N=100 times Construct counterfactual gap ( M=250 times): βm (θ) xf - βf (θ) xf = (βm (θ) - βf (θ)) xf. Returns
 to follow workers in their")
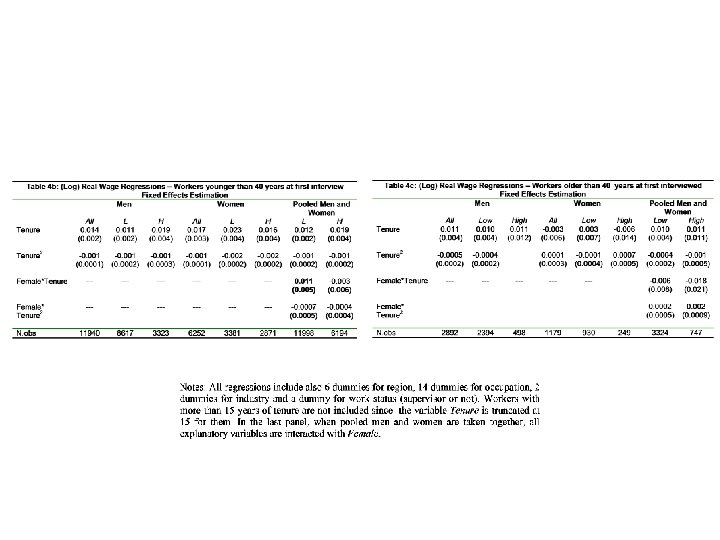
PANEL & STAT. DCN. • ECHP waves (1994 -01) to follow workers in their jobs over time. • Follow approach in Farber & Gibbons (1996) • Interact Tenure* Female • RESULT: Only Positive & Significant for L -group.

CONCLUSIONS • New finding: Glass Floors • Due to statistical dcn. in countries with low participation of L-women. • Further research: - Other alternatives for H-group (stress leaves) - Endogenize Participation (with S. de la Rica and C. Gª-Peñalosa…in progess) - Academic women-economists (with M. Almunia and F. Felgueroso)
- Slides: 23