Cedar Falls Community School District 201920 SCHOOL YEAR


 Includes:")
 $14 $12, 00 $11, 98 $12, 25 $4, 88 $5,")


")


 Special Education Enrollment Served as Least One Day During the School Year")


 has developed")


 $700 $650 $600 $638 $612 $550 $603 $585 $545 $528")

 $1 200 $1 074 $1 100 $1 000 $948 $938")

 $25 000 $20 000 $15 000 $10 000 $5")
 $30, 0 $25, 0 $29, 37 $27, 78 $20,")

![Millions Statewide School Infrastructure Sales & Service Tax [SAVE] (33) $16, 0 $13, 52](https://slidetodoc.com/presentation_image_h2/679bbd992db96759bf6e76217d28ca89/image-39.jpg "Millions Statewide School Infrastructure Sales & Service Tax [SAVE] (33) $16, 0 $13, 52")

 $5, 0 $4, 5 $4, 0 $3,")

 $0, 4 $0, 32 $0, 3 $0, 2 $0,")

![Enterprise [Nutrition] Fund (61 & 68) Thousands 2015/16 2016/17 2017/18 2018/19 2019/20 $1 400](https://slidetodoc.com/presentation_image_h2/679bbd992db96759bf6e76217d28ca89/image-46.jpg "Enterprise [Nutrition] Fund (61 & 68) Thousands 2015/16 2016/17 2017/18 2018/19 2019/20 $1 400")
![Millions Enterprise [Nutrition] Fund Revenue & Expenditure Summary $3, 0 $2, 8 $2, 6](https://slidetodoc.com/presentation_image_h2/679bbd992db96759bf6e76217d28ca89/image-47.jpg "Millions Enterprise [Nutrition] Fund Revenue & Expenditure Summary $3, 0 $2, 8 $2, 6")
 $18 100 $17 600 $17 100 $16 600 $16")
 $1, 8 $1, 6 $1, 4 $1, 2 $1, 0")

- Slides: 51
Cedar Falls Community School District 2019/20 SCHOOL YEAR CERTIFIED ANNUAL REPORT OCTOBER 12, 2020
Topic Highlights 1. WHAT IS THE CERTIFIED ANNUAL REPORT 2. GOVERNMENTAL, PROPRIETARY AND 3. 4. 5. 6. FIDUCIARY FUNDS REVENUE & EXPENDITURES SPECIAL EDUCATION SUPPLEMENT KEY FINANCIAL INDICATORS ACKNOWLEDGMENTS
A financial report ALL Iowa public school districts and AEA’s are required to complete
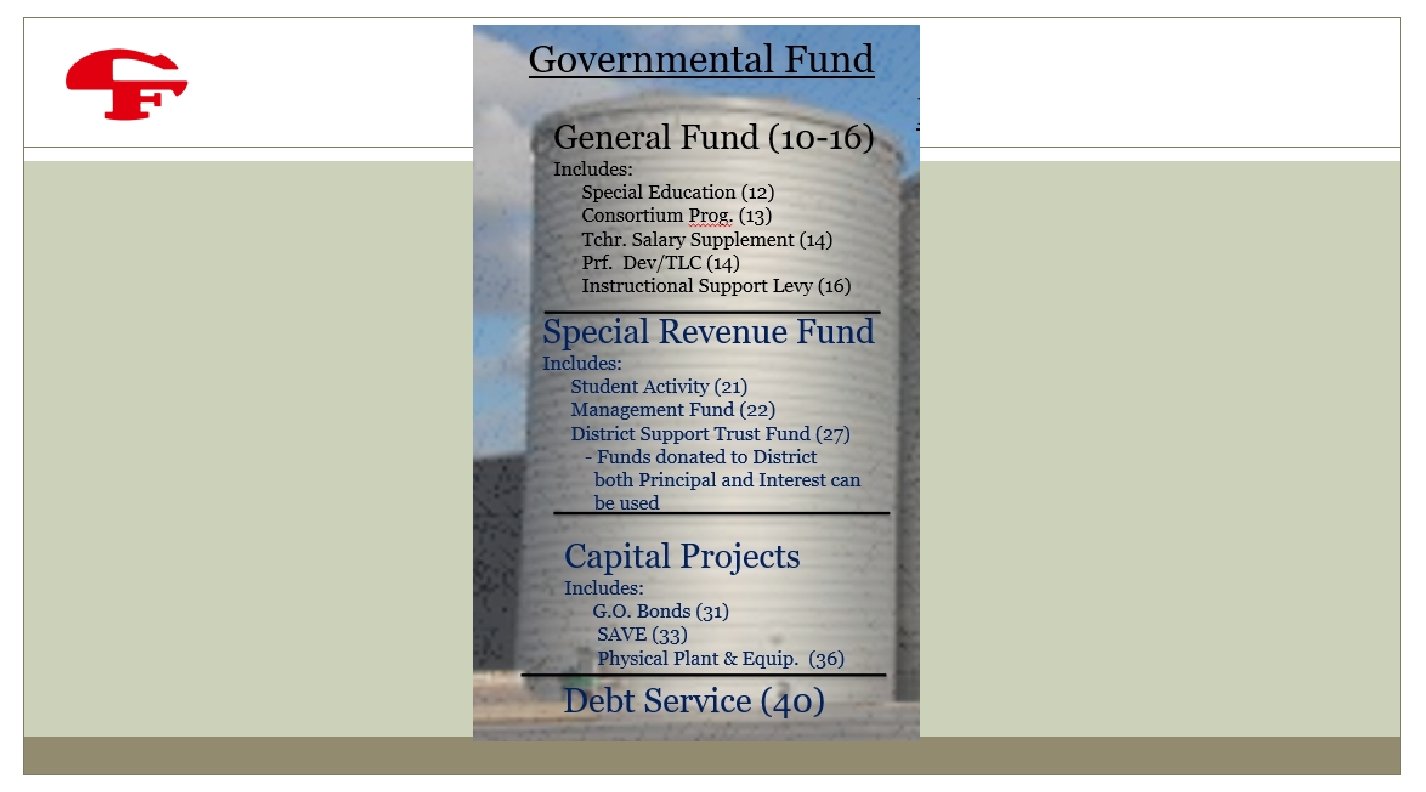
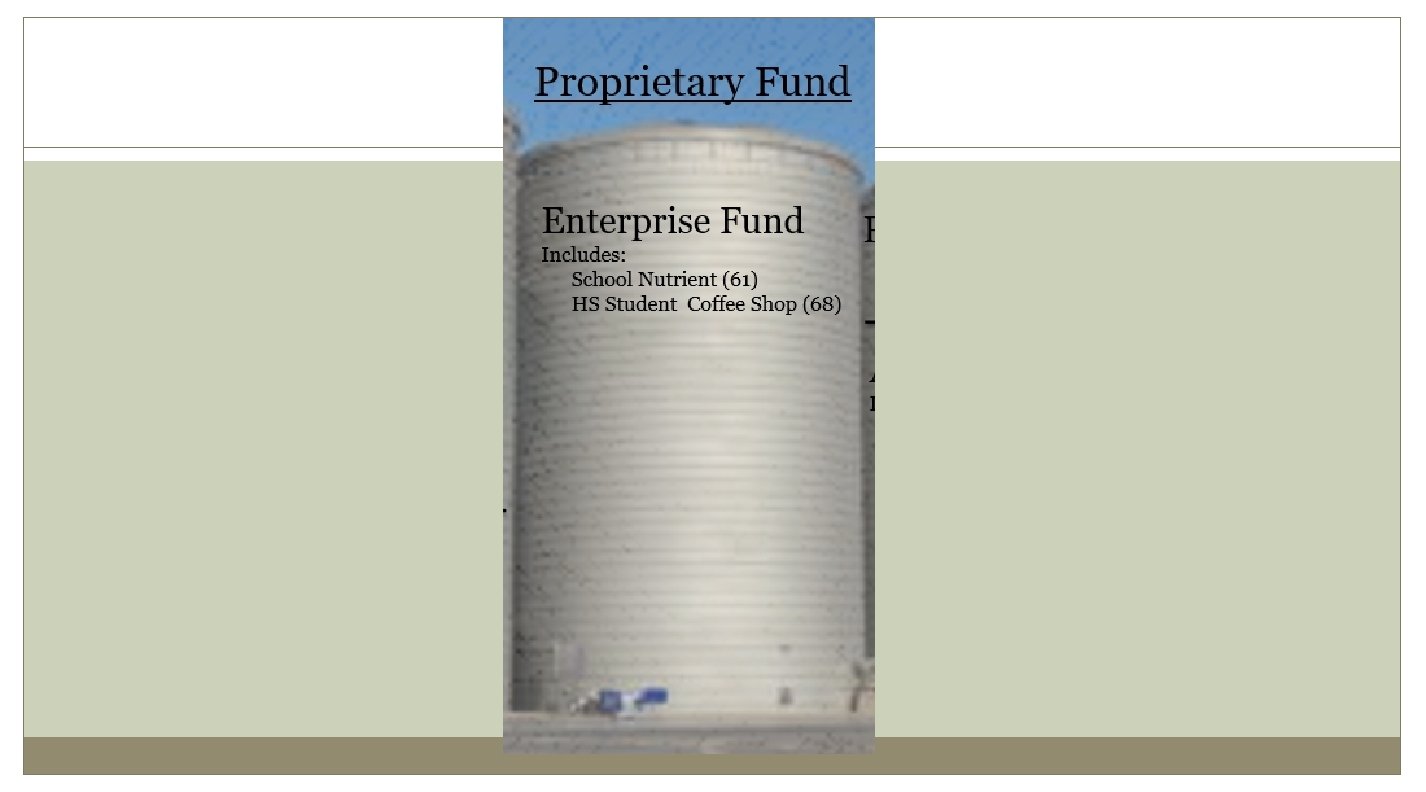
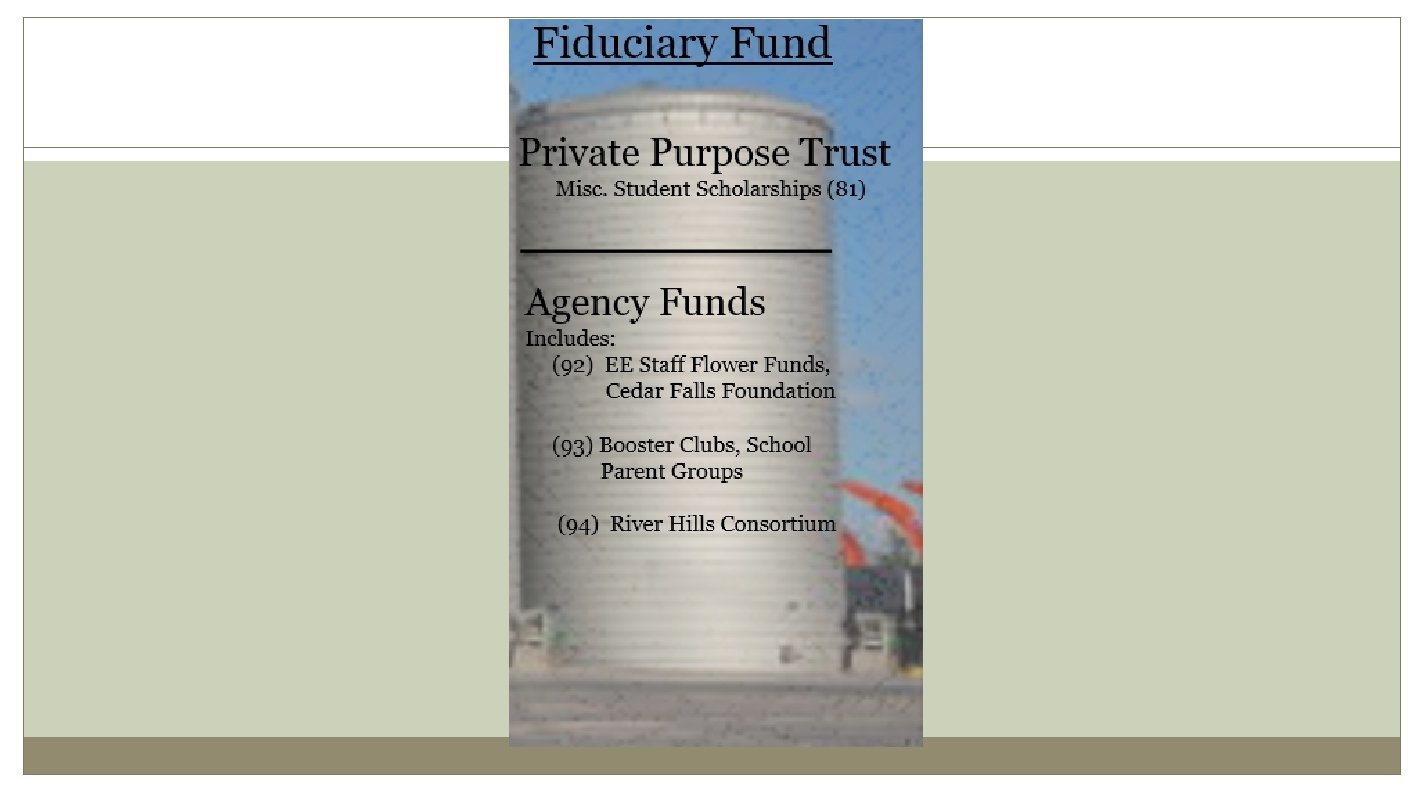
Cedar Falls CSD – Summary of Funds Governmental Fund General Fund (10 -16) Includes: Special Education (12) Consortium Prog. (13) Tchr. Salary Supplement (14) Prf. Dev/TLC (14) Instructional Support Levy (16) Special Revenue Fund Includes: Student Activity (21) Management Fund (22) District Support Trust Fund (27) - Funds donated to District both Principal and Interest can be used Capital Projects Includes: G. O. Bonds (31) SAVE (33) Physical Plant & Equip. (36) Debt Service (40) Proprietary Fund Fiduciary Fund Enterprise Fund Includes: School Nutrient (61) HS Student Coffee Shop (68) Private Purpose Trust Misc. Student Scholarships (81) Agency Funds Includes: (92) EE Staff Flower Funds, Cedar Falls Foundation (93) Booster Clubs, School Parent Groups (94) River Hills Consortium
Millions General Fund (10) $14 $12, 00 $11, 98 $12, 25 $4, 88 $5, 27 $11, 21 $11, 90 $10 $8 $6 $5, 48 $4 $4, 32 $4, 71 $2 $0 2015/16 2016/17 Total Assets 2017/18 Fund Balance Succeeding year property tax receivable are not included. 2018/19 2019/20
Millions General Fund Revenue & Expenditure Summary $65 $60 $55 $50 $ 58, 93 $ 56, 22 $ 51, 25 $52, 86 $58, 53 $ 61, 18 $ 59, 21 $60, 17 $60, 78 $56, 83 $45 $40 $35 $30 $25 2015/16 2016/17 Revenue 2017/18 2018/19 Expenditures Amounts shown are not reflective of changes in the District’s authorized budget authority. 2019/20
General Fund Revenue Comparison 100% 90% 80% 70% 60% 50% 40% 30% 20% 10% 0% 10, 09% 9, 88% 8, 89% 54, 38% 54, 27% 54, 64% 35, 54% 35, 85% 36, 47% FY 18 FY 19 FY 20 Property Tax Due to rounding percentages may not total 100. 0% State Misc. Income
General Fund Revenue Comparison $60 000 000 $5 439 003 $2 524 526 $6 075 879 $5 942 894 $2 407 144 $5 725 440 $5 847 731 $2 426 393 $5 750 401 $23 912 390 $23 958 860 $24 828 724 $20 939 862 $21 227 130 $22 308 382 FY 18 FY 19 FY 20 $40 000 $30 000 $20 000 $10 000 $0 Property Taxes State Aid State Categorical AEA Flow Thru Misc. Income
General Fund Miscellaneous Income $8 000 Total $5, 847, 731 Total $5, 942, 894 Total $5, 439, 003 $7 000 $6 000 $5 000 $4 000 $2 123 041 $2 039 386 $1 678 535 $264 095 $240 014 $237 060 $3 555 758 $3 568 331 $3 523 408 $3 000 $2 000 $1 000 $0 FY 18 Local State FY 19 Federal FY 20
Changes in Federal Funding
FY 2020 General Fund Revenue Federal 2, 74% Local - Prop. Tax 36, 29% State 55, 03% Local - Other 5, 94% Due to rounding, percentages may not equal 100. 00%
FY 2020 General Fund Expenditures AEA Flow Thru Transportation 4, 15% 2, 81% Facility Operation 7, 83% Business/HR 2, 09% School Admin 5, 93% Exec Admin of Ed. Assessment Inst. Board Technology 1, 83% 0, 19% 0, 09%Serv Media 1, 08% Health 2, 38%Serv Guidance 0, 82% Attendance 2, 31% 0, 04% Due to rounding, percentages may not equal 100. 00% Instruction 68, 44%
2019 -20 Certified Annual Report Special Education Supplement Staff development Level 1 (. 72) Administrative Costs $4, 954 Salary & benefits licenses teachers General Ed Level 3 Level 2 (2. 74) $18, 851 Health Services Specialized transportation $6, 880 Para Educators in students IEP (1. 21) $8, 325 Specialized student physical education, travel training or accommodations for extracurricular activities Specialized supplies/equipment
2019 -20 Certified Annual Report Special Education Supplement � 574 resident students served at Cedar Falls Schools � 16 resident students served by other schools/agencies Cedar Rapids CSD Clarinda CSD Dike-New Hartford CSD Dunkerton CSD Janesville CSD Mason City CSD 2 1 1 2 Sioux City Storm Lake Waterloo CSD Waverly-Shell Rock CSD Note: A student may be counted more than once due to the following: 1 student moved facilities during FY 20 1 1 1 2 4
2019 -20 Certified Annual Report Special Education Supplement �Cedar Falls served 76 out of district students Charles City CSD Dike New Hartford CSD Hudson CSD Janesville CSD 1 4 6 3 Waterloo CSD 60 Waverly-Shell Rock CSD 1 State of Iowa 1 Note: A student may be counted more than once due to changes in special education weighting or a change in resident district. Cost associated with the education of these students comes from the above school districts (tuition in).
Combined (Total) Special Education Enrollment Served as Least One Day During the School Year 700 Total 642 650 600 77 550 34 666 83 42 633 676 666 76 76 17 16 583 2018/19 574 2019/20 74 21 500 450 400 350 300 2015/16 531 541 2016/17 Resident 538 2017/18 Tuition Out Tuition In
Resident Students Funded vs. Actual Students Served 620 601 600 580 560 590 583 558 565 562 556 2016/17 2017/18 2018/19 Student Funding Count Actual Served 2019/20 559 540 524 528 500 2015/16 Includes Tuition Out Students Note: Student count shown occurred on the previous year count day (ie: 2019/20 student count was on October 1, 2018)
Millions CAR-SES Total Receipts & Expenses $14, 0 $12, 0 $10, 0 $9, 43 $10, 23 $10, 90 $10, 85 $11, 32 $10, 92 $11, 61 $12, 01 $10, 74 $9, 93 $8, 0 $6, 0 $4, 0 $2, 0 2015/16 2016/17 Total Receipts 2017/18 2018/19 Total Expenditures 2019/20
Special Education Supplement
District Special Education Staff 140 123, 7 120 100 80 60 59, 0 102, 6 91, 8 83, 0 60, 5 59, 0 109, 6 61, 5 65, 5 40 2015/16 2016/17 Teachers 2017/18 Para-Professionals Staffing shown as FTE equivalent rounded to nearest tenth 2018/19 2019/20
CAR-SES End of Year Balance $0 2015/16 2016/17 2017/18 2018/19 2019/20 -$200 000 -$467 283 -$400 000 -$600 000 -$800 000 -$691 194 -$807 534 -$972 951 -$1 275 389 -$1 000 -$1 200 000 -$1 400 000 FY 20 balance subject to CAR review
2019/20 UEN SES Comparison -$8 662 181 IA. . . Du. . . -$5 766 709 -$3 887 797 SE. . . -$3 731 135 Lin. . . -$2 494 637 Am. . . -$2 359 091 Ma. . . Col. . . -$1 750 757 Ce. . . -$1 275 389 Wa. . . -$677 366 -$10 000 -$8 000 -$6 000 -$4 000 -$2 000 $0
School Finance – Spending Authority Term Explanation Type Cash on Hand Total Cash on Hand One Time State Aid Amount received from State Recurring Property Taxes Amount received from local property owners Recurring Miscellaneous Income Basically any income which is not State Aid or Property Tax One Time and/or Recurring Budget Authority Total amount the District can legally spend during fiscal year [Credit card limit] Recurring Authorized Unspent Budget Authority (Unspent Balance) Remaining amt. of spending authority at EOY (spending authority minus actual expenditures) One Time
General Fund Key Financial Indicators �The Iowa Association of School Boards (IASB) has developed key financial indicators to create a snapshot of a District’s financial health �Key General Fund dashboard indicators include: #1 Certified Enrollment #2 Financial Solvency Ratio #3 Unspent Budget Authority � #3 A Unspent Budget Authority Ratio #4 Annual Unspent Budget Authority Ratio
History of Certified Enrollment Students Key Trend Dashboard Indicator #1 6 000 5 800 5 600 5 400 5 200 5 000 4 800 4 600 4 400 4 200 4 000 Oct. 2013 Oct. 2014 Oct. 2015 Oct. 2016 Certified less PLS Oct. 2017 OE In Oct. 2018 Tuition In Oct. 2019 Oct. 2020 (not cert. )
Enrollment Funding Delay $1 000 $900 000 $800 000 $700 000 $600 000 $500 000 $400 000 $300 000 $200 000 $100 000 $0 2014/15 2016/17 2017/18 2018/19 2019/20 District granted additional budget spending authority. Cash for authority via cash reserve levy (1 year delay).
General Fund Financial Solvency Ratio Key Trend Dashboard Indicator #2 12% 10% 9, 78% 8% 7, 94% 8, 42% 6, 97% 7, 02% 6% 4% 2% 0% 2015/16 2016/17 2017/18 2018/19 2019/20 Committed, assigned & unassigned fund balance/General fund revenue less AEA flow thru. Measures the District’s fund equity position. IASB recommended minimum 5%. Goal 10% Subject to CAR Review
General Fund Unspent Budget Authority Millions Key Trend Dashboard Indicator #3 $10 $9 $8 $7 $6 $5 $4 $3 $2 $1 $0 $8, 61 $8, 53 $7, 93 2015/16 $7, 96 2016/17 Total Unspent Authority FY 20 Balance subject to CAR review. $7, 70 $7, 19 2017/18 $7, 10 $6, 76 2018/19 Unassigned/Unrestricted Unspent Authority $7, 66 $7, 08 2019/20
General Fund Unspent Budget Authority Ratio Key Trend Dashboard Indicator #3 A 16% 14% 12% 14, 00% 13, 06% 12, 89% 12, 17% 11, 62% 10, 86% 10% 8% 11, 19% 10, 57% 10, 34% 10, 05% 6% 4% 2% 0% 2015/16 2016/17 Total Unspent Authority Ratio 2017/18 2018/19 2019/20 Unassigned/Unrestricted Unspent Authority Ratio A goal of a 10% unassigned/unrestricted unspent authorized budget balance over maximum authorized budget ($6. 84 million) is desired. District is at 10. 34% for 2019/20. FY 20 Balance subject to CAR review.
General Fund Annual Unspent Budget Ratio Key Trend Dashboard Indicator #4 1, 50% 1, 00% 0, 90% 0, 50% 0, 00% -0, 50% 2015/16 -0, 04% 2016/17 -0, 13% 2017/18 -1, 00% -1, 50% -2, 00% FY 19 Balance subject to CAR review. 2018/19 -0, 99% -1, 45% 2019/20
Thousands Activity Fund (21) $700 $650 $600 $638 $612 $550 $603 $585 $545 $528 $500 $566 $541 $570 $565 $450 $400 $350 $300 2015/16 2016/17 Total Assets 2017/18 Fund Balance 2018/19 2019/20
Thousands Activity Fund Revenue & Expenditure Summary $1 200 $1 100 $1 090 $1 046 $900 $1 020 $994 $931 $937 $800 $918 $992 $968 $700 $600 $500 $400 $300 2015/16 2016/17 Revenue 2017/18 Expenditures 2018/19 2019/20
Thousands Management Fund (22) $1 200 $1 074 $1 100 $1 000 $948 $938 $1 072 $942 $933 $1 049 $1 038 $902 $896 $800 $700 $600 $500 $400 $300 2015/16 2016/17 Total Assets 2017/18 Fund Balance Succeeding year property tax receivable are not included. 2018/19 2019/20
Thousands Management Fund Revenue & Expenditure Summary $800 $750 $700 $650 $600 $550 $500 $450 $400 $350 $300 $757 $668 $647 $585 $590 $618 $634 $666 $525 2015/16 2016/17 Revenue 2017/18 Expenditures 2018/19 2019/20
District Support Trust Fund (27) $25 000 $20 000 $15 000 $10 000 $5 000 $0 2015/16 2016/17 Total Assets 2017/18 Fund Balance 2018/19 2019/20
Millions Capital Projects Fund (31) $30, 0 $25, 0 $29, 37 $27, 78 $20, 0 $15, 0 $10, 0 $9, 10 $5, 0 $6, 80 $0, 14 $0, 0 2016/17 2017/18 Total Assets 2018/19 Fund Balance $0, 00 2019/20
Millions Capital Projects Fund Revenue & Expenditure Summary $35 $33, 01 $30 $25 $21, 22 $20 $15 $10 $6, 81 $5, 23 $5 $0, 25 $0 2016/17 2017/18 Revenue $0, 05 2018/19 Expenditures $0, 00 $0, 04 2019/20
Millions Statewide School Infrastructure Sales & Service Tax [SAVE] (33) $16, 0 $13, 52 $13, 14 $12, 15 $14, 0 $12, 0 $10, 0 $8, 0 $6, 0 $10, 26 $10, 06 $9, 21 $8, 19 $8, 18 $7, 19 $7, 23 $9, 17 $8, 17 $7, 40 $6, 73 $5, 73 $4, 0 $2, 0 $0, 0 2015/16 2016/17 Total Assets 2017/18 Fund Balance 2018/19 Available Fund Balance 2019/20
Millions Statewide Sch. Infrastructure Sales & Service Tax Revenue & Expenditure Summary $25, 0 $20, 0 $15, 62 $8, 72 $10, 0 $5, 0 $4, 73 $3, 12 $6, 76 $4, 88 $9, 20 $6, 36 $5, 37 $6, 27 $0, 0 2015/16 2016/17 Revenue 2017/18 Expenditures 2018/19 2019/20
Millions Physical Plant & Equipment Levy (36) $5, 0 $4, 5 $4, 0 $3, 5 $3, 0 $2, 5 $2, 0 $1, 5 $1, 0 $0, 5 $0, 0 $4, 18 $3, 99 $4, 06 $3, 40 $3, 83 $4, 12 $3, 99 $4, 42 $4, 06 $3, 18 2015/16 2016/17 Total Assets 2017/18 Fund Balance Succeeding year property tax receivable are not included. 2018/19 2019/20
Millions Physical Plant & Equipment Levy Revenue & Expenditure Summary $6, 0 $5, 27 $5, 0 $4, 0 $3, 0 $5, 11 $3, 28 $2, 89 $3, 73 $3, 45 $3, 73 $3, 78 $3, 70 $2, 80 $2, 0 $1, 0 $0, 0 2015/16 2016/17 Revenue 2017/18 Expenditures 2018/19 2019/20
Millions Debt Service Levy (40) $0, 4 $0, 32 $0, 3 $0, 2 $0, 1 $0, 07 $0, 1 $0, 00 2015/16 $0, 02 $0, 00 2016/17 Total Assets 2017/18 Fund Balance 2018/19 2019/20
Millions Debt Service Levy Revenue & Expenditure Summary $25, 0 $20, 56 $20, 0 $15, 0 $10, 0 $5, 74 $5, 0 $5, 14 $5, 93 $2, 78 $0, 0 2015/16 2016/17 Revenue 2017/18 2018/19 2019/20 Expenditures Amounts include transfers from SAVE Fund to Debt Service Levy for payment of SAVE Fund debt obligations.
Enterprise [Nutrition] Fund (61 & 68) Thousands 2015/16 2016/17 2017/18 2018/19 2019/20 $1 400 $1 200 $1 000 $800 $1 194 $938 $901 $973 $1 259 $951 $747 $491 $532 $483 $350 $280 $200 Total Assets $1 121 $791 $600 $400 $1 297 Fund Balance w/o Pension Amounts shown includes long term assets (equipment) & inventory on hand
Millions Enterprise [Nutrition] Fund Revenue & Expenditure Summary $3, 0 $2, 8 $2, 6 $2, 4 $2, 2 $2, 0 $1, 8 $1, 6 $1, 4 $1, 2 $1, 0 $2, 79 $2, 56 $2, 50 $2, 42 $2, 46 $2, 54 $2, 42 $2, 49 $2, 38 $2, 17 2015/16 2016/17 Revenue 2017/18 Expenditures 2018/19 2019/20
Private Purpose Trust Fund (81) $18 100 $17 600 $17 100 $16 600 $16 100 $15 600 2015/16 2016/17 Total Assets 2017/18 Fund Balance 2018/19 2019/20
Millions Agency Funds (92/93/94) $1, 8 $1, 6 $1, 4 $1, 2 $1, 0 $0, 8 $0, 6 $0, 4 $0, 2 $0, 0 2015/16 2016/17 Total Assets 2017/18 2018/19 Fund Balance Agency funds are held in a custodial capacity only, thus no fund balance. River Hills Consortium tuition receivables account for the majority of total assets. 2019/20
Acknowledgements �Special thank you to Jana Speck, Carrie De. Berg, Allison Ketter and the entire business office staff for all their time and effort in preparing the Certified Annual Report and Special Education Supplement.