CE 3372 Water Systems Design Module 007 Pumps


")


 Discharge (gpm)")


 discharge")


 storage capacity to accommodate")

 dimension design • Height • Inflow pipe elevation • Ground elevation •")


 Runoff enters the collection system and is conveyed to")
 The inflow rate will vary as defined by the")
 At preset elevations, as the water level drops, individual")


 with")

 on suction side")
 to")


 One (of many possible) Operating conditions Q= 9000 gpm, TDH=67 ft Total")


 (350, 27) (450, 25) (350, 19)")
 (350, 27) (450, 25) (350, 19)")
 (350, 27) (450, 25) (350, 19)")
 (350, 27) (450, 25) (350, 19)")

- Slides: 75
CE 3372 Water Systems Design Module 007 – Pumps and Lift Stations
Pumps • Used to “lift” water from a low elevation to a higher elevation. • Used to “boost” pressures and/or maintain velocities in a system
Pumps • Two principal types of pumps – Positive Displacement – Centrifugal (Rotating machinery)
Positive Displacement Pumps • Produce lower flow rates than centrifugal-type pumps. • Can produce much higher heads than centrifugal pumps. – Positive displacement pumps are comparatively rare in civil engineering applications, but not entirely absent. – Positive displacement pumps come in two varieties, reciprocating pumps and rotary pumps.
Positive Displacement Pumps • Piston Pump – A piston pump is an example of a reciprocating type pump. • The piston moves up and down and the check valves prevent back flow. • On the upstroke (as depicted) the chamber fills with liquid, and on the downstroke the liquid is pushed out the chamber. • The bore diameter, stroke length, and stroke rate are the principal determinants of the operating character of a piston pump. • If no flow can occur (i. e. if the discharge is blocked) the piston pump can and will quickly destroy itself.
Positive Displacement Pumps • Screw Pump – A screw pump is an example of a rotating type pump. • The auger flights catch a portion of the water and lift it as the pump screw rotates in the trough. • Alternatively the augers can be built inside a tube and the tube serves as the trough. . • The flight pitch, flight diameter, fill depth, pump angle and angular rotation speed are the principal determinants of pump characteristics. • Screw pumps are commonly used in wastewater lifting and hurricane barrier lifting. • This type of pump is very tolerant of debris in the liquid, and can move large volumes with reasonable energy input. • However, when these pumps fail, they do so quite spectacularly!
Positive Displacement Pumps – Array of Screw pumps that used to lift wastewater into the Sims South WWTP in Houston Texas. – At full permitted capacity they could lift about 120 MGD. – The original design had an un-filled bay for a fifth pump, but it was never put into service. – Eventually the pumps were removed and replaced by 6 -20 MGD centrifugal pumps.
Positive Displacement Pumps – Screw pump operation curve Fill Depth (feet) Discharge (gpm)
Centrifugal Pumps • Accelerate water using an impeller that adds velocity head proportional to the angular velocity of the impeller and the impeller diameter. Discharge Suct ion ( Eye)
Centrifugal Pumps • Typical vendor supplied pump curve Operation Curve for Particular Impeller Added Head NPSH required Discharge
Axial Flow Pumps • Axial flow pumps have impellers whose axis of rotation is collinear with the discharge (at least close). • Used in high flow, low head applications. discharge suction
Axial Flow Pumps • East Lab Axial Flow Pump (give idea of size) discharge suction
Axial Flow Pumps • Typical Operation Curve Added Head Discharge
Pump Curve Determination • Typical Experimental Apparatus
Pump Curve Determination • The actual characteristics of real pumps are determined experimentally — usually results are supplied by the pump vendor. – The pump is in the right-most pit in the apparatus, discharge is measured at a weir. – The discharge is throttled to produce the load to generate a pump curve, and the suction side water depth is maintained by recirculation. • Generally the pumps are tested to cavitation to determine the NPSH required for each discharge.
Pump Curve Determination • The results of such tests are reported on charts that as a minimum should supply: – Added head versus discharge. – Wire-to-water efficiency versus discharge. – Mechanical power versus discharge. – Net Positive Suction Head required versus discharge.
Suction Requirements • The most common cause of pumping failure is poor suction conditions. • A centrifugal pump cannot lift water unless it is primed, or the first stage impellers are located below the static hydraulic grade line in the suction pit at pump start-up. • Liquid must enter the pump eye under pressure; this pressure is called the Net Positive Suction Head available (NPSHa).
Suction Requirements • The manufacturer supplies a value for the minimum pressure the pump needs to operate. • This pressure is the Net Positive Suction Head required (NPSHr). • For a system to work: NPSHa> NPSHr over all operating conditions, including startup and shut-down.
Suction Requirements • Available suction is computed from Frictional head loss in inlet piping Absolute pressure at liquid surface in suction pit Static elevation of the liquid above the pump inlet eye Absolute vapor pressure at liquid pumping temperature
Suction Requirements • Illustrative Example
Suction Requirements • Illustrative Example
Suction Requirements • Illustrative Example
Suction Requirements • Illustrative Example
Suction Requirements • Illustrative Example
System Curves • A system curve is a plot of required head versus flow rate in a hydraulic system. – The curve depicts how much energy is necessary to maintain a steady flow under the supplied conditions. – The exercises involving energy equation and added pump head, if results are expressed in terms of discharge Q are system curves.
System Curves • Consider the following hydraulic system. – Apply the energy equation and incorporate various friction components. – Result is a system curve.
System Curves • This relationship tells us that the added head has to be at least 30 meters just the keep the reservoirs at the two levels shown, if any flow is to occur the pump must supply at least 30+meters of head.
System Curves • If the curve is plotted with discharge in the horizontal axis, something like the sketch below results.
System Curves • The system curve is used to select an appropriate pump or set of pumps. Consider the sketch below – Pump A cannot meet the needs of the system at any flow rate while Pump B supplies enough head over part of the system curve. – The shaded area between the Pump B curve and the system curve is the area where the pump supplies excess head.
System Curves • Generally a designer would be prudent to have a throttle valve in line with the pump that can be used to match performance (throttling the pump moves the system curve up) – throttling wastes energy, but nevertheless is suggested. – The throttle valve also serves as an isolation valve if the pump station needs to be removed from the network for some reason. • The sketch is the kind of pump system suggested by the pumpsystem curve overlay. • While certainly a common configuration, the designer has considerable flexibility if they choose multiple pumps and use valves and/or variable frequency drives (an electronic component that lets the pumps run at different speeds).
System Curves • Series and parallel combinations can be used to adjust “pump curves” to fit system requirements. Parallel pumps add flow for given head Series pumps add head for given flow
Pumps in EPA-NET • Pumps are modeled as links between two nodes that have pumping curve properties. • Each node must have appropriate elevations. – A pump is added as a link, then the pump curve is specified for that pump. – The program will operate the pump out-of-range but issue warnings to guide the analyst to errors.
Pumps in EPA-NET • Example: – Simulate the single pipeline system depicted below. – Can the yellow pump curve provide the necessary added head? – How about the red pump curve?
Lift Stations • To lift wastewater or stormwater to higher elevation when discharge of local collection system lies below regional conveyance. • To lift wastewater or stormwater to higher elevation when terrain or man-made obstacles do not permit gravity flow to discharge point.
Pond and pump station
Types • Submersible – Lower initial cost – Lower capacity – Smaller footprint • Wet-well / dry-well – Higher initial cost – Easier inspection/ maintenance
Submersible lift station
Wet-well / dry-well lift station
Design criteria • Size the pumps and the wet-well (sump) storage capacity to accommodate inflow variability and detention time limits. • Match the pumps to the flow and head requirements. • Provide ‘near-absolute’ reliability – – Automated controls Redundant systems Alarms Regularly scheduled, preventive maintenance • Assess and mitigate environmental factors – Flood risk, noise pollution, visibility
Site plan and facilities • Protected and accessible during a major flood • Redundant power supplies • Intruder-resistant with controlled access
Wet-well (sump) dimension design • Height • Inflow pipe elevation • Ground elevation • Excavation costs • Cross section • Constant • Variable
Pump capacity • Greater than average flow • Less than the maximum flow • Depends mainly upon – Inflow variability – Marginal costs of increasing sump volume
Introduction to FHWA-HDS-01 -007 • Detailed “how-to” • Reviews hydrology • Reviews hydraulics
Pump System Hydraulic Operation 1) Runoff enters the collection system and is conveyed to the storage unit and wet well of the pump station. For a period of time there is no outflow as the runoff is stored within the storage unit and wet well. 2) The water level in the wet well rises and a hydraulic gradient develops based on the rate of inflow, the water level in the wet well, and the conveyance capacity of the storage unit and collection system. 3) The first pump starts when the water level in the wet well reaches a specific elevation. The pump evacuates the flow at a rate that varies with the pump characteristics and total dynamic head.
Pump System Hydraulic Operation 4) The inflow rate will vary as defined by the inflow hydrograph. If the pumping rate is lower than the inflow rate, the water level in the storage unit and wet well continues to rise and the volume stored in the system increases. 5) Additional pumps start at predetermined elevations as the water level rises. 6) At some point, the inflow rate will be lower than the total pumping rate. The water level in the wet well drops as water is evacuated from storage.
Pump System Hydraulic Operation 7) At preset elevations, as the water level drops, individual pumps are stopped and the discharge rate drops accordingly. 8) When the water level drops to the minimum level required for submergence, the last pump is stopped. The last pump off is usually the first to have been switched on, although different switching schemes are feasible.
Lift Station Design Process • Design criteria include: – – – – Design frequency Peak outflow Station type Design philosophy Minimum storage volume Maximum allowable highwater Discharge velocity • Criteria must be established before design of storage and pump system (FHWA-HDS-01 -007 pg 4 -9)
Lift Station Design Process • Hydrologic Analysis: – – Drainage boundary and area Runoff characteristics Design runoff hydrographs Cumulative inflow
Lift Station Design Process • Trial Pumping Configuration: – The design is typically iterative – Minimum of two pumps recommended
Lift Station Design Process • Hydrologic/Hydraulic Analysis/Estimates – – – Inflow hydrograph Inflow mass curve Stage-storage relationship Trial pump/switching scheme Mass curve routing System head curves • Pump selection/operation
Hydrographs – review • A hydrograph is a graphical representation of discharge (volume/time) with time • The area under the hydrograph curve represents the total volume of runoff during the time represented • The highest point on the graph is the peak discharge
Hydrographs – review
Storage • Storage is collection system, plus any sump (wet well) on suction side of lift station.
Time distributed discharge • Route inflow hydrograph through lift station (and collection system) to generate the time distributed discharge.
Basic assumptions • Pump station hydrologic design is conceptually identical to reservoir routing design Inflow-outflow=change in storage • Inflow is the hydrograph produced by the storm sewer system • Outflow is derived from the sump geometry (stage/storage) and Pump Performance Curves for the pump or pumps in the station
System Sketch Lift Station Collection System
System Sketch
Inflow/outflow relations • A Pump Performance Curve is a graph or equation that represents the “performance envelope” of a pump of a particular design • One axis usually represents energy, or “head” that the pump is working against • The other axis usually represents discharge; the rate of water moved (volume/time) against a given head
Inflow/outflow relations • For each value of head, there will be only one discharge, but the converse may not be true- there may be two different heads that produce the same discharge (due to differences in efficiency over the operating range of the pump)
Inflow/outflow relations • There are three basic types of rotary pumps we are concerned with. They are classified by how they move the water; • Axial flow pumps- push water without changing it’s direction of flow. A boat or airplane propeller is an open axial flow pump • Radial flow pumps- take in water parallel to the axis of rotation of the impeller, then “spin it off”, changing it’s direction of movement at a right angle • Mixed flow pumps- elements of both types of motion; changes direction of flow from parallel to the axis of rotation, but less than a right angle
Inflow/outflow relations • Axial flow pumps are good for moving large amounts of water against low head values At higher head values, the impeller will “cavitate”. • Radial flow pumps are good for moving much smaller quantities of water against much higher head values. • Mixed flow pumps are a flexible compromise- they can be designed to optimize performance against known head values through a broad range.
Pump Curve(s) One (of many possible) Operating conditions Q= 9000 gpm, TDH=67 ft Total dynamic head Wire-to-water efficiency Discharge
System Sketch
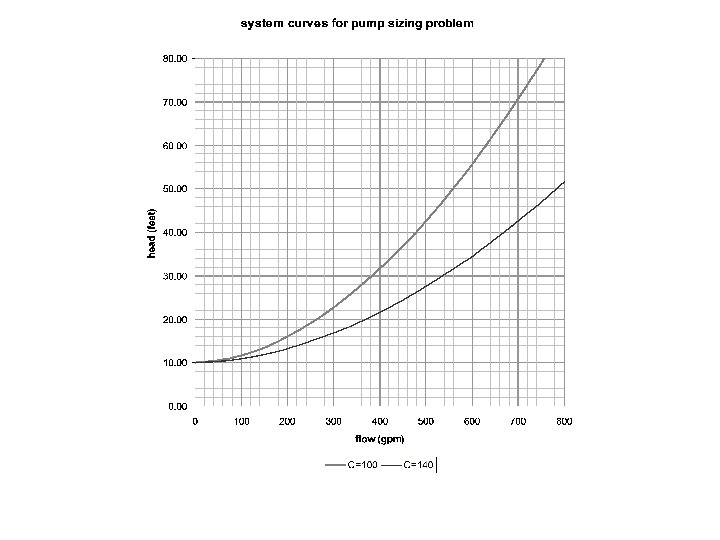
System curve: head loss vs flow
Inflow/outflow relations • For design purposes, the performance curves of pumps selected serve the same purpose as the stage/discharge curve for detention design; • Given: Initially dry sump, inflow hydrograph, sump storage curve, pump performance curves. • Inflow rate*time step= inflow volume • Volume-> depth in sump -> head on pump • Head on pump ->point on performance curve -> outflow rate • Outflow rate*time step= outflow volume • Inflow volume-outflow volume=volume in sump at next time step->
Pump selection important points – Operating point is where pump h vs. Q curve crosses the system h vs. Q curve. – Net pump suction head (NPSH) available > NPSH required. – Parallel pumps add flows, but operate at same head. – Check pump operating conditions for allowable cycle times. – For submerged pumps, check allowable operating time when unsubmerged. – Check suction pipe velocity – should be below 5 fps.
Pump notes: • Pumps should be self-priming for suction lift service. • Suction piping arrangements for multiple pumps must be designed to prevent hydraulic interference. • Submerged pumps are often allowed up to 20 or 25 BHP. • Variable speed pumps can simplify design process, but may dramatically increase installation costs • Using smallest impeller allows later increase in pump capacity • Motor can be changed (higher speed) to increase pump capacity, but this is a more expensive option.
Example pump selection problem • Proposed configuration: 10 pumps in parallel • Each pump required to lift 350 - 450 gpm @ 10 ft static lift
Choosing the pump First pick out the points above the design flow rate (450, 37) (350, 27) (450, 25) (350, 19)
(450, 37) (350, 27) (450, 25) (350, 19)
(450, 37) (350, 27) (450, 25) (350, 19)
(450, 37) (350, 27) (450, 25) (350, 19)
(450, 37) (350, 27) (450, 25) (350, 19)
C 100 system curve C 140 system curve