CDSD Carbon Dioxide Spectroscopic Databank Updated and Enlarged
: Updated and Enlarged Version for Atmospheric Applications Sergei Tashkun")
CDSD (Carbon Dioxide Spectroscopic Databank): Updated and Enlarged Version for Atmospheric Applications Sergei Tashkun and Valery Perevalov Laboratory of Theoretical Spectroscopy, Institute of Atmospheric Optics, 1, av. Akademicheskii, 634055 Tomsk, RUSSIA
 •")
History of CDSD • 1992 Phenomenological effective Hamiltonian model, JMS, 156, 48 (1992) • 1995 Phenomenological effective dipole moment model, JMS, 171, 48 • 1998 -1999 Global fittings of 12 C 16 O 2 observed positions and intensities, JQSRT 60, 785 (1998) JQSRT 62, 571 (1999) • 2003 CDSD-1000, the high-temperature carbon dioxide spectroscopic databank, JQSRT, 82, 165 (2003) • 2004 CDSD-1000 and CDSD-296 were opened for the Internet access: ftp. iao. ru /pub/CDSD-1000 and /pub/CDSD 296 • 2008 updated and new versions CDSD-296, CDSD-1000 and CDSD-Venus ftp. iao. ru /pub/CDSD-2008/

Motivation Ø During last five years a lot of high quality measured CO 2 data appeared (Campargue and co-workers, Toth and co-workers) Ø It is just time to refit all observed data available from the literature and to obtain more accurate models of effective Hamiltonians and effective dipole moment Ø and to create updated and enlarged versions of CDSD (Carbon Dioxide Spectroscopic Databank) for atmospheric and high temperature applications
 RITZ code: check assignment and")
How CDSD is created Observed data (positions and intensities) RITZ code: check assignment and recalibrate positions Effective Hamiltonian model positions intensities GIP code: line by line fitting of effective operator parameters to the observed data Effective dipole moment model CDSD code: create bank using Tref and Intensity cutoff computer code Line broadening model (HITRAN) CDSD datafile theoretical model

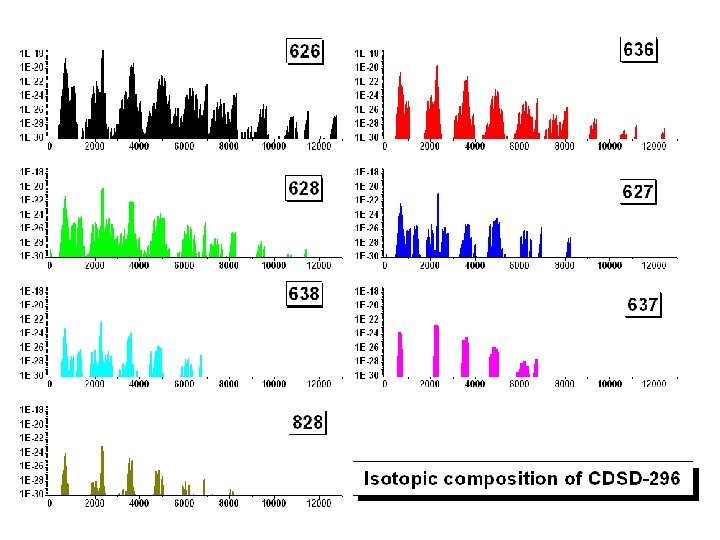
CDSD-296: ftp. iao. ru /pub/CDSD-2008 version 2003 2008 bank format HITRAN-1996 HITRAN-2004 isotopes 4 7 Tref (K) 296 Intensity cutoff (cm/molec) 10 -27 10 -30 range (cm-1) 436 – 8 310 5 – 12 784 lines 66717 419 610

Graphical overview of CDSD-296

Overview of existing CO 2 databanks aimed at atmospheric applications, Tref = 296 K databank HITRAN-2004 bank format HITRAN-2004 isotopes 8 9 7 Intensity cutoff (cm/molec) 10 -27* 10 -30 range (cm-1) 0 – 12 784 4300 - 6989 5 – 12 784 lines 62 913 28 530 419 610 source TOTH-2008 CDSD-2008 HITRAN-2004 www. hitran. com JQSRT 109, 906 (2008), supplementary material ftp. iao. ru *) microwave transitions of 628 and 627 have intensities as low as 10 -35

CDSD vs HITRAN: band by band comparison for Intensity cutoff 10 -27 cm/molecule position = intensity = 12 C 16 O 2

CDSD vs HITRAN: band by band comparison for 12 C 16 O 2 zoom Usage of spectroscopic constants for extrapolation of rotational line positions of a band is dangerous

CDSD vs HITRAN: band by band comparison for 12 C 16 O zoom 2

CDSD vs HITRAN: the 23301 -02201 band Number of lines 152 HITRAN intensities from: D. Chris Benner, College of William and Mary, private communication (2003). ‘ … as to the 23301 <- 02201 band, again we measured only 16 lines (from P 39 to R 31) and the interaction between 23301 and 12212 is not well constrained at high Js. Our residuals for the line positions in these bands were all less than 0. 001 cm-1…’ D. C. Benner, private communication (2005) Usage of spectroscopic constants for extrapolation of line intensities of a band is dangerous

CDSD vs HITRAN and TOTH: band by band comparison for 12 C 16 O 2
")
Danger of long range extrapolations (cutoff 10 -30 cm/molec)

CDSD vs HITRAN and TOTH: band by band comparison for 12 C 16 O 2

CDSD vs HITRAN: band by band comparison for 12 C 16 O 2

CDSD vs HITRAN: 12000 -12800 cm-1 region A. Campargue et al, Chem. Phys. Lett. , 223, 567 (1994)

Other versions of CDSD • CDSD-1000: version for high-temperature applications. Tref=1000 K, cutoff=10 -27 cm/molec, near 4 million of lines • CDSD-Venus: version to study of Venus atmosphere. Tref=750 K, cutoff=10 -30 cm/molec, near 12 million of lines • All versions of CDSD are accessible via the Internet: ftp. iao. ru folder /pub/CDSD-2008

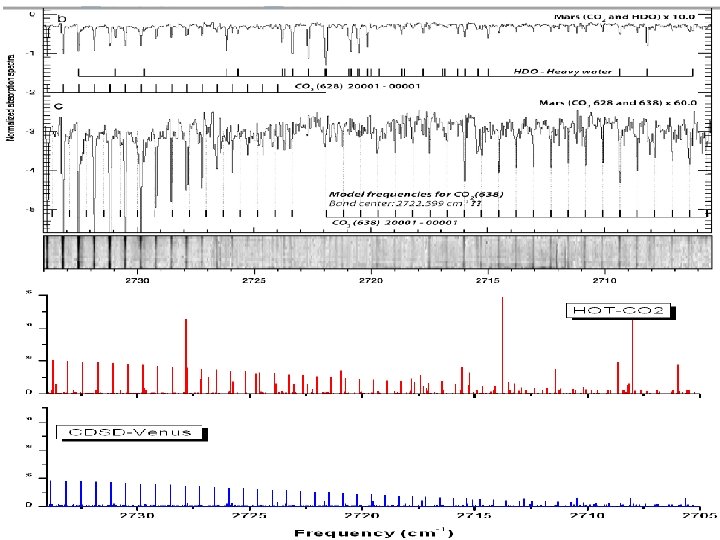
Venus and Mars databank HOT-CO 2 CDSD-Venus Tref 296 K 750 K Imin at T=750 K 8. 54· 10 -32 10 -30 data format HITRAN-1996 HITRAN-2004 isotopes 1, 2, 3, 5 1, 2, 3, 4, 5, 6, 7 range (cm-1) 21 - 12783 14 - 12784 lines 7 088 178 11 730 277

Line parameters for the 01111– 00001 band of 12 C 16 O 18 O from SOIR measurements of the Venus atmosphere (V. Wilquet et al, JQSRT 109, 895 (2008)

Simulation
, Fig. 5")
G. L. Villanueva et al, JQSRT 109, 883 (2008), Fig. 5
, Table 2, 20001 -00001 band")
G. L. Villanueva et al, JQSRT 109, 883 (2008), Table 2, 20001 -00001 band of Villaneuva P P P P P P 23 22 21 20 19 18 17 16 15 14 13 12 11 10 9 8 7 6 5 4 3 2705. 639 2706. 351 2707. 085 2707. 841 2708. 572 2709. 320 2710. 055 2710. 800 2711. 528 2712. 276 2713. 019 2713. 756 2714. 501 2715. 244 2715. 982 2716. 732 2717. 469 2718. 179 2718. 958 2719. 690 2720. 404 CDSD-Venus 2705. 618 2706. 356 2707. 095 2707. 834 2708. 573 2709. 312 2710. 052 2710. 792 2711. 532 2712. 273 2713. 013 2713. 755 2714. 496 2715. 238 2715. 981 2716. 724 2717. 467 2718. 211 2718. 955 2719. 699 2720. 444 R R R R R R 4 5 6 7 8 9 10 11 12 13 14 15 16 17 18 19 20 21 22 23 24 HOT-CO 2 2705. 126 2705. 864 2706. 602 2707. 340 2708. 079 2708. 817 2709. 556 2710. 296 2711. 035 2711. 775 2712. 515 2713. 255 2713. 996 2714. 737 2715. 478 2716. 220 2716. 962 2717. 705 2718. 447 2719. 191 16 O 13 C 18 O

Conclusions • 16 O 12 C 17 O and 16 O 13 O 17 O new laboratory measurements are urgently needed • long range J extrapolations based on spectroscopic constants are extremely dangerous • measured data should be given in publications along with calculated data • HITRAN should have a person who will be responsible for support of present and future CO 2 data

Acknowledgements • • • D. Bailly A. Barbe D. C. Benner L. R. Brown A. D. Bykov A. Campargue C. Claveau V. Dana M. R. De. Backer-Barilly M. P. Esplin M. Fukabori L. P. Giver • • • S. -M. Hu J. -Y. Mandin C. Miller N. N. Lavrent’eva B. V. Perevalov L. S. Rothman J. -L. Teffo R. A. Toth A. Valentin J. Vander Auwera L. Wang R. B. Wattson
- Slides: 26