
CCSDUNLV Research Consortium on ELL Demographics Principal Perspectives


- Slides: 36
CCSD‐UNLV Research Consortium on ELL: Demographics, Principal Perspectives, and Student Performance Data Professor Sylvia Lazos Professor Le. Ann G Putney Professor Ralph E. Reynolds
Demographic Data
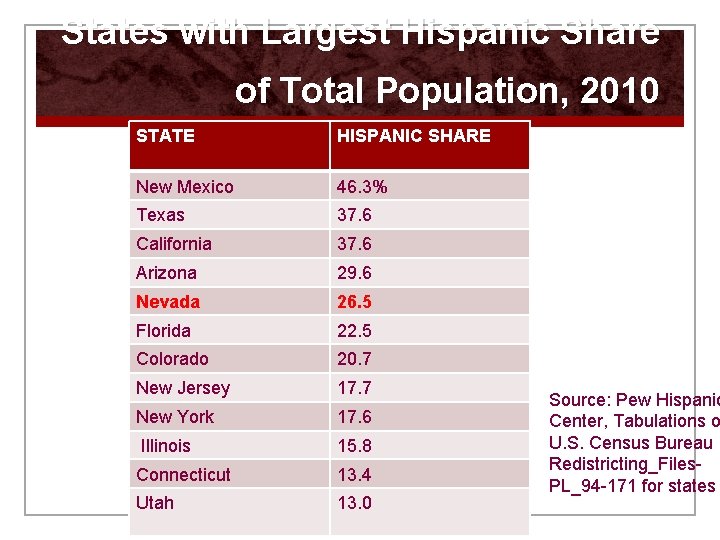
States with Largest Hispanic Share of Total Population, 2010 STATE HISPANIC SHARE New Mexico 46. 3% Texas 37. 6 California 37. 6 Arizona 29. 6 Nevada 26. 5 Florida 22. 5 Colorado 20. 7 New Jersey 17. 7 New York 17. 6 Illinois 15. 8 Connecticut 13. 4 Utah 13. 0 Source: Pew Hispanic Center, Tabulations o U. S. Census Bureau Redistricting_Files. PL_94 -171 for states
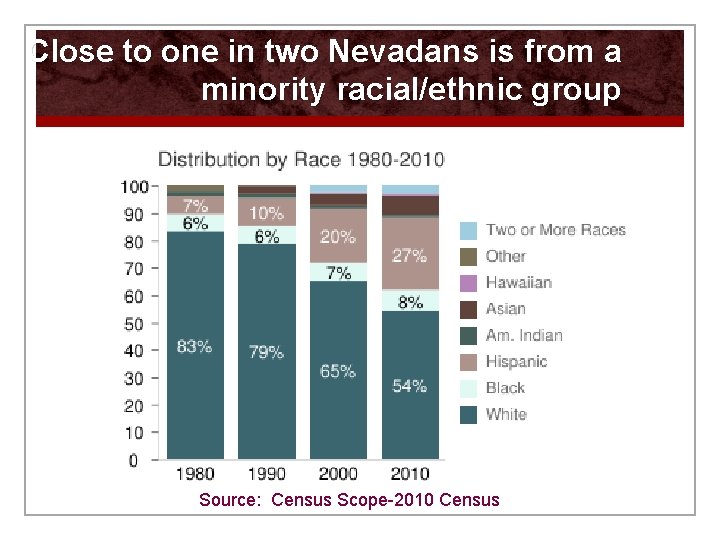
Close to one in two Nevadans is from a minority racial/ethnic group Source: Census Scope-2010 Census
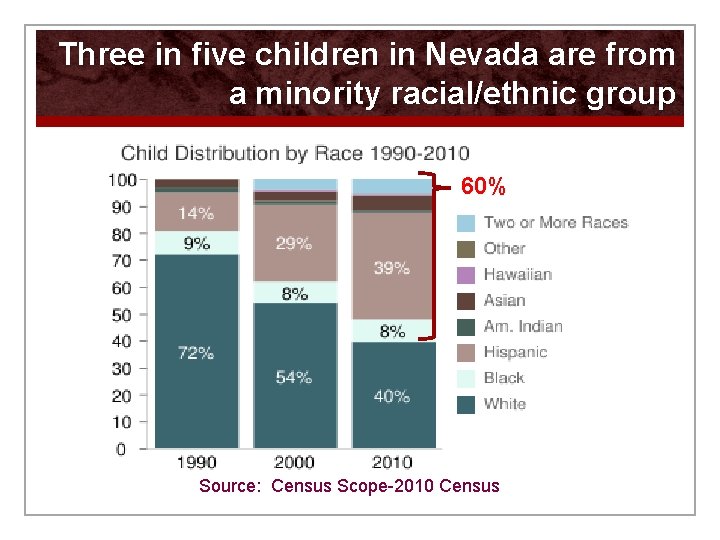
Three in five children in Nevada are from a minority racial/ethnic group 60% Source: Census Scope-2010 Census
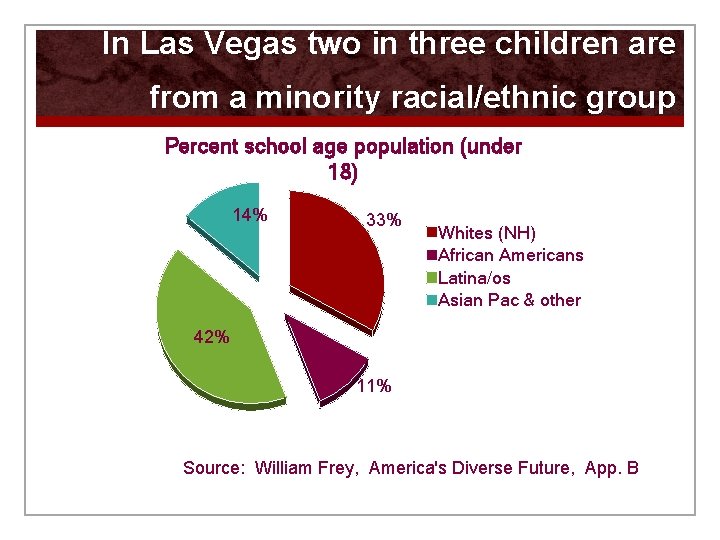
In Las Vegas two in three children are from a minority racial/ethnic group Percent school age population (under 18) 14% 33% Whites (NH) African Americans Latina/os Asian Pac & other 42% 11% Source: William Frey, America's Diverse Future, App. B
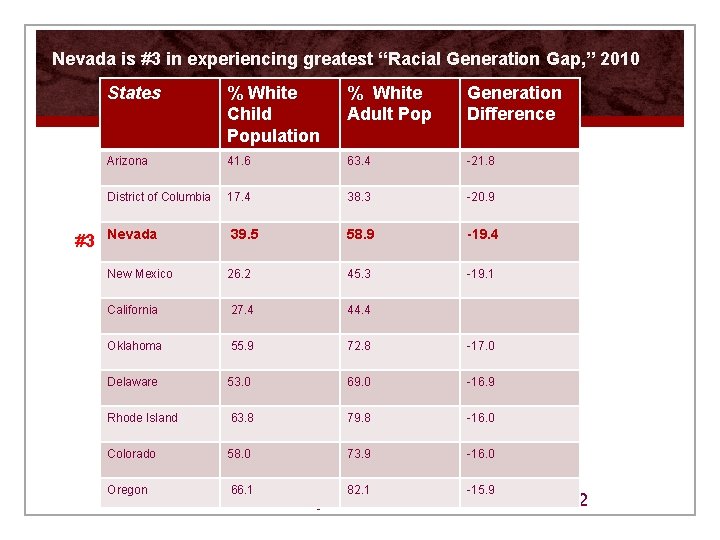
Nevada is #3 in experiencing greatest “Racial Generation Gap, ” 2010 #3 States % White Child Population % White Adult Pop Generation Difference Arizona 41. 6 63. 4 -21. 8 District of Columbia 17. 4 38. 3 -20. 9 58. 9 -19. 4 -19. 1 Nevada 39. 5 New Mexico 26. 2 45. 3 California 27. 4 44. 4 Oklahoma 55. 9 72. 8 -17. 0 Delaware 53. 0 69. 0 -16. 9 Rhode Island 63. 8 79. 8 -16. 0 Colorado 58. 0 73. 9 -16. 0 66. 1 82. 1 -15. 9 Oregon Source: William Frey, America's Diverse Future, T. 2
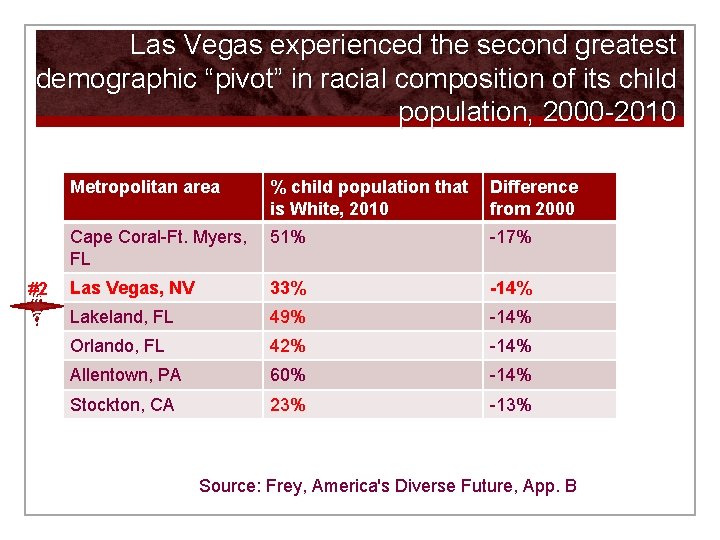
Las Vegas experienced the second greatest demographic “pivot” in racial composition of its child population, 2000 -2010 #2 # @ Metropolitan area % child population that is White, 2010 Difference from 2000 Cape Coral-Ft. Myers, FL 51% -17% Las Vegas, NV 33% -14% Lakeland, FL 49% -14% Orlando, FL 42% -14% Allentown, PA 60% -14% Stockton, CA 23% -13% Source: Frey, America's Diverse Future, App. B
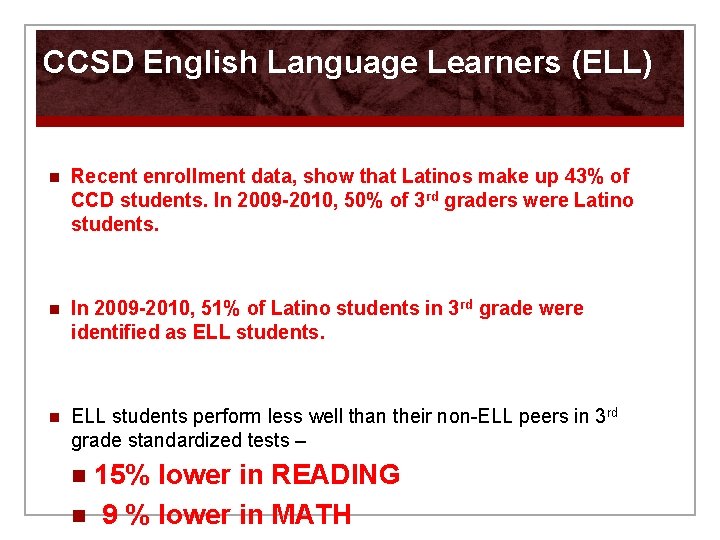
CCSD English Language Learners (ELL) n Recent enrollment data, show that Latinos make up 43% of CCD students. In 2009 -2010, 50% of 3 rd graders were Latino students. n In 2009 -2010, 51% of Latino students in 3 rd grade were identified as ELL students. n ELL students perform less well than their non-ELL peers in 3 rd grade standardized tests – 15% lower in READING n 9 % lower in MATH n
Qualitative Results
Instructional Leadership – Teachers and Principals n Mindset – Meeting the needs of all kids, individually, and regardless of ELL status n Goals – Using best instructional practice n Instructional practice – Additional adult interactions with kids (tutoring) for optimal language use/ “…children will be successful if they stay with us. ”
Professional Development n TESL Endorsement n HQSI n ELL Specialists “So you can call it high quality, but basically its just good teaching strategies and instruction that we need to be developing and using in all of our programs. ”
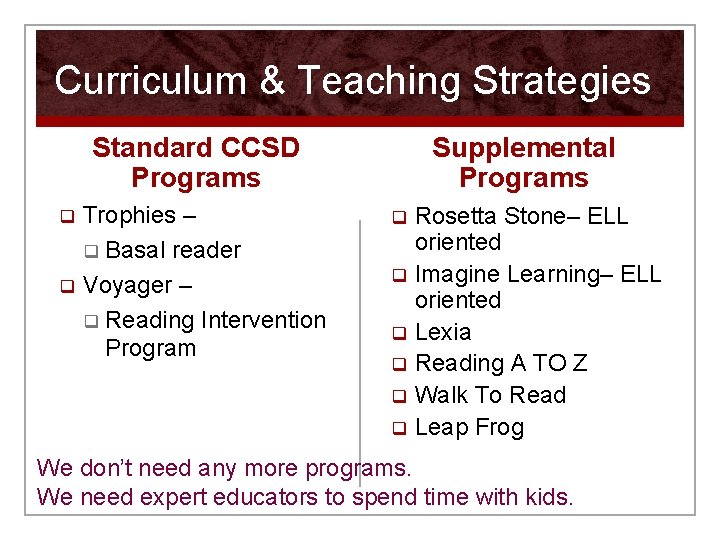
Curriculum & Teaching Strategies Supplemental Programs Standard CCSD Programs Trophies – q Basal reader q Voyager – q Reading Intervention Program q Rosetta Stone– ELL oriented q Imagine Learning– ELL oriented q Lexia q Reading A TO Z q Walk To Read q Leap Frog q We don’t need any more programs. We need expert educators to spend time with kids.
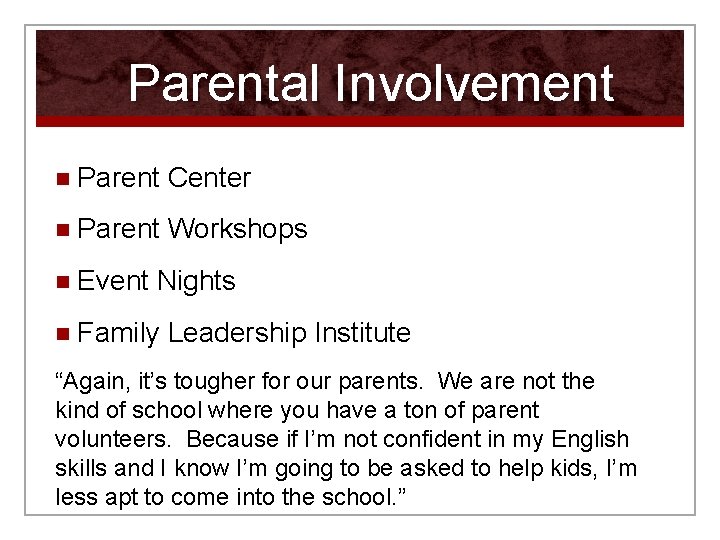
Parental Involvement n Parent Center n Parent Workshops n Event Nights n Family Leadership Institute “Again, it’s tougher for our parents. We are not the kind of school where you have a ton of parent volunteers. Because if I’m not confident in my English skills and I know I’m going to be asked to help kids, I’m less apt to come into the school. ”
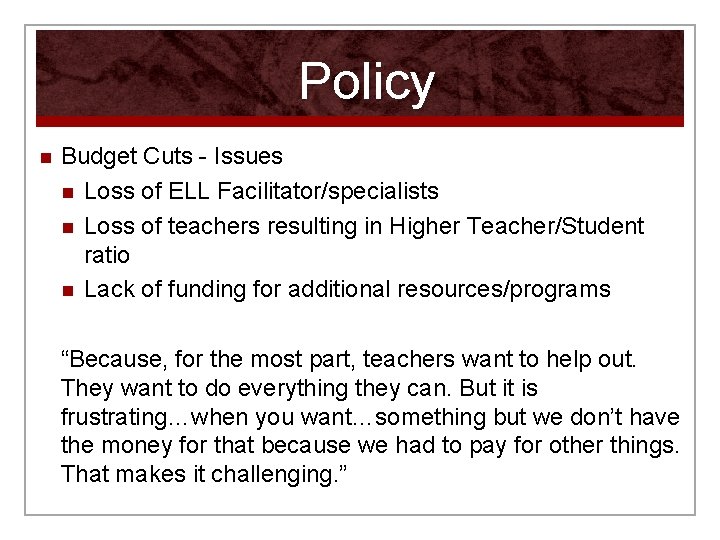
Policy n Budget Cuts - Issues n Loss of ELL Facilitator/specialists n Loss of teachers resulting in Higher Teacher/Student ratio n Lack of funding for additional resources/programs “Because, for the most part, teachers want to help out. They want to do everything they can. But it is frustrating…when you want…something but we don’t have the money for that because we had to pay for other things. That makes it challenging. ”
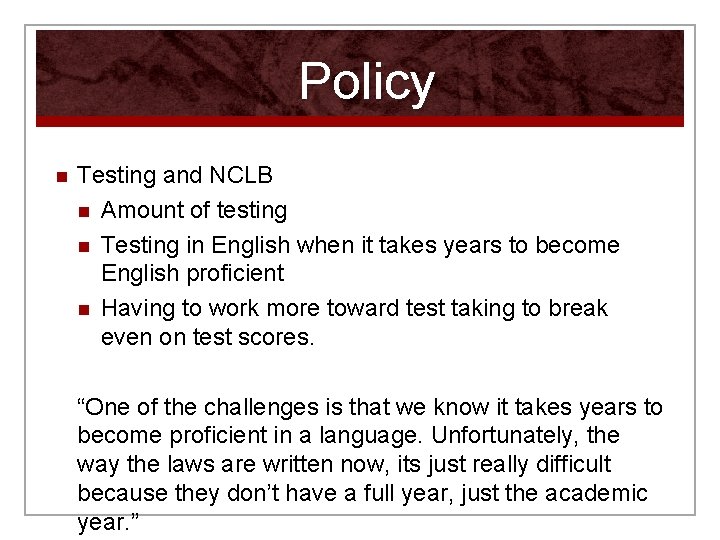
Policy n Testing and NCLB n Amount of testing n Testing in English when it takes years to become English proficient n Having to work more toward test taking to break even on test scores. “One of the challenges is that we know it takes years to become proficient in a language. Unfortunately, the way the laws are written now, its just really difficult because they don’t have a full year, just the academic year. ”
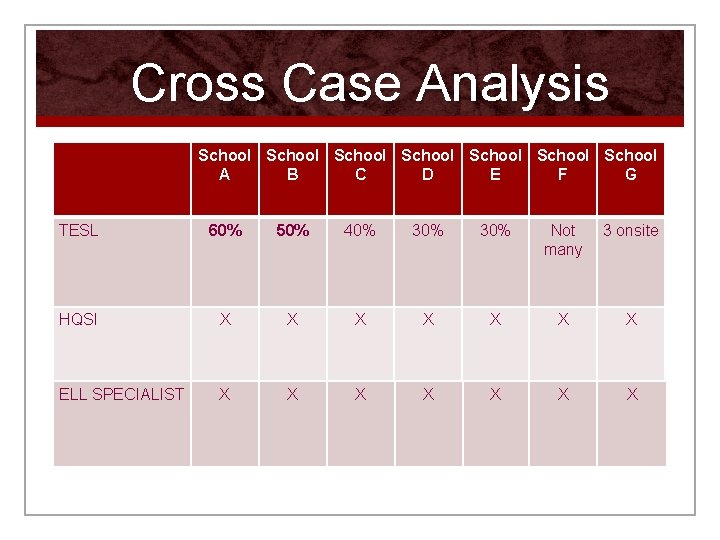
Cross Case Analysis School School A B C D E F G TESL 60% 50% 40% 30% Not many 3 onsite HQSI X X X X ELL SPECIALIST X X X X
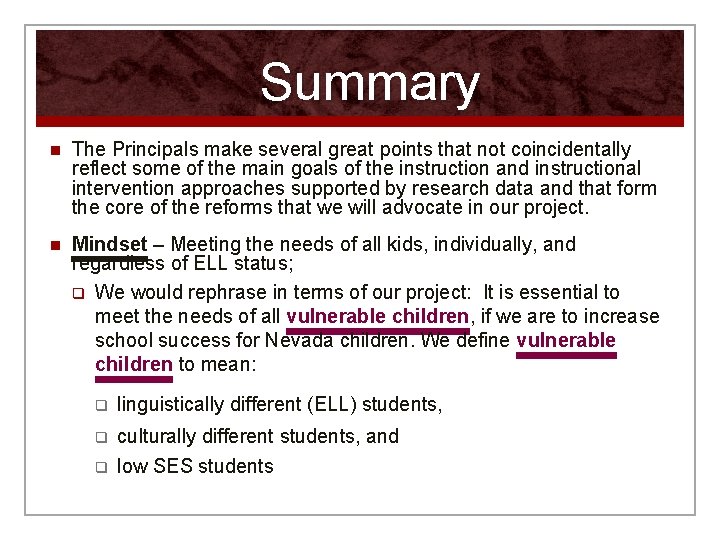
Summary n The Principals make several great points that not coincidentally reflect some of the main goals of the instruction and instructional intervention approaches supported by research data and that form the core of the reforms that we will advocate in our project. n Mindset – Meeting the needs of all kids, individually, and regardless of ELL status; q We would rephrase in terms of our project: It is essential to meet the needs of all vulnerable children, if we are to increase school success for Nevada children. We define vulnerable children to mean: q linguistically different (ELL) students, q culturally different students, and low SES students q
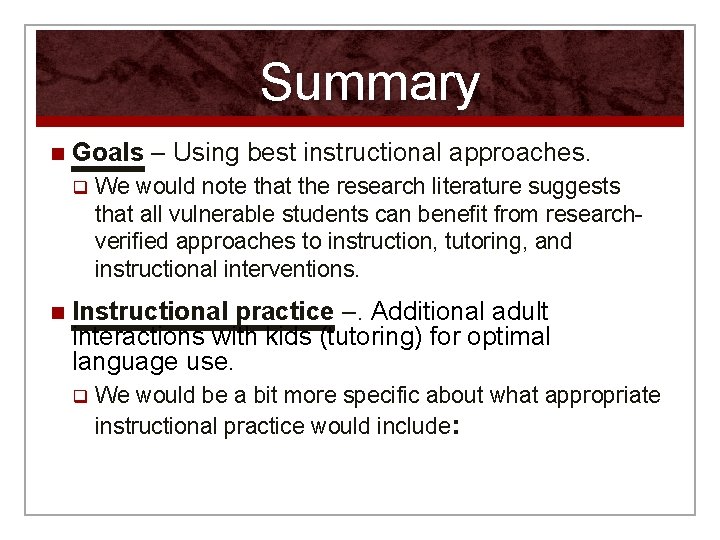
Summary n Goals – Using best instructional approaches. q n We would note that the research literature suggests that all vulnerable students can benefit from researchverified approaches to instruction, tutoring, and instructional interventions. Instructional practice –. Additional adult interactions with kids (tutoring) for optimal language use. q We would be a bit more specific about what appropriate instructional practice would include:
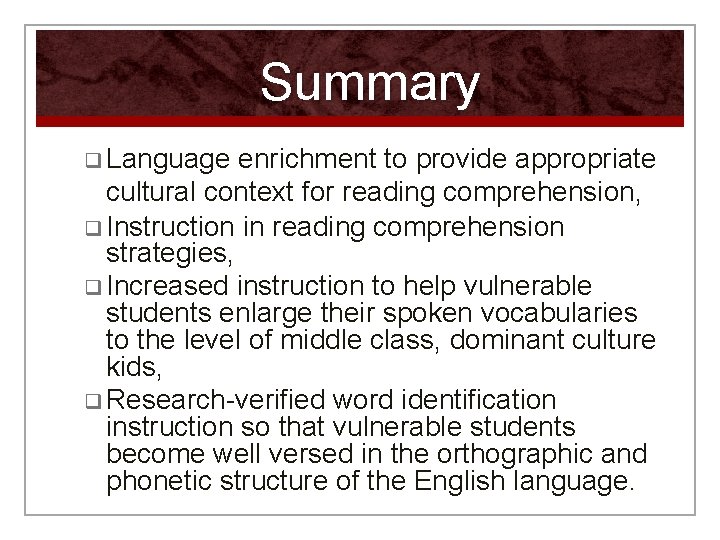
Summary q Language enrichment to provide appropriate cultural context for reading comprehension, q Instruction in reading comprehension strategies, q Increased instruction to help vulnerable students enlarge their spoken vocabularies to the level of middle class, dominant culture kids, q Research-verified word identification instruction so that vulnerable students become well versed in the orthographic and phonetic structure of the English language.
Quantitative Data
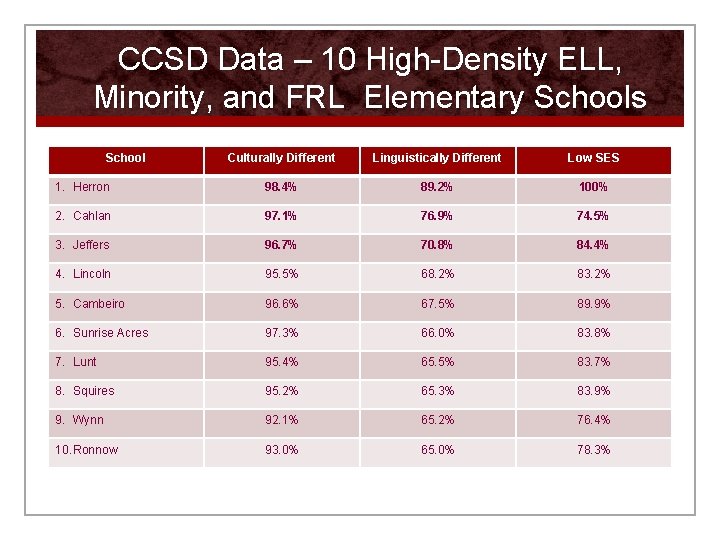
CCSD Data – 10 High-Density ELL, Minority, and FRL Elementary Schools School Culturally Different Linguistically Different Low SES 1. Herron 98. 4% 89. 2% 100% 2. Cahlan 97. 1% 76. 9% 74. 5% 3. Jeffers 96. 7% 70. 8% 84. 4% 4. Lincoln 95. 5% 68. 2% 83. 2% 5. Cambeiro 96. 6% 67. 5% 89. 9% 6. Sunrise Acres 97. 3% 66. 0% 83. 8% 7. Lunt 95. 4% 65. 5% 83. 7% 8. Squires 95. 2% 65. 3% 83. 9% 9. Wynn 92. 1% 65. 2% 76. 4% 10. Ronnow 93. 0% 65. 0% 78. 3%
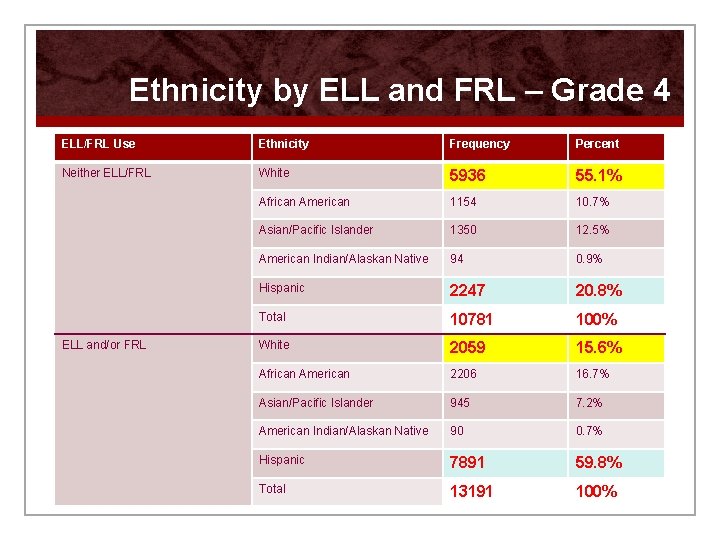
Ethnicity by ELL and FRL – Grade 4 ELL/FRL Use Ethnicity Frequency Percent Neither ELL/FRL White 5936 55. 1% African American 1154 10. 7% Asian/Pacific Islander 1350 12. 5% American Indian/Alaskan Native 94 0. 9% Hispanic 2247 20. 8% Total 10781 100% White 2059 15. 6% African American 2206 16. 7% Asian/Pacific Islander 945 7. 2% American Indian/Alaskan Native 90 0. 7% Hispanic 7891 59. 8% Total 13191 100% ELL and/or FRL
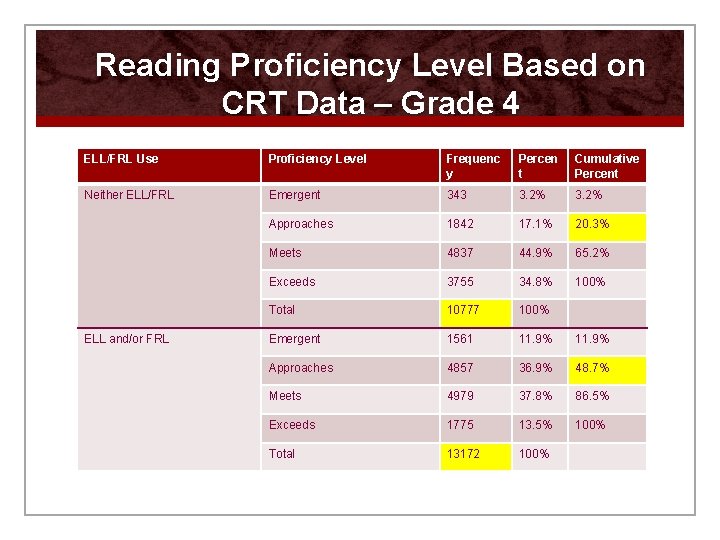
Reading Proficiency Level Based on CRT Data – Grade 4 ELL/FRL Use Proficiency Level Frequenc y Percen t Cumulative Percent Neither ELL/FRL Emergent 343 3. 2% Approaches 1842 17. 1% 20. 3% Meets 4837 44. 9% 65. 2% Exceeds 3755 34. 8% 100% Total 10777 100% Emergent 1561 11. 9% Approaches 4857 36. 9% 48. 7% Meets 4979 37. 8% 86. 5% Exceeds 1775 13. 5% 100% Total 13172 100% ELL and/or FRL
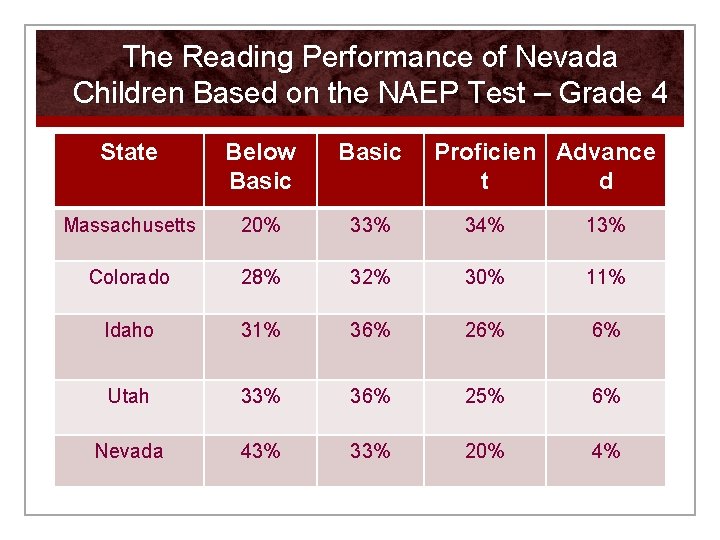
The Reading Performance of Nevada Children Based on the NAEP Test – Grade 4 State Below Basic Proficien Advance t d Massachusetts 20% 33% 34% 13% Colorado 28% 32% 30% 11% Idaho 31% 36% 26% 6% Utah 33% 36% 25% 6% Nevada 43% 33% 20% 4%
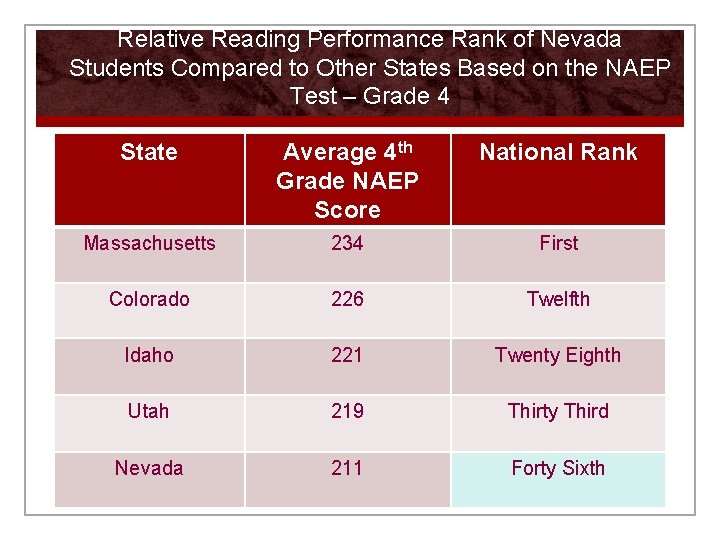
Relative Reading Performance Rank of Nevada Students Compared to Other States Based on the NAEP Test – Grade 4 State Average 4 th Grade NAEP Score National Rank Massachusetts 234 First Colorado 226 Twelfth Idaho 221 Twenty Eighth Utah 219 Thirty Third Nevada 211 Forty Sixth
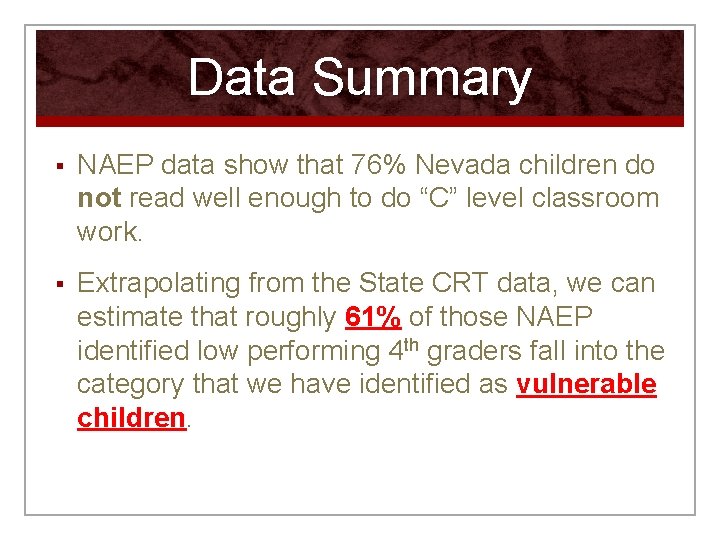
Data Summary § NAEP data show that 76% Nevada children do not read well enough to do “C” level classroom work. § Extrapolating from the State CRT data, we can estimate that roughly 61% of those NAEP identified low performing 4 th graders fall into the category that we have identified as vulnerable children.
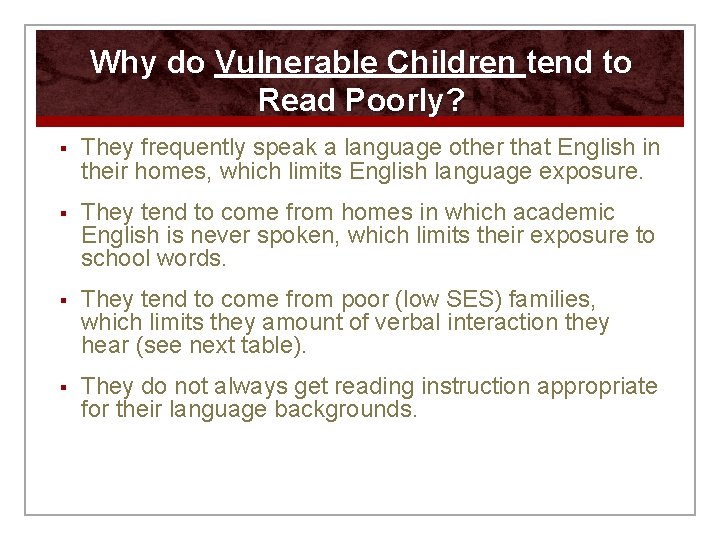
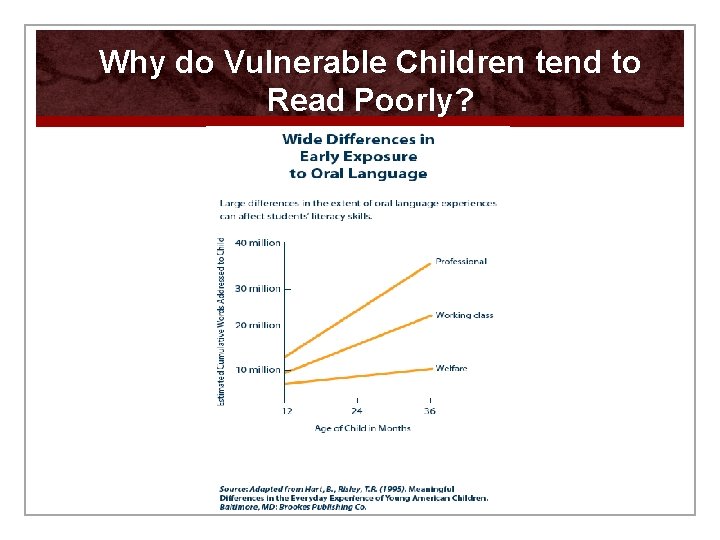
Why do Vulnerable Children tend to Read Poorly? § They frequently speak a language other that English in their homes, which limits English language exposure. § They tend to come from homes in which academic English is never spoken, which limits their exposure to school words. § They tend to come from poor (low SES) families, which limits they amount of verbal interaction they hear (see next table). § They do not always get reading instruction appropriate for their language backgrounds.
Why do Vulnerable Children tend to Read Poorly?
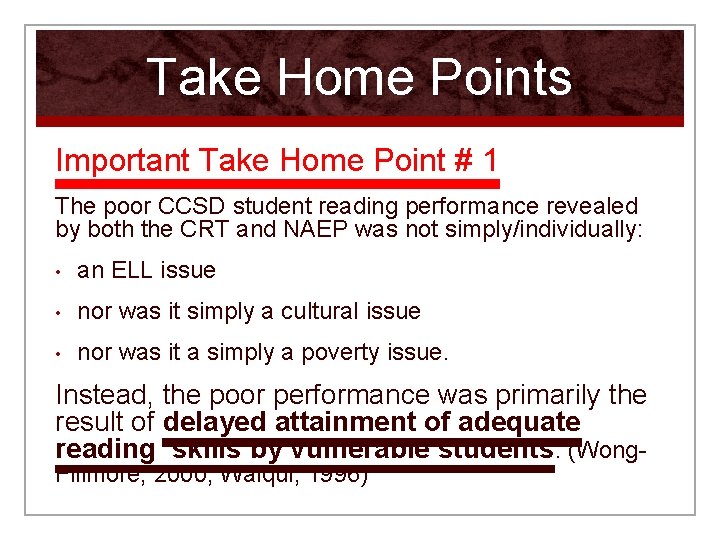
Take Home Points Important Take Home Point # 1 The poor CCSD student reading performance revealed by both the CRT and NAEP was not simply/individually: • an ELL issue • nor was it simply a cultural issue • nor was it a simply a poverty issue. Instead, the poor performance was primarily the result of delayed attainment of adequate reading skills by vulnerable students. (Wong. Fillmore, 2000; Walqui, 1996)
Take Home Points Important Take Home Point # 2 Research has verified that school Principals can have a significant effect on student learning (Hall, 2006). Hence, we must ensure that all CCSD Principals create a school culture that supports vulnerable students, engaging the parents of these students. q One aspect of creating this culture must be recommending to their teachers the best research-verified instructional practices and curricular materials. q
Take Home Points Important Take Home Point # 3 Research has verified that the greatest change agent in any school child’s life is a knowledgeable, responsive teacher. Hence, the focus of future efforts must center on research-validated preparation and professional development for teachers of highly vulnerable students q We must ensure that all CCSD teachers are using the best research-verified instructional practices and the best research-verified curricular materials. q
Current Progress and Future Steps q We are working on three projects that go beyond the Lincy Fellowship: q The CCSD/UNLV Reading Skills Development Center to assist young vulnerable children in acquiring adequate reading Skills before the end of the third grade. o Grand Opening = December 9, 2012. o We will conduct pilot studies in two CCSD elementary in spring, 2012. o We will scale up the project in fall 2012.
Current Progress and Future Steps q We are continuing to collaborate in the CCSD/UNLV ELL Partnership. o We have one project in which we are testing ELL learning software for efficiency and effectiveness. o A second project has been designed to understand document why some schools’ ELL students read so much better than those from other schools.
Current Progress and Future Steps q We have initiated a project to help vulnerable children enroll and succeed in college. o Teaching classes to high school seniors that focus on the skills they will need to succeed in college. § Financial literacy § Study skills § Motivation § Time management § Comprehension and writing skills.
Current Progress and Future Steps o o A continuation of the project will intervene with younger students to help them understand that going to college is a future possibility for them -- eighth graders and 5 th graders. Finally, in order to accomplish any of our goals, we must being to involve parents and communities in all of our future work.