Causal inference in observational studies Farhad Hosseinpanah Obesity

Causal inference in observational studies Farhad Hosseinpanah Obesity Research Center Research Institute for Endocrine sciences Shahid Beheshti University of Medical Sciences September 15, 2018 Tehran


Agenda • Association Vs. Causation • Bias • Confounding • Interaction • Causality criteria

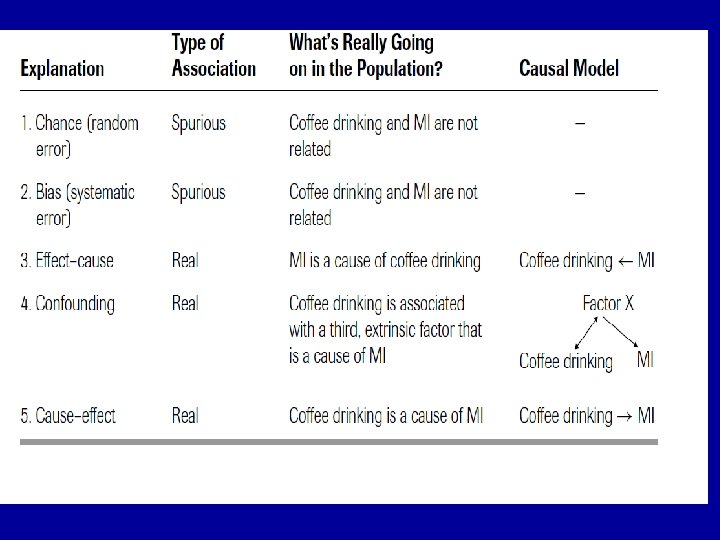
Causation versus Association • causation occurs due to causal relationship between the exposure and the outcome • Association is an expression used to describe findings in • epidemiologic studies. Observance of an association does NOT necessarily mean that there is a true effect nor does it mean that causality exists. Association can be due to: • Chance (random variation) • Bias • Confounding • True effect spurious True
 Type of design • Random error")
The error of research • Systematic error (Bias) Type of design • Random error (play of chance) Sample size

Bias • Any systematic error in the design, conduct or analysis of a study that results in a mistaken estimate of an exposure �s effect on the risk of disease

Bias • Selection • information

Selection Bias Are the groups similar in all important respects? q Selection bias stems from an absence of comparability between groups being studied q In a cohort study, are participants in the exposed and unexposed groups similar in all important respects except for the exposure? q. In a case-control study, are cases and controls similar in all important respects except for the disease in question?
 results from differential rates of hospital admission")
Selection Bias • Berkson bias (or paradox) results from differential rates of hospital admission for cases and control • Hospital based case control • To determine possible association between salpingitis & IUD

Hospital Admission Bias pap smear & cervical cancer Hospitalized cases only Case Control Total Yes No Total 20 45 65 39 26 59 71 Odds Ratio=0. 29 65 130

Hospital Admission Bias pap smear & cervical cancer All incident Cases Case Control Total Yes No Total 40 60 100 60 40 100 100 Odds Ratio=0. 44

Information Bias • Results from systematic differences in the way data on exposure or outcome are obtained from the various study groups

Information bias Has information been gathered in the same way? · Information bias, also known as observation, classification, ascertainment or measurement bias, results from incorrect determination of exposure or outcome, or both. · In a cohort study or randomised controlled trial, information about outcomes should be obtained the same way for those exposed and unexposed. · In a case-control study, information about exposure should be gathered in the same way for cases and controls.

Information bias • Recall bias • Interviewer Bias • Surveillance • Reporting bias • Surrogate interviews • Differential and non-differential misclassification

Recall bias Cases remember exposure differently than controls • Mothers of children with malformations will remember past exposures better than mothers with healthy children • Overestimation of “a” overestimation of OR

Bias • Unlike “chance” and “confounding, ” which can be evaluated quantitatively, the effects of bias are far more difficult to evaluate and may even be impossible to take into account in the analysis. • Bias can produce either a type 1 or a type 2 error, but we usually focus on type 1 errors due to bias.

Confounding variable • An extrinsic factor involved in the association that is the real cause of the outcome. • A variable that is associated with the predictor variable and is a cause of the outcome

Interrelationship • EXPOSURE DISEASE CONFOUNDING FACTOR

Confounding Criteria: – Causally associated with the outcome – Noncausally or causally associated with the exposure – not intermediate in exposure/outcome pathway – Confounding can produce either a type 1 or a type 2 error, but we usually focus on type 1 errors

smoking Coffee drinking Pancreatic CA Real

Overall mortality rates in 1968 for six countries Costa rica 3. 8/1000 Venezuela 4. 4/1000 Mexico 4. 9/1000 Cuba 6. 7/1000 Canada 7. 3/1000 US 8. 7/1000

country Age distribution ? Mortality

Age specific mortality per 1000 Costa rica 3. 7 Venezuela 4. 6 Mexico 5. 0 Cuba 4. 0 Canada 3. 2 U. S 3. 6

Difference between bias and confounding § Bias creates an association that is not true, but confounding describes an association that is true, but potentially misleading.

Examples of confounding • Demographic factors: age, gender, ethnicity • Lifestyle exposures: smoking, diet, alcohol • Personal characteristics: medical history

• Hospital based case control • To determine possible association between MI & Coffee consumption + MI + Coffee - MI 68 44 32 56 100
 • Odds of coffee drinking • for: MI cases")
• Example (cont. ) • Odds of coffee drinking • for: MI cases = 68: 32 = 2. 2125 • for: Controls = 44: 56 = 0. 79 • Odds ratio = 2. 125/0. 79 = 2. 70 • Q: Is this a true causal association?
 • 2. Bias • Selection")
• Evaluating Associations • 1. Chance (Random Error) • 2. Bias • Selection • Information • 3. Confounding • 4. Truth

• Random Chance? • P Value or Confidence Interval • To reduce errors from random chance: • Increase sample size • Improve measurement technique

• Bias? • Selection • Information Subjects Measurement of predictor and outcome variables

• Selection bias: Do subjects accurately represent target population? • Information bias: Do measurements accurately represent phenomena of interest?

• Possible sources of selection bias • Controls are clinic patients who have reduced • coffee intake due to illness (e. g. , peptic ulcer disease patients) Low participation rates • Possible sources of information bias • MI patients overstate coffee use • Esophageal spasm, caused by coffee, is misdiagnosed as MI

• Confounding? ? • Coffee MI • Smoking • A confounder must be associated with both the exposure (coffee) and the outcome (MI)
 and")
• Confounding • A confounder is associated both with the predictor (coffee) and the outcome (MI) • Was the association between coffee and MI simply due to coffee drinkers being more likely to smoke?

• Confounding • Can be addressed in • Design – Specification, matching • Analysis – Stratification, Regression Analysis

Coping with confounders: Specification Design phase Matching Stratification Analysis phase Adjustment Propensity score
 • Matching •")
• Confounding • Specification • (Limit study to non smokers) • Matching • (Pair cases and controls to match on smoking)

• Confounding • Stratification: If you see an association between coffee and MI, but worry it may be due to confounding from smoking. . . • Check to see if the coffee – MI association holds for all levels (or strata) of smoking

+ Coffee - Coffee + MI - MI 68 44 32 56 100 + MI - MI 64 32 16 8 Smokers OR =1 OR=2. 7 100 + MI - MI 4 12 16 48 Non-Smokers OR =1

Interaction • Association between predictor and outcome varies with the level of a third factor

Interaction

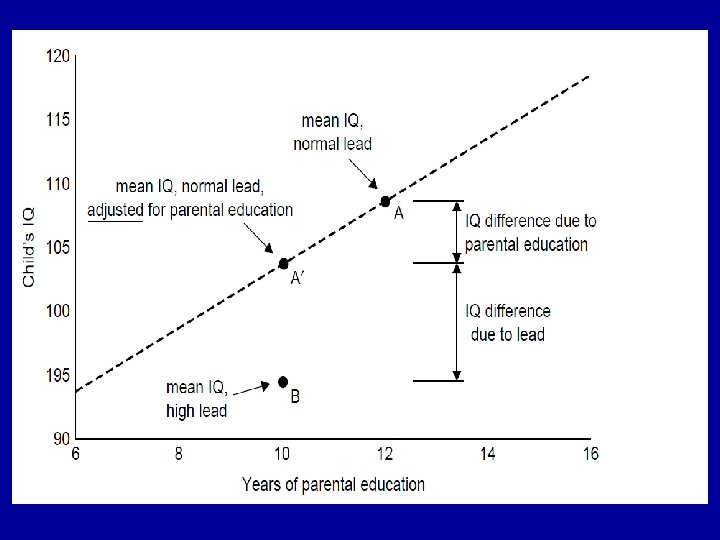
• A Simplified Example of Adjustment

‘‘Is the difference in IQ more than can be accounted for on the basis of the difference in parental education? ’’

Propensity Score • A tool for controlling confounding by indication—the problem that patients for whom a treatment is indicated (and hence prescribed) are often at higher risk or otherwise intrinsically different from those who do not get the treatment
 model")
Propensity Score • use of propensity scores involves creating a multivariate (usually logistic) model to predict receipt of the treatment • Each subject can then be assigned a predicted probability of treatment—a propensity score. • This single score can be used as the only confounding variable in stratified or multivariate analysis; or matching can be done by using propensity score
 prospectively studied 6, 174 consecutive adults undergoing stress")
Example • Gum et al. (10) prospectively studied 6, 174 consecutive adults undergoing stress echocardiography, 2, 310 of whom (37%) were taking aspirin and 276 of whom died in the 3. 1 -year follow-up period. • In unadjusted analyses, aspirin use was not associated with mortality (4. 5% in both groups).

Example…. . • However, when 1, 351 patients who had received aspirin were matched to 1, 351 patients with the same propensity to receive aspirin but who did not, mortality was 47% lower in those treated (P = 0. 002).

Effect cause • Do a longitudinal study • Obtain data on the historic sequence of the variables • Consider biologic plausibility • Consider findings of other studies with different design • Ultimate solution: do a randomized trial

Assessing the relationship between factors in epidemiology:
 Mill suggested that the following aspects of an association be")
Causal Criteria Mill (1862) Mill suggested that the following aspects of an association be considered in attempting to distinguish causal from noncausal associations (1) Strength (6) Plausibility (2) Consistency (7) Coherence (3) Specificity (8) Experimental (4) Temporality (5) Biologic gradient evidence (9) Analogy
 • Temporal relationship")
Nine guidelines for judging whether an association is causal Hill (1965) • Temporal relationship • Strength of association • Dose response relationship • Replication of the findings • Biologic plausibility • Consideration of alternate explanations • Cessation of exposure • Specificity of the association • Consistency with other knowledge
- Slides: 53