Causal Diagrams in Psychopathology Applications in Models of


 = 815. 19, RMSEA")


")


 • FA Focus on “important,")


 (18")


 Can be “Mediated” causal variable/relation also (one that “explains” a causal")


 X 4 X 6 Y 1")


 for Clinical Decision-Making • Can estimate treatment focus")


")


 X 1 (. 2 -. 3)")


: Makes the clinician question")


 between")


 – one for each")

 – –")


 causal factors? Amenable to")


: Sensitivity analysis – how")
 – Validity limited")


 – Better")
 • >100% of variance")


 •")
, by P. Spirtes, C.")
. Principles of Behavioral Assessment:")

. The assessment-treatment relationship and functional analysis in behavior")
. Behavioral assessment. In: Hersen")

- Slides: 155
Causal Diagrams in Psychopathology: Applications in Models of Causality and Clinical Decision-Making Stephen N. Haynes University of Hawai’i, USA University of Málaga, Spain sneil@hawaii. edu
IV Workshop on Causal Reasoning in Clinical Decision Making April, 2009 Gracias a Pedro L. Cobos et Otros Antonio Godoy
• A presentation about – A challenging context for clinical decisions: • Understanding complex clinical cases in psychopathology • Making appropriate treatment decisions with complex cases • Communicating case formulations to others
– Application of Causal Diagrams in Psychopathology to Aid Causal Reasoning and Clinical Decisions • Idiographic (variance within a person across time) -- the main focus! • Nomothetic (variance across persons) • Not about what I know, investigate, or teach • About what I’m thinking about and learning
My Main Points? • Causal diagrams – Help explain complex behavior problems – Help in functional analysis and Clinical Case Formulation – Provide an alternative, more precise, clinically useful language in causal models of psychopathology and in clinical case formulation (CCF)
• Causal Diagrams: – Help estimate relative magnitude of effect of various treatment foci, given component causal judgments – Encourage Parsimony in causal models in psychopathology and CCF – Help detect less obvious functional relations in psychopathology and treatment – Guide focus of clinical research
• Causal Diagrams: – Help evaluate between-clinician agreement in CCF judgments – Help examine congruence between treatment mechanisms and causal relations for a client
• Causal Diagrams: – Encourage a systematic evaluation by the clinician of component his/her component clinical decisions and judgments – Help educate about clinical decisions, psychopathology, CCF (supervision, graduate training, other professionals)
• Causal Diagrams – Emphasize importance of • Multiple causal paths • Bidirectional causal relations • Moderator Variables • Mediator Variables – In psychopathology and clinical case formulation
• One goal of presentation: – to promote a standardized, formalized, quantitative use of causal diagrams in psychopathology and clinical case formulation – Discuss limitations, challenges in use of causal diagrams
More on Causal Diagrams • Some examples of causal diagrams--> (some Idiographic (one person, across time), some nomothetic (across persons) Just note--elements and structures of diagrams
Example of a CBCF Situational triggers Internal and external Idiosyncratic cognitive schema Distress Others laughed at or ridiculed me/did not appreciate my work. Worthlessness … Concentration difficulties; worry Was reminded about limitations of my job Inadequate/incompetent/ trapped/hopeless job Was reminded about limitations of living in ___ Depression Anger Others hurting/rejecting and can’t be trusted Talked or thought of talking to others about my feelings. Cognitive CCF Causal Diagram for Depressed Client; Mumma Anger inhibition: “Gentlemen don’t get angry. ” -
Armed conflicts in Nicaragua www. american. edu/TED/ice/nic aragua. htm
CCF causal diagram for depressed mood Χ 2(df = 531) = 815. 19, RMSEA =. 083, CFI =. 89. Today’s Distress Item Parcels dd ee ff aa . 75*** bb cc gg ii . 87*** . 79*** GD: Mixed hh Anger Depressed . 28*. 79*** . 83*** -. 26*** a -. 45** -. 08 ICS 2. 1/3 -. 20** . 92***. 57***. 82*** . 60*** i h ICS 2. 2 Anger/Inhibitio n Others Hurtful, Rejecting -. 28* -. 19* b . 69*** . 01 ICS 3 Job: Inadequate Trapped ICS 1 Worthlessnes s . 59*** -. 07 j . 88***. 98***. 88*** d c Today’s Cognition Item Parcels e . 82*** f . 84*** g
9 yr-old boy; home and classroom problems CCF Causal Diagram for Oppositional/Defiant Behs
Schematic Causal Diagram for comorbidity
An example of Functional Analytic Clinical Case Model CCF Causal Diagram for verbal aggression AROUSING EFFECTS OF COFFE EXCESSIVE AND REPETITIVE PETITIONS TO STAFF WEEK END VISITS TO THE FAMILY VERBAL AGRESSIONS TOWARD STAFF PROPERTY DESTRUCTION STAFF ATTENTION PRN MEDICATION RELAXATIONS
Ahn, Kim et al. , 2005
CCF Causal Diagram child oppositional/att entional probs family disorganiz ation varied sleep schedule Genetic/ Family history of ADHD unspecific commands deficits in parenting skills Not complying with adult requests inconsistent reinforcements high neg. comments / low pos. comments Whining, grumbling (at home) child poor commun. skills Inattentive and off-task behavior (at school) child unprepare d for school Incomplete school work child inattention
William James
From William James: Talk to Teachers. 1899; Causal Model for Human Behavior
Leonardo da Vinci
(Causal model proving that there is water on the moon)
Common Elements and Characteristics of Causal Diagrams Across Disciplines • Illustrate complex functional relations among multiple variables (sometimes causal) – Input variables (causes of behavior problems) – Output variables (Behavior problems • Illustrate possible causal variables • Some show strength of relation • Most show direction of causal relation • Multiple formats for diagrams
What is necessary in causal diagrams in Psychopathology and Functional Analysis? • Standardized presentation of elements of psychopathology • Emphasis on Important elements relevant to the explanation of the behavior problems and clinical decisions • Amenability to quantification, to model effects of clinical decisions
Causal Diagrams in Functional Analytic Clinical Case Diagrams (FACCD) • FA Focus on “important, modifiable causal variables and functional relations relevant to a person’s behavior problems”
• FACCD = – Causal diagram for a functional analysis – a subset of standardized path and causal diagrams; often used in physics, agronomy, economics, oceanography, (informally in mindmapping).
Goal: • To help clinician decide where for focus treatment (which causal variables should be the focus of treatment)
18 Elements In, and Outcomes from, a FACCD (Functional Analytic Clinical Case Diagram) (18 clinical judgments; All Leading to Estimates of the Relative Magnitude of Effect of Various Treatment Foci For an Individual Client; but there are more factors affecting these decisions)
• 1. Multiple client behavior problems • Note: Methods of deriving these judgments are discussed in references at end • Note: variables are abstractions. Consider Ys = panic episodes, alcohol overuse, nightmares, aggressive behaviors, social anxiety, manic episodes, self-injury, etc.
Y 1 Y 2 Y 3
2 Relative “Importance” of behavior problems. Estimated by: – Risk of harm to self – Risk of harm to others – Personal distress – Qualitative ratings of importance (by client, therapist, others) – Note: relevant to estimating magnitude of effect of intervention
Y 1 More Important Y 2 Less Important Y 3
3 Forms of functional relations between behavior problems
Y 1 Correlated Noncausal Unidirectional Causal Bidirectional Causal Y 2 Y 3
4. Strength of functional relations among behavior problems – Degree of “Influence” – Conditional probability of occurrence – Time-lagged correlation – Estimated strength of manipulation effects
Y 1 Stronger Y 2 Weaker Y 3
5. Consequences of behavior problems – Health risks – Functional impairment – Economic, legal risks – Effects on others – (e. g. , risks associated with financial decisions during manic periods, legal risks associated with drug use)
Y 1 Z 1 Y 2 Y 3
• Note effect on treatment decisions for just a few elements of FACCD! • If importance, form, direction were different, different focus could be indicated to achieve maximum magnitude of benefit for this client
6. Causal Variables – Broadly defined: empirically supported variables where changes lead to changes in behavior problem ( or other variables) – E. g. , positive response contingencies, antecedent stimuli, avoidance, settings/contexts, negative ruminations, elevated adrenal responses, conditional emotional responses, outcome expectations, reduction in aversive states, life stressors, neurotransmitter receptor density, communication skills, etc
X 4 X 1 Y 1 Z 1 X 2 Y 2 X 3 Y 3
7. Modifiability of causal variables – “clinical utility” – relatively unmodifiable: brain injury, early traumatic life experiences; genetic vulnerability, early learning) – no effective treatments (e. g. , some medical disorders, some neurological deficits) – External factors--cooperation from partner, staff cooperation, unavoidable life stressors) – Client factors--cognitive abilities, treatment adherence - interference
More Modifiable Less Modifiable Unmodifiable
X 4 X 1 Y 1 Z 1 X 2 Y 2 X 3 Y 3
8. Forms of functional relations between causal variables and behavior problems
Correlated Unidirectional Noncausal Causal Bidirectional Causal
X 4 X 1 Y 1 Z 1 X 2 Y 2 X 3 Y 3
9. Strength of Functional/Causal Relations between causal variables and behavior problems Stronger Weaker
X 4 X 1 Y 1 Z 1 X 2 Y 2 X 3 Y 3
• 10 -11 Form and Strength of causal relations among causal variables
X 4 X 1 Y 1 Z 1 X 2 Y 2 X 3 Y 3
12 -16: Additional Types of Causal Variable and Causal Relations: – Moderating variable – Mediating variable – Hypothetical causal variable – Interactive causal relations – Causal chains
Interactive Causal Mediating Variable Causal Chain Moderating Variable Hypothetical Causal Variable
Moderating variable (affects the strength of relationship between two other variables; Can be buffering, protective, etc. )
X 4 X 1 Y 1 Z 1 X 2 X 5 X 3 Y 2 Y 3
Mediating Variables: “Explain/account for” the relations between two other variables (e. g. , why/how does X 1 ---> Y? ) X 1 X 3 X 2 Y
X 4 X 1 Y 1 Z 1 X 2 X 5 X 3 Y 2 Y 3
Hypothetical causal variable and relationship (not measured, inferred, to be measured, indicated in Nomothetic research) Hypothetical Causal Variable Hypothetical Causal Relation
X 4 X 6 X 1 Y 1 Z 1 X 2 X 5 X 3 Y 2 Y 3
Causal chains (distal/proximal) Can be “Mediated” causal variable/relation also (one that “explains” a causal relation) X 1 X 2 X 3 Y 1
X 4 X 6 X 1 Y 1 Z 1 X 2 X 5 Y 2 X 7 X 3 Y 3
17. Direction of Functional Relations
X 1 ( X 1 = X 2) X 4 X 6 Y 1 - Z 1 X 2 X 5 Y 2 X 7 X 3 Y 3
18. Temporal Relations Among Variables • Temporal order flows from left to right, with earlier events to the left of later events. Thus, in the next figure, variable X 7 occurs before variable X 3 • Note the erroneous causal inferences that might result
X 7 Y 2 X 3 Y 3
Benefits of Idiographic Causal Diagrams (FACCDs) for Clinical Decision-Making • Can estimate treatment focus with greatest magnitude of effect for client • Can indicate where additional assessment is needed • Can indicate potentially important but unmeasured causal variables
Qualitative Implications, 2 • Emphasizes focus on important, modifiable variables • Encourages parsimony in communicating FA to others • Models potential effects of interventions: (similar to “modeling” approaches in physics, oceanography, economics, agronomy)
Qualitative Implications, 3 • Indicates omitted variables and functional relations: nomothetically based potential causal relations that are not operational for a particular client • Has “face value” for other professionals – (They can understand why you want to pursue a particular intervention strategy) • Emphasizes importance of good quality assessment for the most valid judgments
Qualitative Implications, 4 • Can be used in a constructive, positive manner. FACCDs can focus on client goals, values, strengths. • Mandates knowledge of treatment mechanisms for various treatments which, in turn, can guide assessment efforts • It promotes a logical, sequential, linear approach to clinical case formulation.
Qualitative Implications, 5 • It requires that the clinician examine his or her individual clinical judgments (e. g. , does this patient’s marital conflict strongly affect his use of alcohol) • Can suggest possible outcomes if natural changes occur in patients’ environment, behavior, thoughts, emotions
***Quantification of Causal Diagrams***: Assigning Quantitative Values to the Elements of an Idiographic Causal Diagram (Functional Analytic Clinical Case Diagram)
• Sample Weights: • Importance of behavior problems – 1= mild – 2=moderate – 4=severe • Strength of functional relations –. 2 =weak –. 4 =moderate –. 8 =strong • Modifiability of Causal variable –. 2 =mild –. 4 =moderate –. 8 = strong
X 1. 2 X 4 0 X 2. 4 X 3. 8 . 2 Y 1 (1) . 4 . 8 Y 2 (2) Y 3 (4)
• Absolute values have no effect on clinical judgments derived from quantitative analyses within the FACCD • Only relative values (ratios) within a FACCD affect the judgments (as long as they are linear transformations), – E. g. , for modifiability (. 2 -. 8) = (. 1 -. 4) • (except for Sensitivity Analysis, discussed later) • And, more face value if they approximate expected true functional relations and values (importance, modifiability)
Assets of Causal Diagram Quantification 1 Estimating Relative Magnitude of Effect in FACCD • Allows the calculation of vector coefficients, to model intervention judgments • Relative (within-person) Magnitude of Effect (ME) of one causal variable: • ME(xi/yi) = ∑(xi/yi) (sum of all path coefficients from xi)
X 1 . 2 Y 1 . 8 3. 2 . 8 X 2. 2 . 8 Y 2 1 ME(x 1) = (. 8 x. 2 x 3) + (. 8 x. 2 x 1) =. 51 ME(x 2) = (. 2 x. 8 x 3) +(. 2 x. 8 x. 2 x ) + (2. X. 8 x 1) 25% increase in expected ME for X 2 =. 67
X 4 X 6 X 1 a b c Y 1 f d e X 2 h g X 5 Y 2 i X 3 Y 3 Z 1
X 1. 2 . 2. 8 . 04. 2. 2 X 2. 8 X 3 Y 1 3. 8 X 5 X 4 X 6 Y 1. 2 Y 3 Z 1
• Note 3 causal paths from X 1 --> Y 1 (some moderated and mediated ME(x 1/y 1) = Direct Path = (. 2 x 3) + Through X 2 = (. 2 x. 8 x. 2 x 3) + Interaction Path (with X 2) = (. 2 x 8 x. 2 x 3) (. 12) + (. 02) =. 16 (relative magnitude of effect) Can then compare to other Path Coefficients for other causal variables
• MEs can be estimated by analyzing graphical properties of the diagram (values) or performing symbolic derivations governed by the diagram (using algebra symbols) (Pearls, 1995) • A benefit of quantification of causal diagrams (FACCDs): causal variables with multiple causal paths are particularly important in accounting for and modifying behavior problems
• Can estimate the likely effects of planned and unplanned changes in causal variables, or the introduction of new moderator, mediator variables. “What would happen if…? ”
Adding “Uncertainty” • The parameters of the elements in causal models are only estimates based in the best available evidence. • Can establish domains of confidence in the outcome of our predictions and interventions • Reflects measurement and judgment limitations • In addition to “error” components in all causal diagrams (referring to unmeasured causal variables)
• Uncertainty Analysis – indicates the degree of uncertainty in the overall magnitude of effect associated with a causal variable (reflects the cumulative uncertainty in the causal model) – draws attention to variables about which more information is needed to reduce their degree of uncertainty and increase confidence in the causal model
• Uncertainty tolerance – the degree of uncertainty that can be tolerated depends on the importance of the judgments – Whenever important judgments are being made, or when the negative consequences of an erroneous decision are severe, such as use of an invasive treatment with a patient, additional data should be acquired to reduce uncertainty
Uncertainty Analysis (adding confidence limits to parameter estimates) X 1 (. 2 -. 3) (. 6 -. 8) 3 (. 6 -8) X 2 (. 2 -. 6) Y 1 (. 5. 8) (. 2 -. 6) Y 2 1 ME(x 1) = ((. 6 -. 8) x (. 2 -. 3) x 3) + ((. 6 -. 8) x (. 2 -. 3) x (. 2 -. 6) x 1) =. 37 -. 76 ME(x 2) = ((. 2 -. 6) x (. 6 -. 8) x 3) +((. 2 -. 6) x (. 6 -. 8) x (. 2 -. 6) x 1) + ((2. -. 6) X (. 5 -. 8) x 1) =. 48 -1. 72 (compared to. 67 assuming no uncertainty)
Increasing Acceptability of Causal Diagrams: “Causal Relevance Diagrams” • When quantitative information is encoded in the elements (path coefficients, importance and modifiability ratings) of a causal diagram (Shafer, 1996)
X 1 . 2 Y 1 . 8 3. 8 X 2. 2 . 8 . 2 Y 2 1 Given a Legend, this causal path diagram is the same as…
X 1 X 2 Y 1 Y 2 This causal relevance diagram. Sometimes more clinically acceptable and computationally identical
Assets of Causal Diagram Quantification 3: Illustrating the effects of changes in clinical judgments on MEs and optimal treatment foci
Moderating
Moderating
Moderating
• Another benefit of quantification of causal diagrams (FACCDs): Makes the clinician question his/her judgments e. g. : – Are the communication problems of a distressed couple twice as modifiable as their negative attributions about each other? – Is a client’s depressive episodes twice as important as their overuse of alcohol?
Assets and Implications of Model Quantification 4 • Assuming a content valid FACCD all appropriately focused interventions will be effective (compared to no intervention), but with differential magnitudes of effect – Some supporting literature on increased ME with FACCD-focused treatments; only from SIBs
Assets and Implications of Model Quantification 4 • The Effects of Treatments With Multiple Mechanisms/Components • Examples of treatment mechanisms/components – Automatic negative self-statements in treatment of depression – Identifications of emotions with anxiety disorders – Communication training with distressed couple – Alcohol outcome expectancies – Guilt in sex-abuse (or assault) related PTSD – Parental use of + reinforcement with child – Experiential avoidance – Desensitization in social anxiety reduction
Model 1: A Good Match Between the Functional Analysis and the Treatment
Estimating Magnitudes of Effects • Assigning relative values to variables and paths – Behavior problem importance: 10 – Strong causal/functional relations: . 8 – Weak causal/functional relations: . 2 – Modifiability of causal variables: . 8 (note; the strength, modifiability and estimates are only judgments by the clinician, informed by the outcome of assessment)
Solving for Paths for client 1: • Magnitude of Effect of this treatment, for this client, given these clinical judgments, is 10. 4 • (Note: value has no absolute meaning and is useful only for comparing effects of different clinical judgments using the same values for a client)
Model 2: A Less-Than-Optimal Match Between the Functional Analysis and the Treatment
Changes in Functional Analysis From 1 st client • Different client--> Same behavior problem, causal variables, treatments, and treatment mechanisms. • Only the strength of causal relations have been changed • Now: Major treatment mechanisms are relevant but do not match (are less congruent with) the most important causal relations
Solving for Paths for client 2 • Magnitude of Effect of this treatment, for this client, given these clinical judgments, is 5. 1 • About 1/2 of magnitude of effect for client 1
Model 3: The Magnitude of Effects for Two More Narrowly focused Treatment
Changes in Functional Analysis From Previous clients • Same client, causal variables, causal relations • Two treatments, each more narrowly focused (fewer treatment mechanisms) • Treatment 2 addresses strong causal relation • Treatment 3 addresses weak causal relation
Solving for Both Paths for client; Magnitudes of Treatment Effects: • Treatment 2: • Treatment 3: 5. 1 1. 3
Model 4: The Magnitude of Effects for a Broadly focused Treatment
Solving Paths for Broadly Focused Treatment • This treatment is the most effective because it addresses all causal variables • Magnitude of effect is 13. 4 --20% greater than best of more focused treatments
Implications • All validated treatment programs will be effective if they address any causal variable for a client (noted in “ 3”), given stability of other factors • Relative Magnitudes of treatment effects will be affected by match between treatment mechanisms and causal variables operating for an individual treatment
Implications 2 • Idiographic treatment (a treatment designed to match the clinical case formulation for the client) will often be more effective than standardized treatments
Implications 3 • Magnitude of treatment effect will be affected by match (congruence) between treatment mechanisms and causal variables operating for an individual client
Implications 4 • incremental treatment effectiveness for individualized treatment is affected by: – The degree to which causes for a behavior problem differ across clients (in causal variables and the strength of relationships) • Implications for treatment research – Measure causal relations for client – Look for match between causal relations and treatment mechanisms – Group comparisons without examining treatment mechanisms and treatment-causal variable match are not optimally useful
Implications 5 • The identification of potential treatments for a behavior problem can guide assessment foci (Godoy) • e. g. if insomnia is problem: clinician should assess presleep thoughts, presleep physiological arousal, sleep hygiene, stimulus control factors (the mechanisms thought to underlie different treatments)
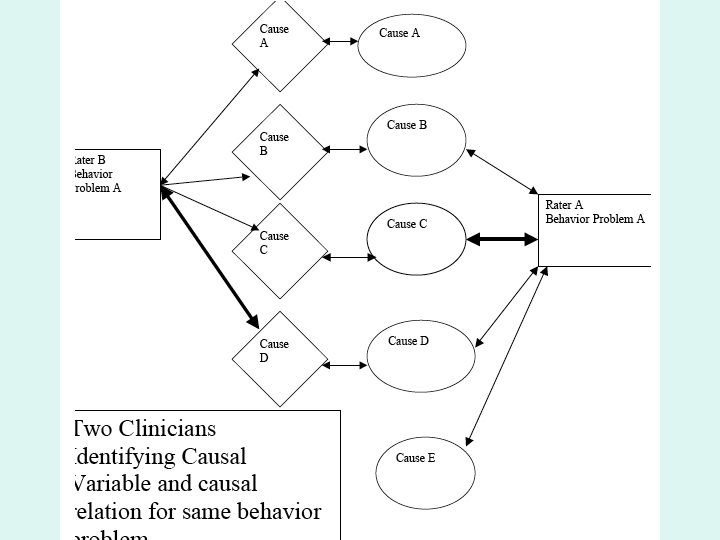
Assets and Implications of Model Quantification 5 • Causal Diagrams and Calculating Inter. Clinician Agreement for FA and CCF • Allows for a more refined analysis of specific areas of agreement and disagreement – Agreement about client problems – Agreement about causal variables – Agreement about functional relations
• Five possible agreements (omitting “modifiability” for this example) – one for each of the three causal variables (B, C, D) identified by both raters – one for causal variable A (identified by clinician B) – one for causal variable E (identified by clinician A)
• A sample quantification of the degree of agreement: – “ 0” for no agreement or congruence – “ 1” for weak agreement or congruence (e. g. , Causal Variable C identified by both raters who disagree about its strength of relation with the BP – “ 2” for strong agreement (e. g. , Causal variable B; variable and strength of relation).
• The sum of these agreements 4 out of 10 (40%) – – – A=0 B=2 C=1 D=1 E=0 • Can examine overlap of 2 full causal diagrams: see Tufts University site • Complication 1: Semantic Similarity • Complication 2: Relative strength vs true agreement of functional relations
Assets and Implications of Model Quantification 6: Intervention with Proximal vs Distal Causal Variables • Intervention with proximal, compared to distal, causal variables will always have greater but often less generalizable magnitude of effects (assuming strength of causal relations are the same)
David Hume, 1740
“The idea, then, of causation must be derived from some relation among objects. . . whatever objects are considered as causes or effects, are contiguous; and that nothing can operate in a time or place, which is ever so little removed from those of its existence. Though distant objects may sometimes seem productive of each other, they are commonly found upon examination to be linked by a chain of contiguous causes”
Distal and Proximal Causal Variables Y 2 X 3 X 2 Distal X 1 proximal X 4 Y 1 Y 3
• Similar to Aristotle’s concept of Final cause: That cause but for which a thing would not exist; the final purpose of a thing.
• Relevant for “systems-level functional analysis” (e. g. , institutional systems issues affecting aggression in psychiatric units) • Relevant to some “personality-based” treatments, with important referral problems – Generalized fears of rejection/abandonment, paranoid ideation, irritability, when main target is conflict with partner – E. g. , X 1 = escalation in marital conflict X 2 = early learned fears of abandonment Y 1 = marital distress Y 2, Y 3 = other relationship distress
• Effect of X 2 on Y 1 will always be less than effect of X 1 on Y 1 because the ME of X 2 is modified by path and modifiability coefficients associated with X 1 • Relative difference in ME of X 1 and X 2 will be a function of values for X 3 and X 4 (strength and modifiability), as well as X 2 --> X 1 paths – Therefore, ME of X 2 can be greater than X 1, given greater importance of generalized effects
• Should you focus on immediate vs distal (general) causal factors? Amenable to quantifiable analysis. A function of: – Relative importance of behavior problem that is down stream from proximal causal variable – Relative strength of relations • Distal ---> multiple behavior problems • Proximal ---> main behavior problem
• Generalized vs specific causal variable, consider X 1 = escalation in marital conflict X 2 = early learned fears of abandonment, or paranoid tendencies, or fears of rejection, or critical interpersonal style Y 1 = marital distress Y 2, Y 3 = other relationship distress
Distal and Proximal Causal Variables Y 2 X 3 X 2 Distal Probably, bidirectional relations between causal variables, with treatment X 1 proximal X 4 Y 1 Y 3
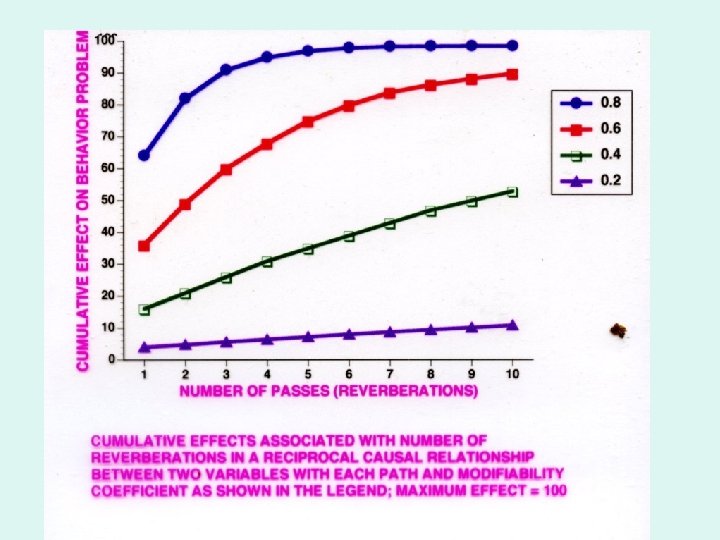
Assets and Implications of Model Quantification 7: An emphasis on Bidirectional Causal Relations • Useful in treatment foci – Treatment can focus on either variable – Beneficial effects can continue after treatment termination--reverberation • e. g. , marital distress <---> depression paranoid thoughts <---> social isolation
• Note relevance of differential calculus – Each slope approaches a maximum (where slope, first derivative, approximates 0) – So, can estimate degree to which a focus on a bidirectional relation results in greater magnitude of effect than a focus on a unidirectional causal relation by comparing first derivative with causal path of unidirectional causal relation
• Another benefit of quantification of causal diagrams (FACCDs): Sensitivity analysis – how the variation in the output of a mathematical model can be apportioned, qualitatively or quantitatively, to different sources of variation in the input of a model – what proportion of variance in behavior problems does the causal model (the clinician think) can be controlled? ) – Requires that functional relations affecting a BP assume true “proportions of variance” (different than the relativistic approach discussed thus far)
• Limitations of Causal Diagrams and FACCD (Idiographic causal models) – Validity limited by validity of assessment data; often limited assessment strategies – Are “hypothesized” “clinical judgments” and reflect biases of clinician – Causal relations can be unstable across time, validity is time-limited
– Dynamic aspects of behavior problems are not modeled • Bipolar shifts • Borderline personality disorders -emotional lability (the dimension of interest) • Latency of causal effects (arrows not proportional to latency of causal effects; are ordinal, rather than ratio in terms of strength) – Consider problem of selecting weaker but quicker causal relation vs. stronger but delayed causal relation?
– Semantic ambiguity overlap/imprecision in variables • Consider “different”? causal variables such as – Marital conflict - marital distress – Reinforcement - response contingency – Contextual- setting - antecedent factors – Arousal - Physiological arousaltension, – Monitoring deficits - inattention, attention deficit
– Pseudo-precision: Quantification increases the patina of precision (because of measurement/inferential limitations) – Better to use “ß” (reflecting units of change, rather than “R”? )
• FACCD’s (+ some nomothetic causal diagrams are overidentified) • >100% of variance accounted for in behavior problem – Causal variables necessarily related/dependent – Semantic overlap? – Different response modes (activity, thinking, physiological) – But, can still search for greatest ME
– Incomplete--Do not contain all causal variables; often omit variables between a cause and a behavior problem
– Nonlinear functional relations • Many medication effects • Pleasant/unpleasant events --> mood (functional plateaus) • Physiological arousal --> cognitive functioning • Life stressors --> psychological symptoms (catastrophic functions) • use of algebraic functions in paths? Or unnecessary?
X 1 X 2 Y 1 a Y 2 Modeling nonlinear functional relations? a: y = a. X 23 (parabolic function between X and Y)
References and Sources • sneil@hawaii. edu (e-mail for copies of the PP presentation) • Website with behavioral assessment definitions, clinical case examples of FACCDs, manuscripts. http: //www 2. hawaii. edu/~sneil/ba/ Login: behavioral; Password: assessment • For visual graphics, diagramming software: http: //vue. tufts. edu/
• Causation, Prediction, and Search, 2 nd Edition, (2001), by P. Spirtes, C. Glymour, and R. Scheines ( MIT Press) • Causality: Models, Reasoning, and Inference, (2000), Judea Pearl, Cambridge Univ. Press • Computation, Causation, & Discovery (1999), edited by C. Glymour and G. Cooper, MIT Press • Causality in Crisis? , (1997) V. Mc. Kim and S. Turner (eds. ), Univ. of Notre Dame Press. • The Art of Causal Conjecture (1996). Glenn Shafer. MIT Press.
• Haynes, S. N. and O’Brien. W. O. (2000). Principles of Behavioral Assessment: A Functional Approach to Psychological Assessment. New York: Plenum/Kluwer Press. . • Haynes, S. N. & O'Brien, W. O. (1990). The functional analysis in behavior therapy. Clinical Psychology Review, 10, 649 -668. • Haynes, S. N. , Uchigakiuchi, P. , Meyer, K. , Orimoto, Blaine, D. , and O’Brien, W. O. (l 993). Functional analytic causal models and the design of treatment programs: Concepts and clinical applications with childhood behavior problems. European Journal of Psychological Assessment, 9, l 89 -205. • O’Brien, W. H. & Haynes, S. N. (1995). A functional analytic approach to the conceptualization, assessment and treatment of a child with frequent migraine headaches. In Session. , l, 65 -80.
• Haynes, S. N. , Richard, D. , & O’Brien, W. B. (l 996). The Functional Analysis in Behavior Therapy: Estimating the Strength of Causal Relationships for the Design of Treatment Programs. Gedrags-therapie, 4, 289 -3 l 4. • O’Brien, S. N. , & Haynes, S. N. (1997) Functional analysis. In: Gualberto Buela-Casal (Ed): Handbook of Psychological Assessment. Madrid: Sigma • Floyd, F. , Haynes, S. N. , & Kelly, S. (1997). Marital assessment: A dynamic and Functional analytic Perspective. In: W. K. Halford, & H. J. Markman (Eds. ). Clinical handbook of marriage and couples intervention (pp 349 -378). New York: Guilford Press • Nezu, A. , Nezu, C. , Friedman, & Haynes, S. N. Case formulation in behavior therapy. T. D. Eells (Ed. ) (l 997). Handbook of psychotherapy case formulation. NY: Guilford. • Haynes, S. N. , Leisen, M. B. , & Blaine, D. D. (1997). Functional Analytic Clinical Case Models and Clinical Decision-Making. Psychological Assessment, 9, 334 -348.
• Haynes, S. N. (1998). The assessment-treatment relationship and functional analysis in behavior therapy. European Journal of Psychological Assessment, 14 (1), pp. 26 -34. • Haynes, S. N. , & Williams, A. W. (2003). Clinical case formulation and the design of treatment programs: Matching treatment mechanisms and causal relations for behavior problems in a functional analysis. European Journal of Psychological Assessment, 19, 164 -174. • Haynes, S. N. (2005). La formulacion cliniaca conductual de caso: pasos para la elaboracion del analisis funcional [Behavioral clinical case formulation: guidelines on the construction of a functional analysis]. In V. E. Caballo (ed. ), Manual para la evaluacion clinica de los trastornos psicologicos: Estrategias de evaluacion, problemas infantiles y trastornos de ansiedad [Handbook for the clinical assessment of psychological disorders: Assessment strategies, childhood problems and anxiety disorders] (pp. 77 -97). Madrid: Piramide. • Virus-Ortega, J. , & Haynes, S. N. (2005). Functional analysis in behavior therapy: Behavioral foundations and clinical application. International Journal of Clinical and Health Psychology, 5, 567 -587
• Haynes, S. N. & Kaholokula, J. K. (2007). Behavioral assessment. In: Hersen and A. M. Gross Handbook of Clinical Psychology John Wiley and Sons, New York. • Raimo Lappalainen, R. , Timonen, T, & Haynes, S. N. (2009). The functional analysis and functional analytic clinica case formulation--a case of anorexia nervosa. In P. Sturmey (Ed. ). Clinical case formulation • Kaholokula, J. K. , Bello, I. Nacapoy, A. H. , Haynes, S. (in press). Behavioral assessment and functional analysis. D. Richard & S. Huprich (Eds): Clinical Psychology: Assessment, Treatment, and Research
The End