
Cath Lab Financial Challenges in 2019 and How

Cath Lab Financial Challenges in 2019 and How to Deal with Them Michael Guiry, PA-C, MBA Vice President, Cardiovascular Service Line St. Luke’s University Health Network

Michael Guiry, PA-C, MBA I have no relevant financial relationships
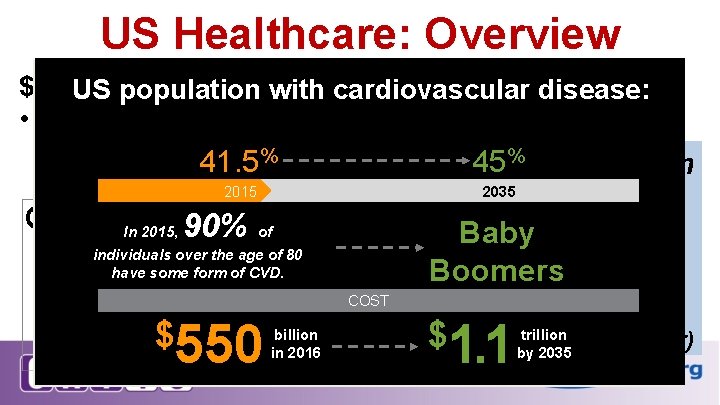
US Healthcare: Overview $3. 5 US trillion = cost of UScardiovascular Healthcare in 2017 population with disease: • ($10, 739 person, 3. 9% increase year over year) 41. 5% Total US GDP: 45%$18. 6 Trillion GDP 2015 90% 18. 3% 2035 Baby Boomers projected to reach COST $5. 5 Trillion by 2025 In 2015, of. CMS. gov, research/data statistics Advisory Board individuals over the age of 80 have some form of CVD. trillion $550 inbillion $ (growth assumption 2016 1. 1 byof 20355. 8% / year)
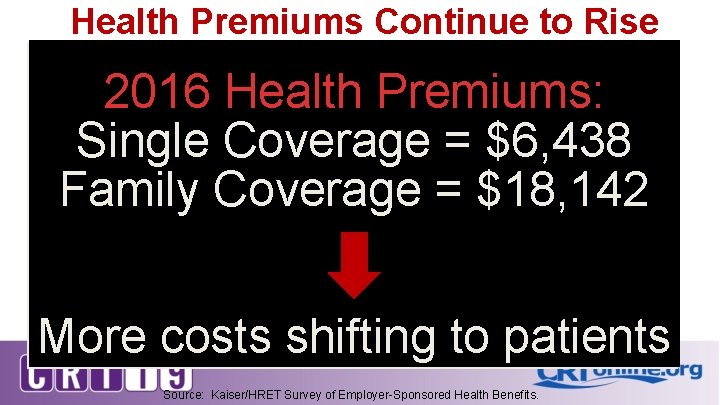
Health Premiums Continue to Rise 2016 Health Premiums: Single Coverage = $6, 438 Family Coverage = $18, 142 More costs shifting to patients Source: Kaiser/HRET Survey of Employer-Sponsored Health Benefits.

Healthcare Reform Goals Access Quality Cost QUALITY = VALUE COST Cost
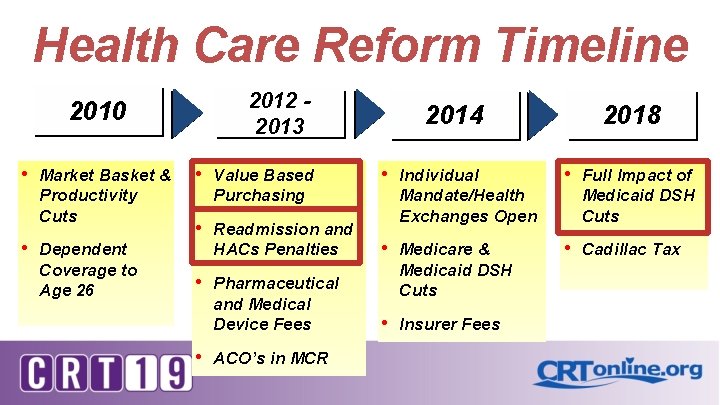
Health Care Reform Timeline 2012 2013 2010 • • Market Basket & Productivity Cuts Dependent Coverage to Age 26 • Value Based Purchasing • • • 2014 2018 • • Readmission and HACs Penalties Individual Mandate/Health Exchanges Open Full Impact of Medicaid DSH Cuts • • Cadillac Tax Pharmaceutical and Medical Device Fees Medicare & Medicaid DSH Cuts • Insurer Fees ACO’s in MCR
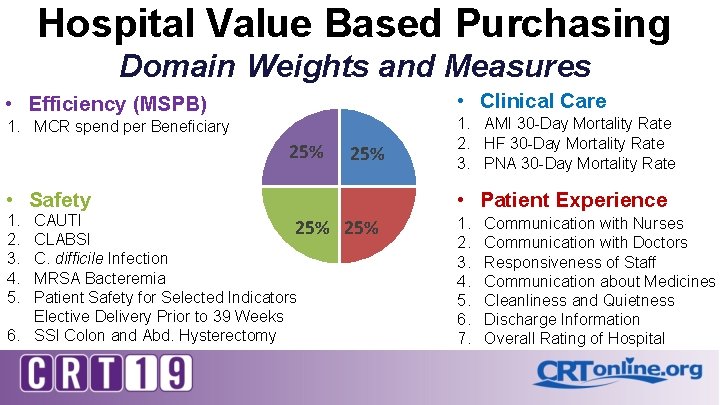
Hospital Value Based Purchasing Domain Weights and Measures • Clinical Care • Efficiency (MSPB) 1. MCR spend per Beneficiary 25% • Safety 1. 2. 3. 4. 5. CAUTI 25% CLABSI C. difficile Infection MRSA Bacteremia Patient Safety for Selected Indicators Elective Delivery Prior to 39 Weeks 6. SSI Colon and Abd. Hysterectomy 1. AMI 30 -Day Mortality Rate 2. HF 30 -Day Mortality Rate 3. PNA 30 -Day Mortality Rate • Patient Experience 25% 1. 2. 3. 4. 5. 6. 7. Communication with Nurses Communication with Doctors Responsiveness of Staff Communication about Medicines Cleanliness and Quietness Discharge Information Overall Rating of Hospital
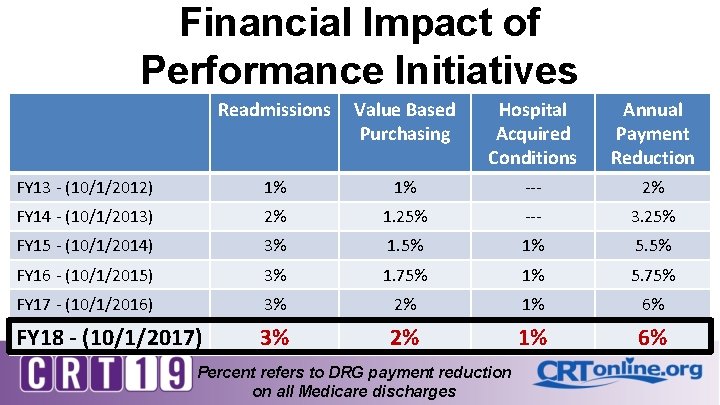
Financial Impact of Performance Initiatives Readmissions Value Based Purchasing Hospital Acquired Conditions Annual Payment Reduction FY 13 - (10/1/2012) 1% 1% --- 2% FY 14 - (10/1/2013) 2% 1. 25% --- 3. 25% FY 15 - (10/1/2014) 3% 1. 5% 1% 5. 5% FY 16 - (10/1/2015) 3% 1. 75% 1% 5. 75% FY 17 - (10/1/2016) 3% 2% 1% 6% FY 18 - (10/1/2017) 3% 2% 1% 6% Percent refers to DRG payment reduction on all Medicare discharges
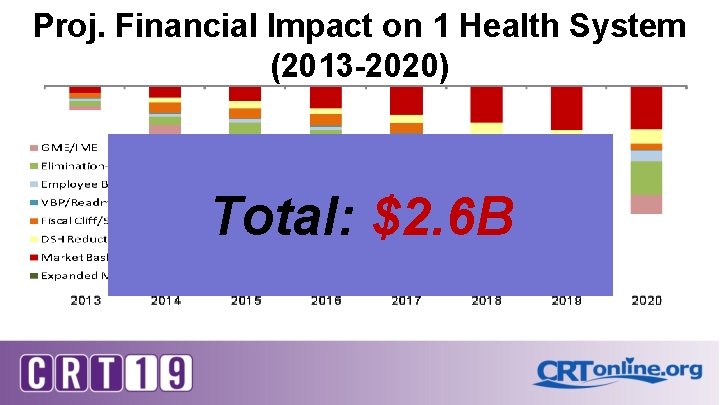
Proj. Financial Impact on 1 Health System (2013 -2020) Total: $2. 6 B
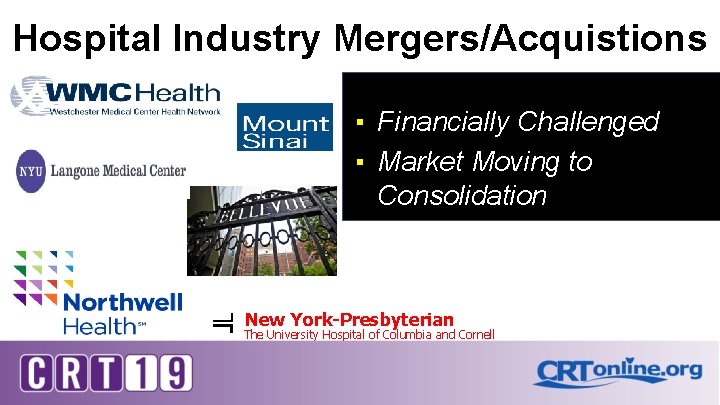
Hospital Industry Mergers/Acquistions ▪ Financially Challenged ▪ Market Moving to Consolidation New York-Presbyterian The University Hospital of Columbia and Cornell
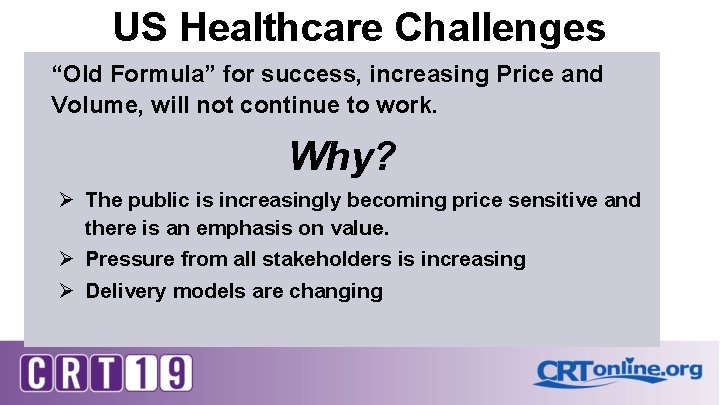
US Healthcare Challenges “Old Formula” for success, increasing Price and Volume, will not continue to work. Why? Ø The public is increasingly becoming price sensitive and there is an emphasis on value. Ø Pressure from all stakeholders is increasing Ø Delivery models are changing
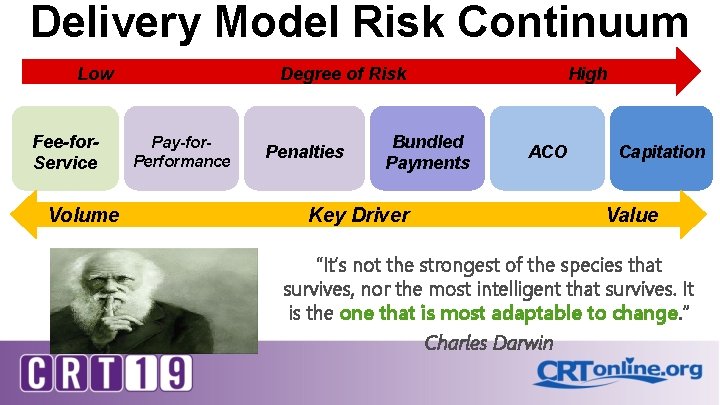
Delivery Model Risk Continuum Low Fee-for. Service Volume Degree of Risk Pay-for. Performance Penalties Bundled Payments Key Driver High ACO Capitation Value “It’s not the strongest of the species that survives, nor the most intelligent that survives. It is the one that is most adaptable to change. ” Charles Darwin
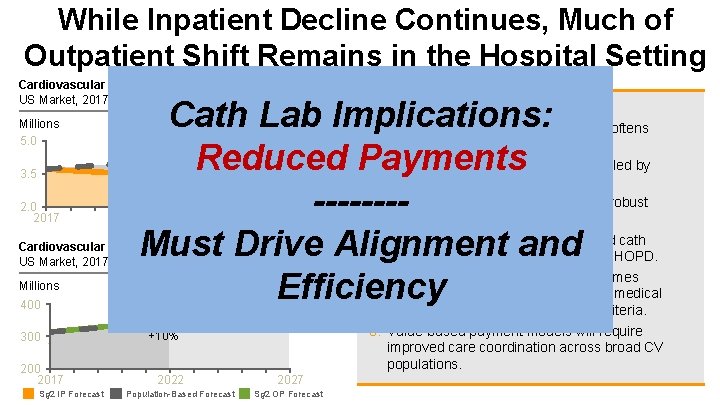
While Inpatient Decline Continues, Much of Outpatient Shift Remains in the Hospital Setting Cardiovascular Inpatient Discharges US Market, 2017– 2027 Millions 5. 0 3. 5 2. 0 2017 CARDIOVASCULAR TRENDS Cath Lab Implications: 1. Reduced Payments 2. 3. -------4. Must Drive Alignment and 5. Efficiency 5 -Year 10 -Year +10% +21% – 6% – 9% 2022 2027 Cardiovascular Outpatient Volumes US Market, 2017– 2027 Millions 400 300 2017 5 -Year +11% 10 -Year +23% +20% +10% 2022 2027 Sg 2 IP Forecast Population-Based Forecast Sg 2 OP Forecast The decline in medical admissions softens as patient complexity increases. Cardiac surgery provides IP growth, led by heart valves and CABG. Transcatheter valve therapies drive robust valve growth. Strong OP shift continues for EP and cath procedures but largely remain in the HOPD. Overall PCI and diagnostic cath volumes decline due to epidemiology factors, medical management and appropriate use criteria. 6. Value-based payment models will require improved care coordination across broad CV populations.
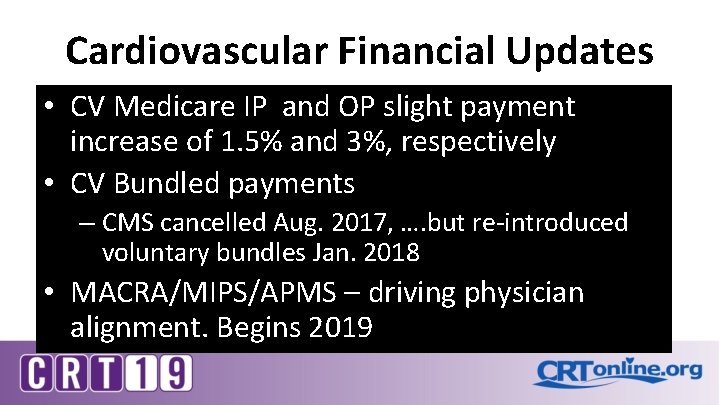
Cardiovascular Financial Updates • CV Medicare IP and OP slight payment increase of 1. 5% and 3%, respectively • CV Bundled payments – CMS cancelled Aug. 2017, …. but re-introduced voluntary bundles Jan. 2018 • MACRA/MIPS/APMS – driving physician alignment. Begins 2019
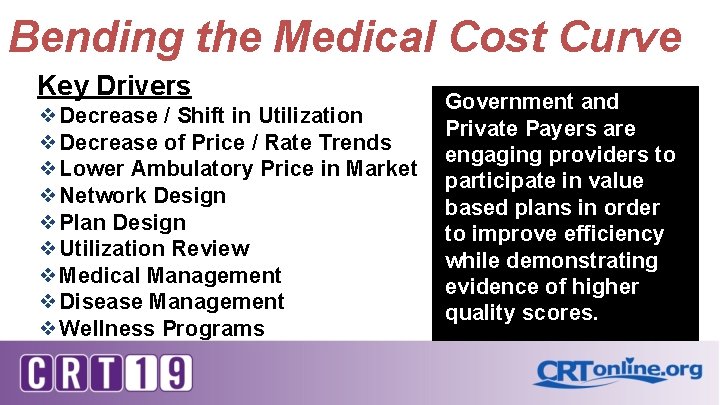
Bending the Medical Cost Curve Key Drivers ❖Decrease / Shift in Utilization ❖Decrease of Price / Rate Trends ❖Lower Ambulatory Price in Market ❖Network Design ❖Plan Design ❖Utilization Review ❖Medical Management ❖Disease Management ❖Wellness Programs Government and Private Payers are engaging providers to participate in value based plans in order to improve efficiency while demonstrating evidence of higher quality scores.

Align and Engage Front-line Staff to Lower Costs and Drive Quality
Opportunities Alignment • Create waste reduction strategy in the organization • Adopt integrated performance measurement systems • Redesign the system to achieve superior results in reduced costs, improved quality, and patient engagement • Align operations for the new reimbursement world
Opportunities Engagement • Engage staff in the what & why of value delivery • Engage patient & family perspective • Ensure a safe environment for sharing ideas • Develop and support new skills at all levels of the system
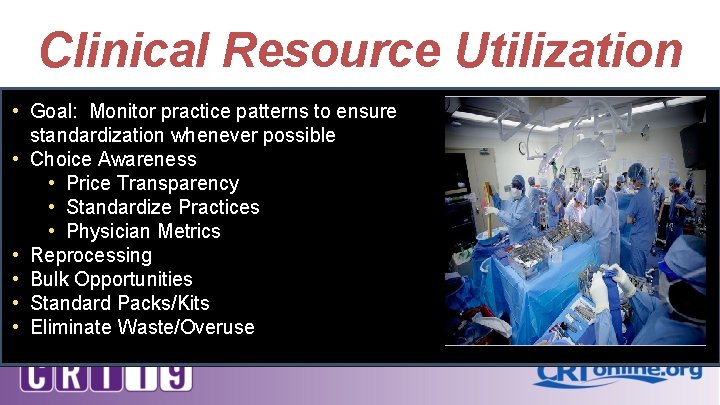
Clinical Resource Utilization • Goal: Monitor practice patterns to ensure standardization whenever possible • Choice Awareness • Price Transparency • Standardize Practices • Physician Metrics • Reprocessing • Bulk Opportunities • Standard Packs/Kits • Eliminate Waste/Overuse
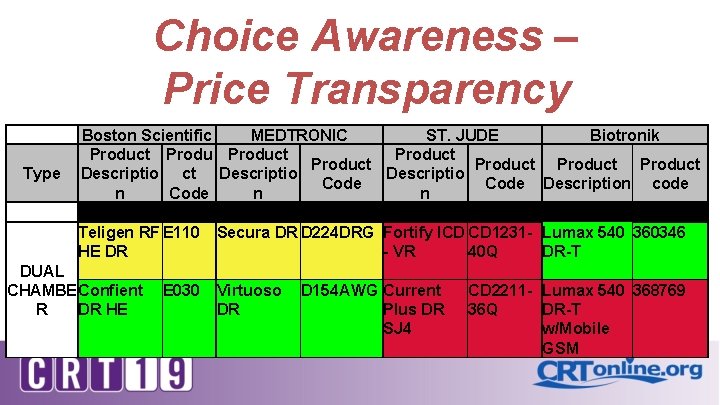
Choice Awareness – Price Transparency Type Boston Scientific MEDTRONIC Product Descriptio Code n Teligen RF E 110 Secura DR D 224 DRG HE DR DUAL CHAMBE Confient R DR HE E 030 Virtuoso DR ST. JUDE Product Descriptio Code n Fortify ICD CD 1231 - VR 40 Q D 154 AWG Current Plus DR SJ 4 Biotronik Product Description code Lumax 540 360346 DR-T CD 2211 - Lumax 540 368769 36 Q DR-T w/Mobile GSM
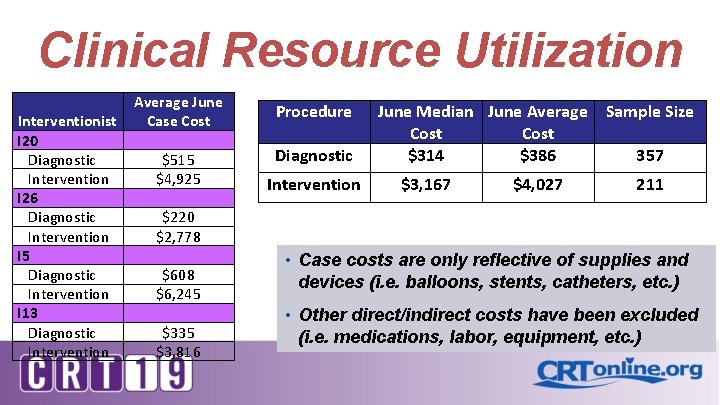
Clinical Resource Utilization Interventionist I 20 Diagnostic Intervention I 26 Diagnostic Intervention I 5 Diagnostic Intervention I 13 Diagnostic Intervention Average June Case Cost $515 $4, 925 Procedure Diagnostic Intervention June Median June Average Cost $314 $386 $3, 167 $4, 027 Sample Size 357 211 $220 $2, 778 $608 $6, 245 $335 $3, 816 • Case costs are only reflective of supplies and devices (i. e. balloons, stents, catheters, etc. ) • Other direct/indirect costs have been excluded (i. e. medications, labor, equipment, etc. )
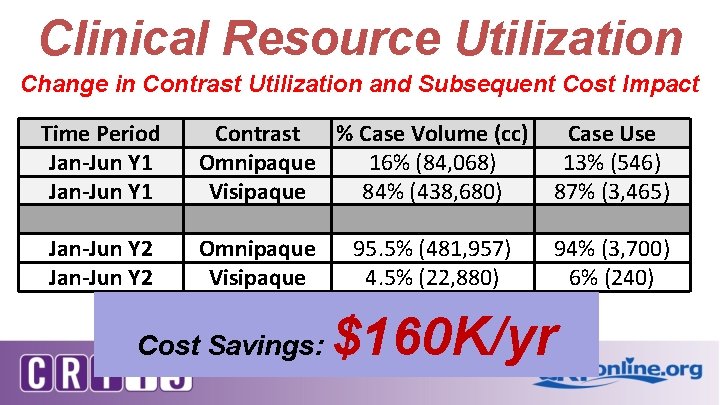
Clinical Resource Utilization Change in Contrast Utilization and Subsequent Cost Impact Time Period Jan-Jun Y 1 Jan-Jun Y 2 Contrast % Case Volume (cc) Omnipaque 16% (84, 068) Visipaque 84% (438, 680) Case Use 13% (546) 87% (3, 465) Omnipaque Visipaque 94% (3, 700) 6% (240) Cost Savings: 95. 5% (481, 957) 4. 5% (22, 880) $160 K/yr
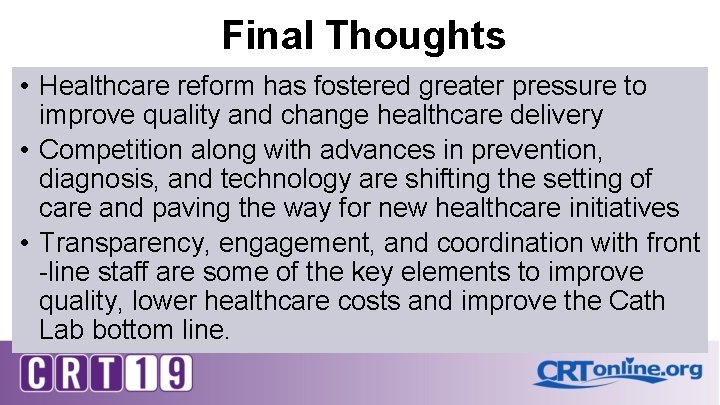
Final Thoughts • Healthcare reform has fostered greater pressure to improve quality and change healthcare delivery • Competition along with advances in prevention, diagnosis, and technology are shifting the setting of care and paving the way for new healthcare initiatives • Transparency, engagement, and coordination with front -line staff are some of the key elements to improve quality, lower healthcare costs and improve the Cath Lab bottom line.


Impact of New Technology on Cath Lab Volume • FFR-CT
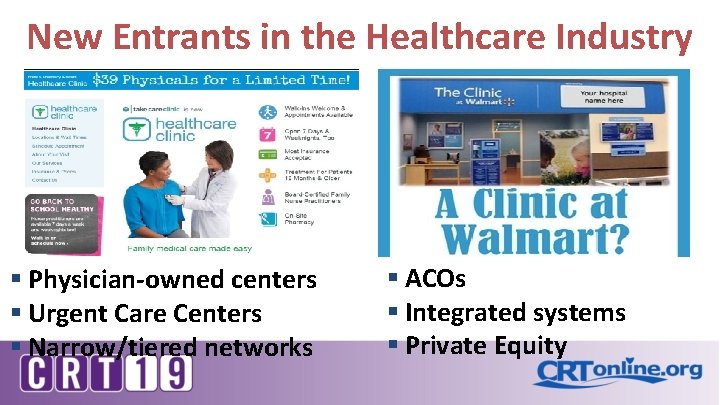
New Entrants in the Healthcare Industry § Physician-owned centers § Urgent Care Centers § Narrow/tiered networks § ACOs § Integrated systems § Private Equity
- Slides: 26