Categorical Data Are Summarized By Tables Graphs Categorical


Categorical Data Are Summarized By Tables & Graphs Categorical Data Graphing Data Tabulating Data Summary Table Bar Charts Pie Charts Pareto Diagram

Organizing Categorical Data: Summary Table § A summary table indicates the frequency, amount, or percentage of items in a set of categories so that you can see differences between categories. Banking Preference? ATM Automated or live telephone Percent 16% 2% Drive-through service at branch 17% In person at branch 41% Internet 24%

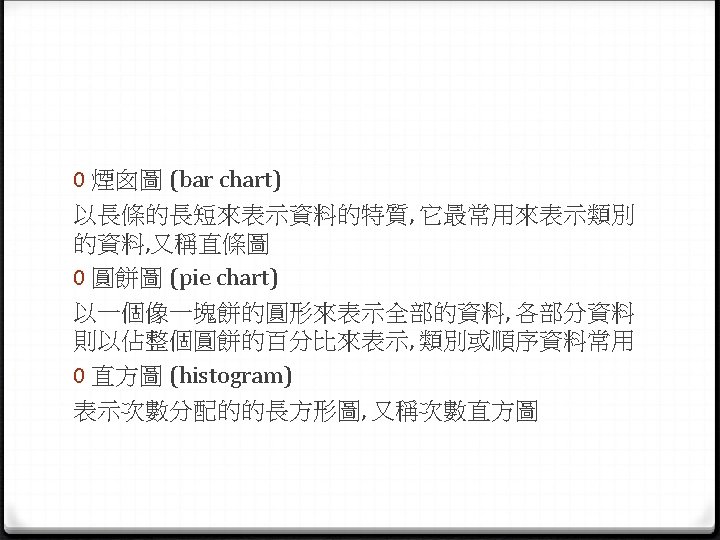
Organizing Categorical Data: Bar Chart § In a bar chart, a bar shows each category, the length of which represents the amount, frequency or percentage of values falling into a category.

Organizing Categorical Data: Pie Chart § The pie chart is a circle broken up into slices that represent categories. The size of each slice of the pie varies according to the percentage in each category.

Organizing Categorical Data: Pareto Diagram

Tables and Charts for Numerical Data Ordered Array Stem-and-Leaf Display Frequency Distributions and Cumulative Distributions Histogram Polygon Ogive

Organizing Numerical Data: Ordered Array § An ordered array is a sequence of data, in rank order, from the smallest value to the largest value. § Shows range (minimum value to maximum value) § May help identify outliers (unusual observations) Age of Surveyed College Students Day Students 16 17 17 18 18 18 19 22 19 25 20 27 20 32 21 38 22 42 19 33 20 41 21 45 Night Students 18 23 18 28 Chap 211

Stem-and-Leaf Display 0 A simple way to see how the data are distributed and where concentrations of data exist METHOD: Separate the sorted data series into leading digits (the stems) and the trailing digits (the leaves)

Organizing Numerical Data: Stem and Leaf Display § A stem-and-leaf display organizes data into groups (called stems) so that the values within each group (the leaves) branch out to the right on each row. Age of College Students Age of Surveyed College Students Day Students 16 17 17 18 18 18 19 19 20 20 21 22 22 25 27 32 38 42 Night Students 18 18 19 19 20 21 23 28 32 33 41 45 Stem Leaf Night Students Stem Leaf 1 67788899 1 8899 2 0012257 2 0138 3 23 4 2 4 15

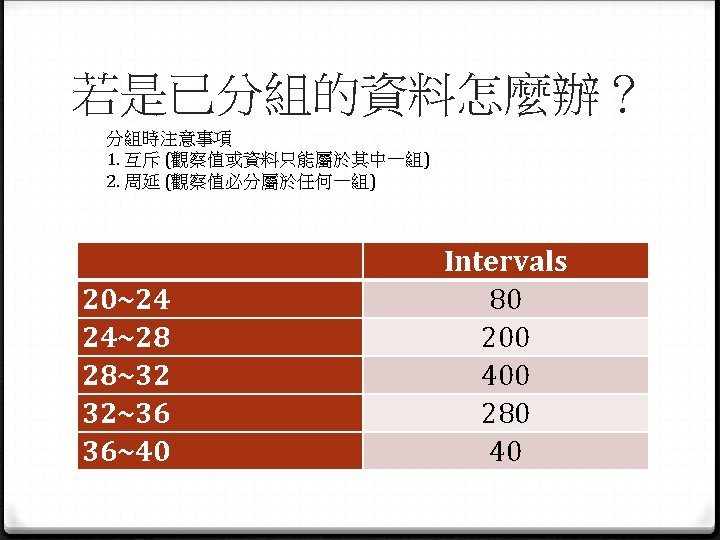

Intervals 組中點 20~24 80 22 1760 24~28 200 26 5200 28~32 400 30 12000 32~36 280 34 9520 36~40 40 38 1520 1, 000 30, 000

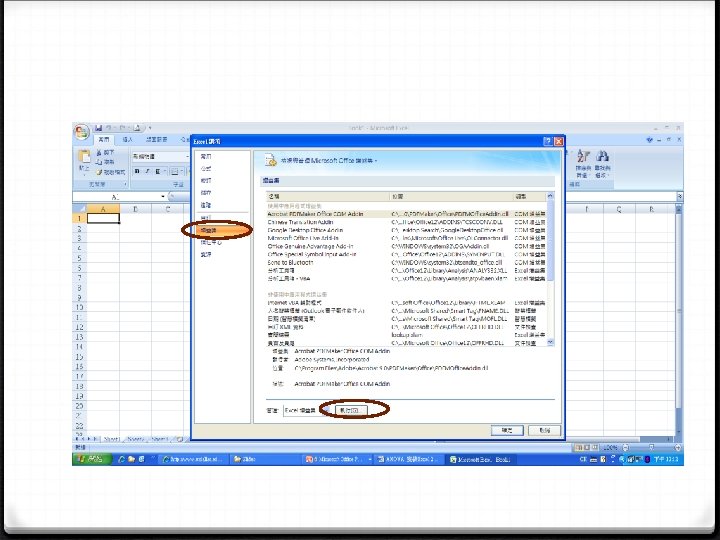
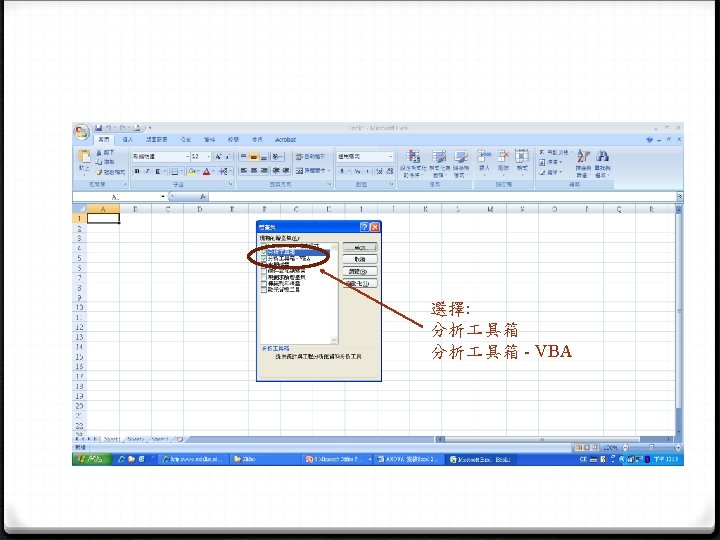
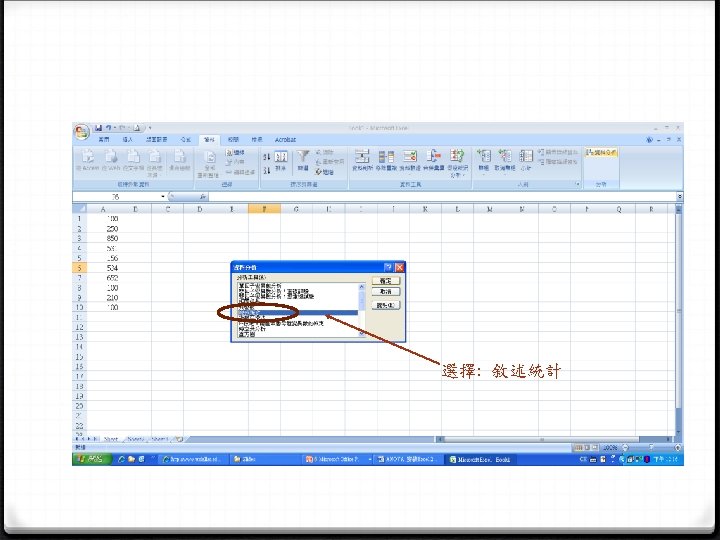
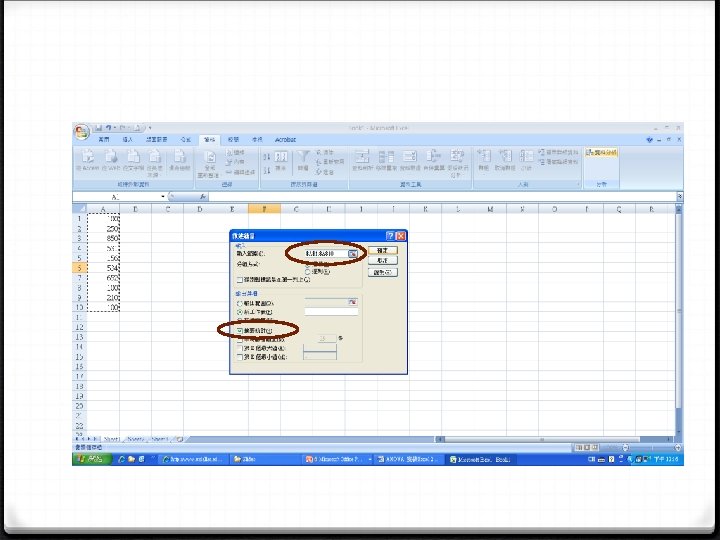
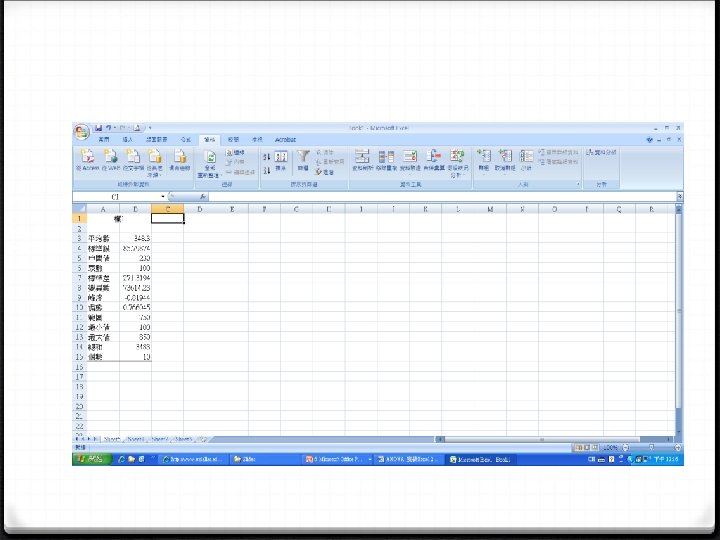
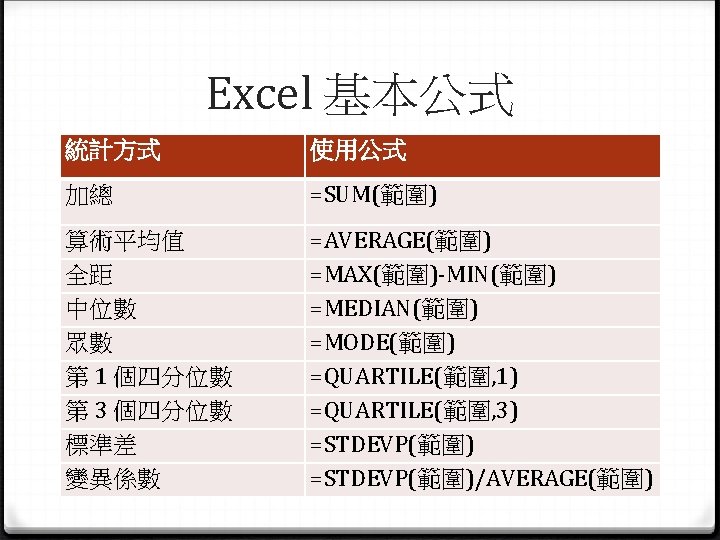
2007 Excel 的使用

- Slides: 28