Catalyst characterization Evolution of the catalyst bulk techniques

Catalyst characterization • Evolution of the catalyst: bulk techniques XRD XANES/EXAFS Mössbauer • Evolution of adsorbates: surface techniques FT-IR of adsorbates XPS
 Ano de X-rays")
X-ray tubes Vacuum tube HV Cathode Electrons Intensity (a. u. ) Ano de X-rays K Characteristic radiation min 0. 02 Filament supply Kb 0. 04 0. 06 Bremsstrahlung radiation 0. 08 0. 10 Wavelength (nm) The spectrum from an X-ray tube has discrete fluorescent lines superimposed on the continuous bremsstrahlung radiation

Energy Dissipation 3

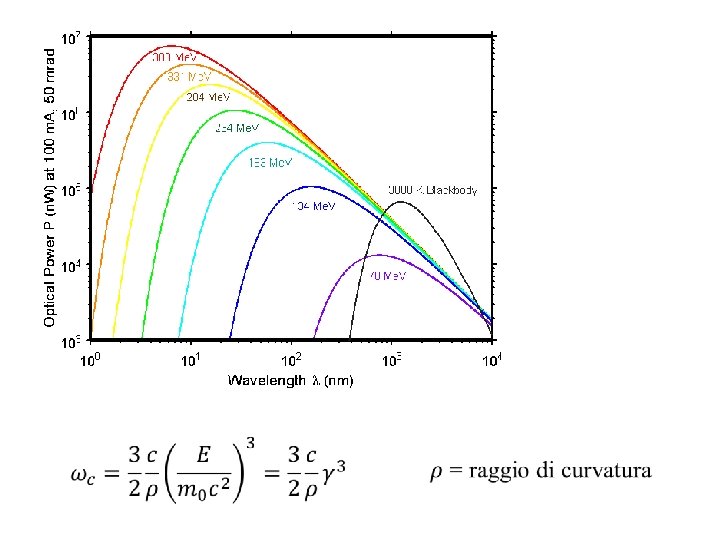
Synchrotron radiation angular distribution Electron orbit v Acceleration e- v << c m 0 = electron mass v = electron velocity E = electron energy c = velocity of light Q m 0 c 2/E = 1/g rad v c v Radiation angular distribution (a) electrons travelling at low speed and (b) electrons travelling at relativistic speed (g = (1 -v 2/c 2)-1/2 10000 at ESRF)

How a Storage Ring Works Booster Front-end Electron source LINAC BAIG, Karachi, 7 th. January, 2005 Optical hutch Experimental hutch

Time structure e-e-e- e- I Light pulses 100 ps 1 ms Time pulsed emission is interesting for studying rapid reactions t

Fluorescence Elemental analysis I Detector X-rays Sample wavelength Absorption m 2. 0 1. 0 X-rays Sample Detector Imaging X-rays Detector 0. 0 8800 9000 9200 9400 9600 E (e. V) Energy 9800 10000

XAFS: X-ray Absorption Fine Structure x-rays I 0 sample transmission experiment I 1 XANES X-ray Absorption Near Edge Structure EXAFS measured at Alba/CLÆSS Extended X-ray Absorption Fine Structure
 (220) (311)")
Beamline structure Optical hutch Monochromator: Si single crystals (111) (220) (311)

Experimental hutch Ionization chamber Fluo detector

Qualitative Picture of XAFS xra y Isolated atom M 1–M 5 L 3 2 p 3/2 L 2 2 p 1/2 L 1 2 s K 1 s EF The outgoing wave is scattered by neighbors Ex-ray continuum E photoelectron X X Single Scattering

Qualitative Picture of XAFS constructive interference – absorption maximum destructive interference – absorption minimum Here is where the interference is important! X Multiple Scattering

High-pressure EXAFS of solid and liquid Kr Solid Liquid Gas A. Di Cicco, A. Filipponi, J. P. Itié and A. Polian, Phys. Rev. B 54 (1996) 90869098

XANES vs EXAFS Inelastic mean free path

EXAFS standard formula

EXAFS standard formula Ri A Sj • absorber-scatterer distance: Ri • coordination numbers: Ni • disorder along the absorber – scatterer distance: s 2 • passive electron relaxation: S 02 • finite photo-electron mean free path: l(k) • function of scattering amplitude: fi(k) • phase function: i(k)
![Ni K-edge m 0 Outline of EXAFS analysis E 0 m FT[ ] 1](http://slidetodoc.com/presentation_image_h2/6dbb0d5c8f5ffda76831bf797143b06c/image-18.jpg "Ni K-edge m 0 Outline of EXAFS analysis E 0 m FT[ ] 1")
Ni K-edge m 0 Outline of EXAFS analysis E 0 m FT[ ] 1 2 1 Background subtraction 2 Fourier Transform

What we can learn from EXAFS 2. 3 Unpleasant thing about EXAFS: FT positions are shifted towards small distances. More unpleasant: Each FT peak has its own shift. Because of the phase shifts, extracting the structural information from EXAFS requires curve fitting with assumed (calculated) phase shifts. 2. 55 (real RCu-Cu)
 Pre-edge Peak Dipole selection rule (only in")
What we can learn from XANES: a) Pre-edge Peak Dipole selection rule (only in central-symmetric case!): Consider K-absorption for transition metals: l = ± 1 • initial state = 1 s (l=0) • states near EF are formed by nd electrons (l=2) central-symmetry no resonance non-central symmetry resonance (pre-edge peak) from [F. Farges, G. E. Brown, J. J. Rehr, Phys. Rev. B 56 (1997) 1809] T. Ressler et al. J. Phys. Chem. B 104, 27 (2000) 6360 -6370
 Edge Shift T. Ressler, R. E. Jentoft,")
What we can learn from XANES: b) Edge Shift T. Ressler, R. E. Jentoft, J. Wienold, M. M. Günter and O. Timpe: J. Phys. Chem. B 104, 27 (2000) 6360 -6370 I. Arčon, B. Mirtič, A. Kodre, J. Am. Ceram. Soc. 81 (1998) 222– 224 Why does it shift? 1) Electrostatic: it is harder for the photoelectron to leave a positive (oxidized) atom 2) Shorter bonds at higher oxidation states Fermi energy is higher
")
L 3 absorption edges for 5 d metals: (transition 2 p 3/2 5 d) G. Meitzner, G. H. Via, F. W. Lytle, and J. H. Sinfelt, J. Phys. Chem. 96 (1992) 4960 Intensity is proportional to the number of free 5 d states and also depends on valence state. But… …white line also depends on particle size and morphology: from A. L. Ankudinov, J. J. Rehr, J. J. Low, and S. R. Bare, J. Chem. Phys. 116 (2002) 1911 a) Pt 3 triangle (dashes), Pt 4 tetrahedron (solid), Pt 5 triangular bipyramid (dash-dot), and Pt 6 octahedron (dash-dot); (b) Pt 7 and Pt 4 clusters of different shape: planar ‘‘honeycomb, (dashes), D 5 h bipyramid (solid) , single-capped octahedron (long dashdot), Pt 4 tetrahedron (dots), and Pt 4 planar rhombus (dash-dot). What we can learn from XANES: c) White Line

XAS and small objects: coordination numbers A common subject: bulk metal versus metal clusters. All atoms are both absorber and scattering centers. • Bulk: any atom is equivalent to the others; • Cluster: surface atoms have a diminished coordination number. The average first coordination number depends on the size, i. e. surface to bulk ratio. Infinite lattice Small cluster The EXAFS coordination number is the weighted average of the coordination numbers of all absorbers.

Example: Ag/Ce. O 2
 Reduction treatment: in 5%H 2/He")
Example: Application of EXAFS to Pd, Pt/C Catalysts (b) Reduction treatment: in 5%H 2/He atmosphere, stepwise with T=50°C. Measurements at LN 2 temperature in order not to have interference of two effects: (i) due to different temperature vibrations and (ii) due to different particle sizes.
 Reference compound: metallic Pd foil")
Example: Application of EXAFS to Pd, Pt/C Catalysts (c) Reference compound: metallic Pd foil Checking your amplitudes and phases with reference spectra must be always the first step in every EXAFS study! The difference between a simply reduced Pd/C sample (hydrided) and one subsequently blown out by He flow (dehydrided)

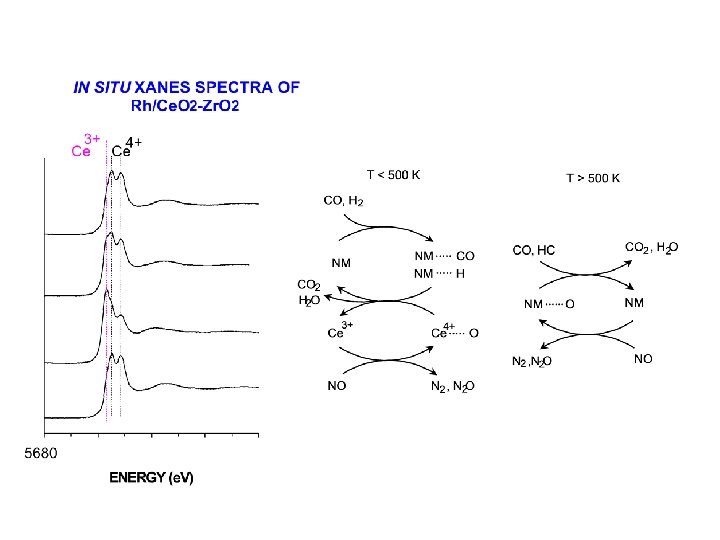
Ce. O 2 Zr. O 2 O Ce. O 2 - Zr. O 2 M = Ce or Zr
 w Applications: – catalyst composition – chemical nature of active")
X-Ray Electron Spectroscopy (XPS) w Applications: – catalyst composition – chemical nature of active phase – dispersion of active phase w Standard technique in catalyst characterisation w Recently developed Near Ambient Pressure techniques (quasi operando conditions).
")
X-Ray Electron Spectroscopy (XPS)

Binding Energy Conservation of energy corrects for potential difference between sample and analyser h = EB + Ekin + Ecorr energy of photons kinetic energy of emitted electron binding energy of emitted electron EB depends on chemical environment: • element • valence state • coordination (type of ligands, number, tetrahedral, octahedral. …)

XPS Equipment Number of emitted electrons measured as function of their kinetic energy

NAP-XPS Equipment

Where do Electrons come from? Intensity of a peak depends on: w composition where electrons are emitted Electrons interact with the solid w only a fraction of the emitted electrons reach detector with original kinetic energy w the longer the distance, the higher the number of “lost” electrons z = distance travelled by electrons = escape depth
 Inelastic Mean Free Path 10. 0 Au Au Ag")
Inelastic Mean Free Path (nm) Inelastic Mean Free Path 10. 0 Au Au Ag Au 5. 0 Ag Ag Au C Au Au 1. 0 Ag Be Ag Fe Ag Mo 0. 5 0. 3 2 5 10 Be 50 Be Be Ag Be C Au Ag Ag Mo C Be Mo W W Ag 100 Electron energy (e. V) 500 1000 2000

Is XPS a Bulk or a Surface Technique? 5000 XPS yield 4000 3000 2 nm 2000 1000 0. 5 nm 0 0 2 4 6 8 10 12 Thickness of absorbing layer z (nm) XPS is a surface-sensitive technique

XPS Survey of Al 2 O 3 O 1 s Al 2 O 3 Mg K O(KVV) N(E) E 745. 3 780. 6 Auger transitions 1253 e. V 766. 7 O(KVV) AUGER 805 765 Satellite C 1 s Ar 2 s 1000 900 Catalysis and Catalysts - XPS 800 700 600 500 EB 400 725 300 Al 2 s Al 2 p Ar 2 p 3/2 200 O 2 s 100 0

Effect of Valence on Chemical Shift - Al and Al 2 O 3 86 2 p 2 p 74. 7 72. 85 Al 76 ‘Binding energy’ (e. V) 66 Peak position determined by element and valence Chemical on elements Catalysis information and Catalysts - XPS

XPS spectrum of a Rh/Al 2 O 3 1. Element specificity of binding energies (calibration of BE) 2. Linear relation between intensity of the peaks and atomic concentration
 Xe 3 d 5/2 Chemical shift versus oxidation")
E (Xe 3 d 5/2) Xe 3 d 5/2 Chemical shift versus oxidation state

Morphological Information Dispersion of particles over a support from peak intensity ratio XPS spectra of Zr. O 2/Si. O 2
 after sulfidation")
Application of XPS. 1 XPS spectra of Mo. O 3/Si. O 2/Si(100) after sulfidation in H 2 S+H 2. (From De Jong et al. J. Phys. Chem (1993)
- Slides: 42