
Cash Flow Analysis The bottom line below the
Cash Flow Analysis “The bottom line, below the bottom line”
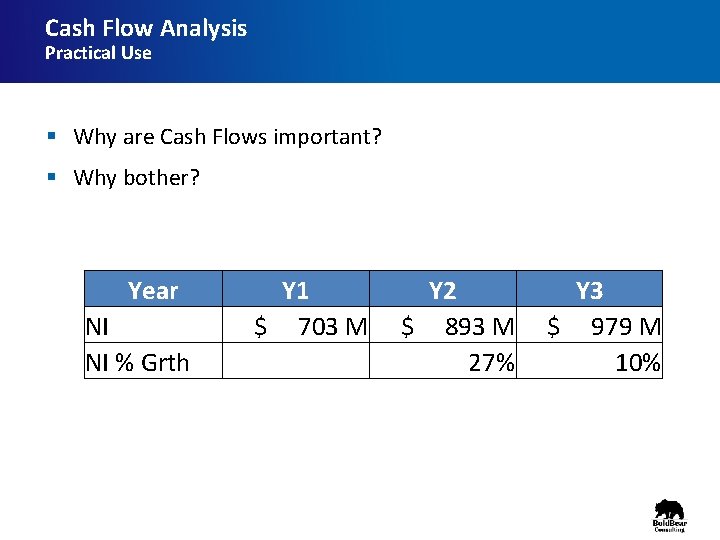
Cash Flow Analysis Practical Use § Why are Cash Flows important? § Why bother? Year NI NI % Grth Y 1 Y 2 Y 3 $ 703 M $ 893 M $ 979 M 27% 10%
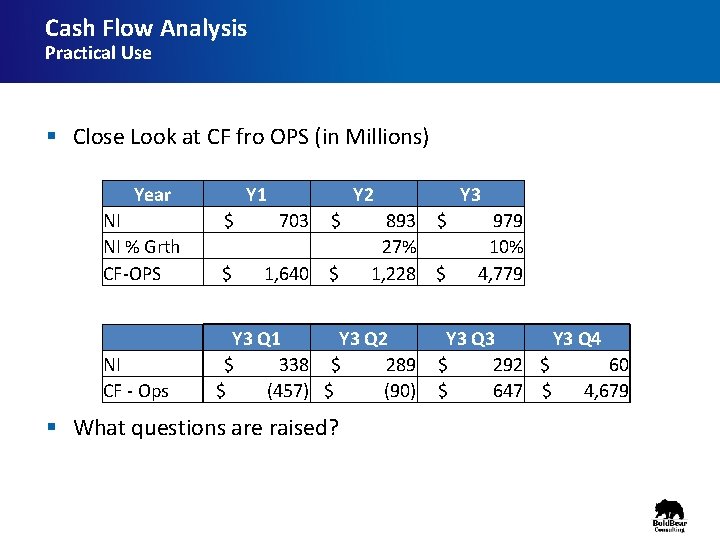
Cash Flow Analysis Practical Use § Close Look at CF fro OPS (in Millions) Year NI NI % Grth CF-OPS NI CF - Ops Y 1 Y 2 Y 3 $ 703 $ 893 $ 979 27% 10% $ 1, 640 $ 1, 228 $ 4, 779 Y 3 Q 1 Y 3 Q 2 Y 3 Q 3 Y 3 Q 4 $ 338 $ 289 $ 292 $ 60 $ (457) $ (90) $ 647 $ 4, 679 § What questions are raised?
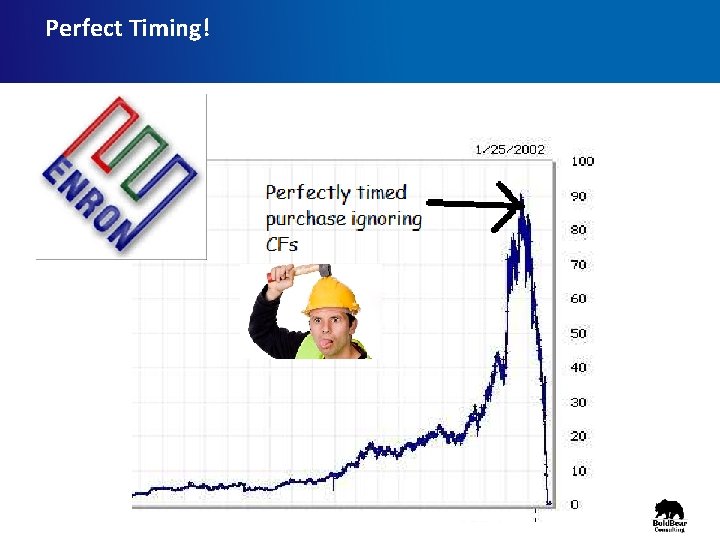
Perfect Timing!

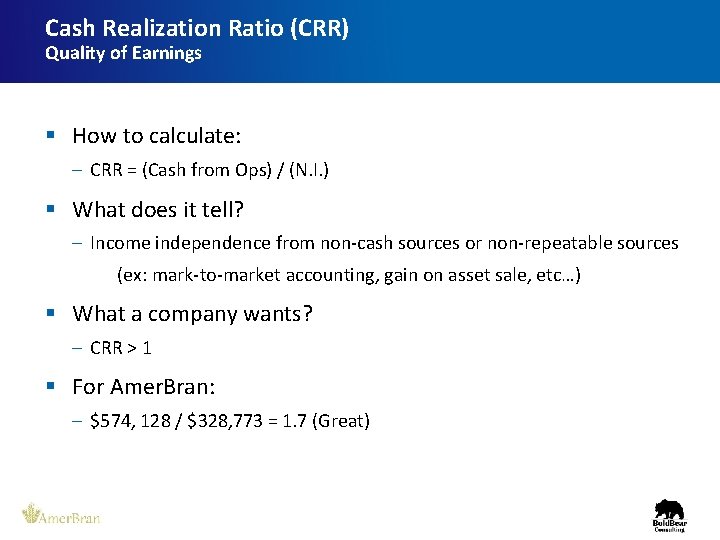
Cash Realization Ratio (CRR) Quality of Earnings § How to calculate: – CRR = (Cash from Ops) / (N. I. ) § What does it tell? – Income independence from non-cash sources or non-repeatable sources (ex: mark-to-market accounting, gain on asset sale, etc…) § What a company wants? – CRR > 1 § For Amer. Bran: – $574, 128 / $328, 773 = 1. 7 (Great)
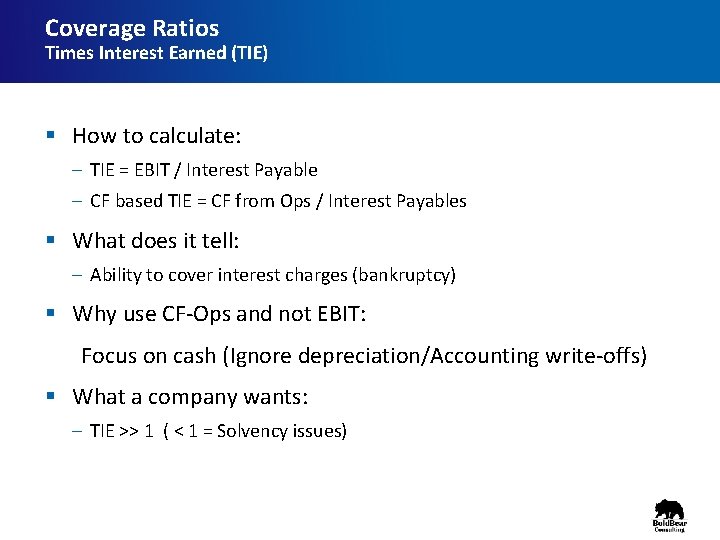
Coverage Ratios Times Interest Earned (TIE) § How to calculate: – TIE = EBIT / Interest Payable – CF based TIE = CF from Ops / Interest Payables § What does it tell: – Ability to cover interest charges (bankruptcy) § Why use CF-Ops and not EBIT: Focus on cash (Ignore depreciation/Accounting write-offs) § What a company wants: – TIE >> 1 ( < 1 = Solvency issues)
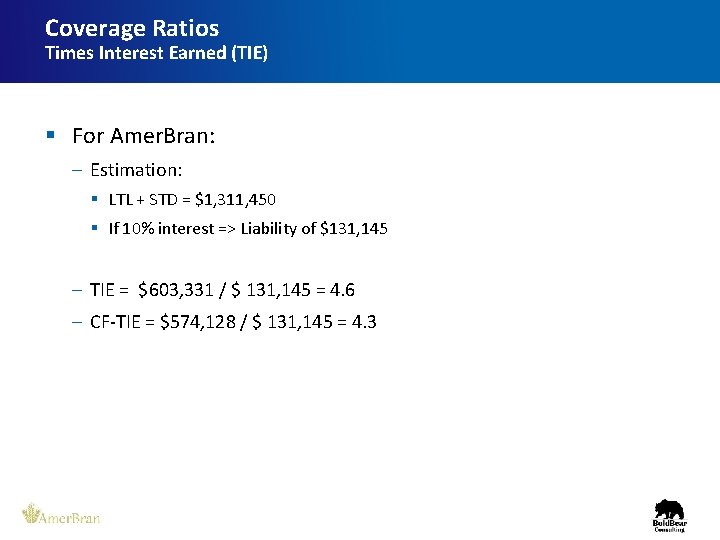
Coverage Ratios Times Interest Earned (TIE) § For Amer. Bran: – Estimation: § LTL + STD = $1, 311, 450 § If 10% interest => Liability of $131, 145 – TIE = $603, 331 / $ 131, 145 = 4. 6 – CF-TIE = $574, 128 / $ 131, 145 = 4. 3
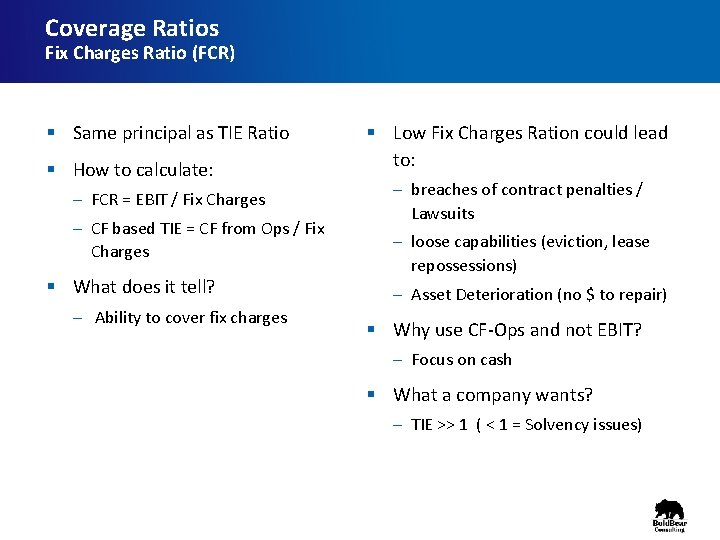
Coverage Ratios Fix Charges Ratio (FCR) § Same principal as TIE Ratio § How to calculate: – FCR = EBIT / Fix Charges – CF based TIE = CF from Ops / Fix Charges § What does it tell? – Ability to cover fix charges § Low Fix Charges Ration could lead to: – breaches of contract penalties / Lawsuits – loose capabilities (eviction, lease repossessions) – Asset Deterioration (no $ to repair) § Why use CF-Ops and not EBIT? – Focus on cash § What a company wants? – TIE >> 1 ( < 1 = Solvency issues)
Free Cash Flow (FCF) § How to calculate: – FCF = OPS CF – (KTLO + Debt Service + Dividends) § What does it tell? – Capacity to maintain (or increase) dividends § What a company wants? – Free Cash Flow > 0
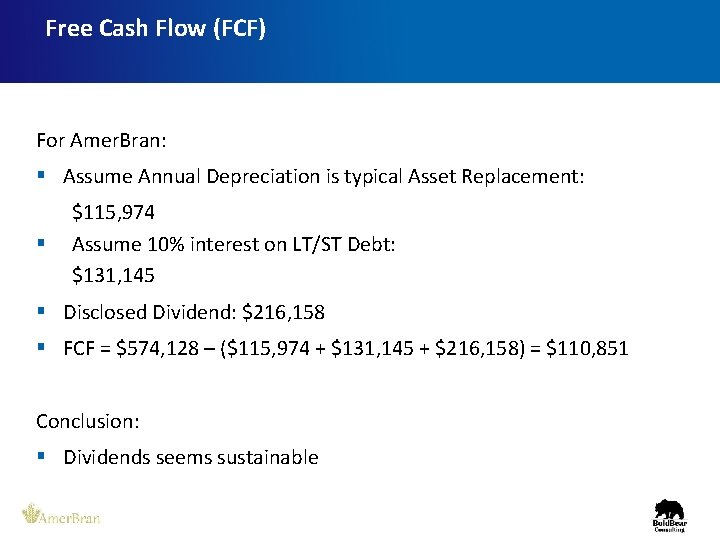
Free Cash Flow (FCF) For Amer. Bran: § Assume Annual Depreciation is typical Asset Replacement: § $115, 974 Assume 10% interest on LT/ST Debt: $131, 145 § Disclosed Dividend: $216, 158 § FCF = $574, 128 – ($115, 974 + $131, 145 + $216, 158) = $110, 851 Conclusion: § Dividends seems sustainable
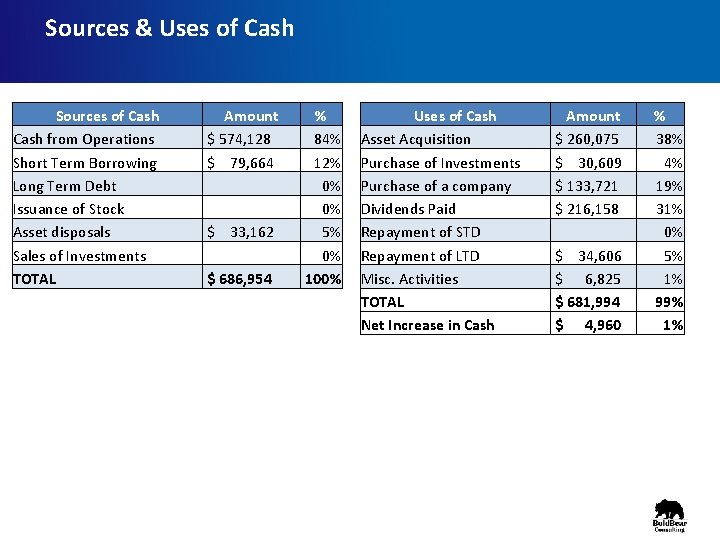
Sources & Uses of Cash Sources of Cash from Operations Short Term Borrowing Long Term Debt Issuance of Stock Asset disposals Sales of Investments TOTAL Amount $ 574, 128 $ 79, 664 $ 33, 162 $ 686, 954 % 84% 12% 0% 0% 5% 0% 100% Uses of Cash Asset Acquisition Purchase of Investments Purchase of a company Dividends Paid Repayment of STD Repayment of LTD Misc. Activities TOTAL Net Increase in Cash Amount $ 260, 075 $ 30, 609 $ 133, 721 $ 216, 158 $ 34, 606 $ 6, 825 $ 681, 994 $ 4, 960 % 38% 4% 19% 31% 0% 5% 1% 99% 1%
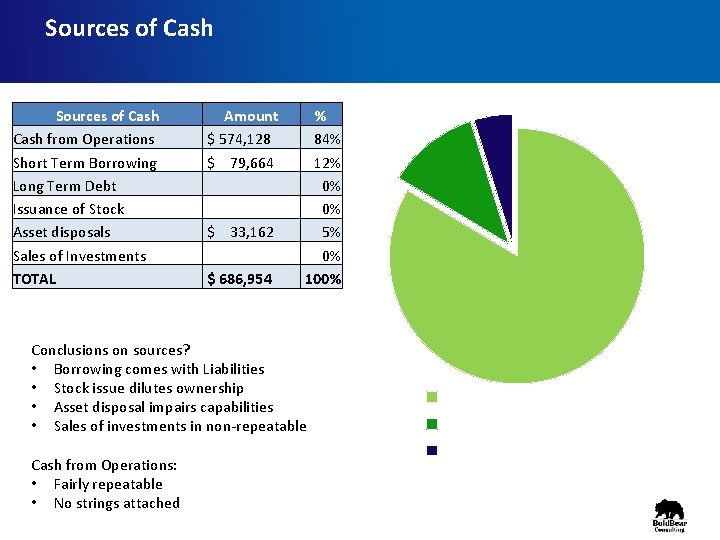
Sources of Cash from Operations Short Term Borrowing Long Term Debt Issuance of Stock Asset disposals Sales of Investments TOTAL Amount $ 574, 128 $ 79, 664 $ 33, 162 $ 686, 954 % 84% 12% 0% 0% 5% 0% 100% Conclusions on sources? • Borrowing comes with Liabilities • Stock issue dilutes ownership • Asset disposal impairs capabilities • Sales of investments in non-repeatable Cash from Operations: • Fairly repeatable • No strings attached Cash from Operations Short Term Borrowing Asset disposals
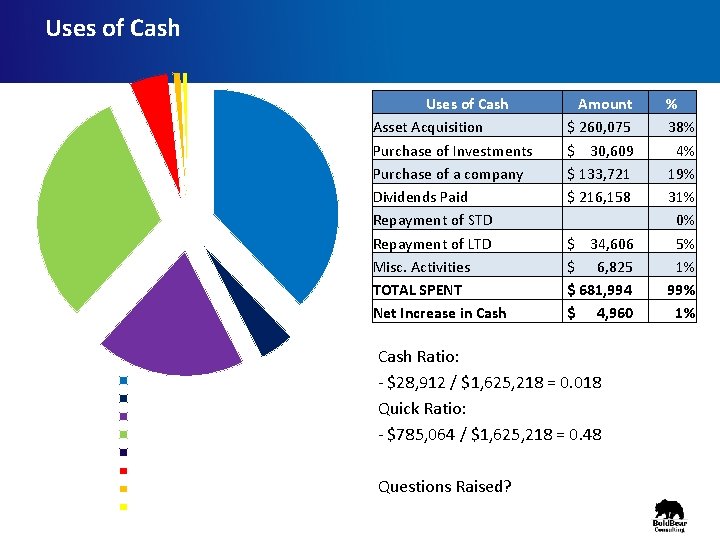
Uses of Cash Asset Acquisition Purchase of Investments Purchase of a company Dividends Paid Repayment of STD Repayment of LTD Misc. Activities TOTAL SPENT Net Increase in Cash Asset Aquision Purchase of Investments Purchase of a company Dividends Paid Repaymeny of STD Repayment of LTD Misc Sctivities Net Increase in Cash Amount $ 260, 075 $ 30, 609 $ 133, 721 $ 216, 158 $ 34, 606 $ 6, 825 $ 681, 994 $ 4, 960 Cash Ratio: - $28, 912 / $1, 625, 218 = 0. 018 Quick Ratio: - $785, 064 / $1, 625, 218 = 0. 48 Questions Raised? % 38% 4% 19% 31% 0% 5% 1% 99% 1%
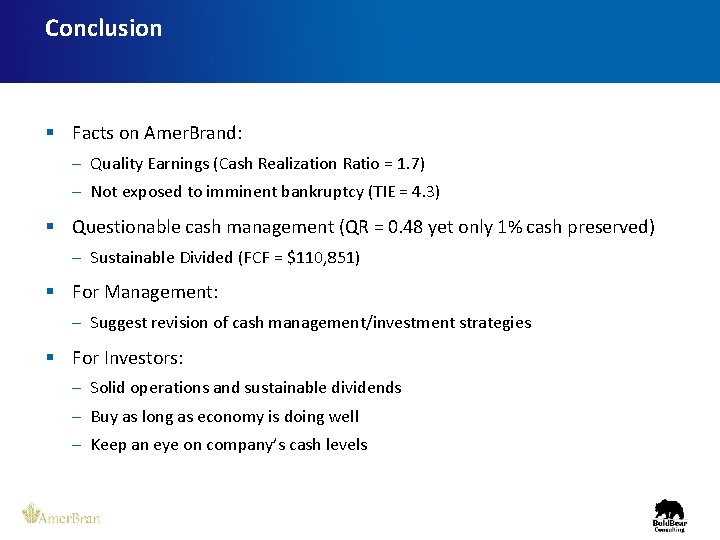
Conclusion § Facts on Amer. Brand: – Quality Earnings (Cash Realization Ratio = 1. 7) – Not exposed to imminent bankruptcy (TIE = 4. 3) § Questionable cash management (QR = 0. 48 yet only 1% cash preserved) – Sustainable Divided (FCF = $110, 851) § For Management: – Suggest revision of cash management/investment strategies § For Investors: – Solid operations and sustainable dividends – Buy as long as economy is doing well – Keep an eye on company’s cash levels



- Slides: 18