Carnegie Mellon Assignment 3 Graph Rats 3 0


 Reward Function 1. 1 1 0. 9 0.")
 ¢ ¢ Suppose node has count cl")
 ¢ For node u with population")
 300 8 83")


 Rats spread quickly within region")
 Nodes 28, 800 Edges 286, 780")
 Nodes 28, 800 Edges 171, 400")
 Nodes 28, 800 Edges 187,")

 Center (r) ~Demo 7 Diagonal (d) ~Demo 9")


 § § R rats running")


- Slides: 35
Carnegie Mellon Assignment 3: Graph. Rats 3. 0 15 -418/618 Spring 2020 1
Carnegie Mellon Topics ¢ ¢ Application Implementation Issues Optimizing for Parallel Performance Useful Advice 15 -418/618 Spring 2020 2
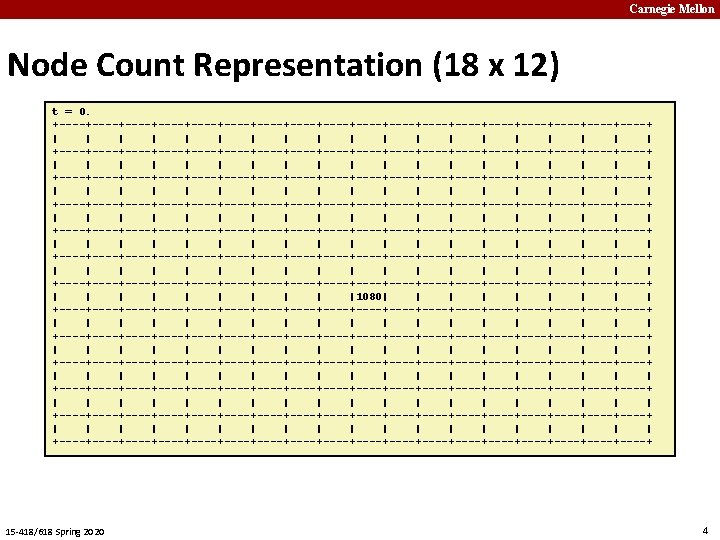
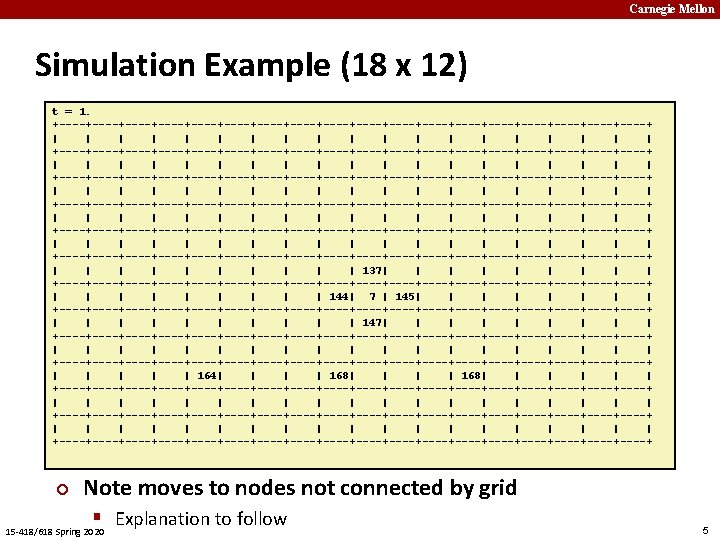
Carnegie Mellon Basic Idea ¢ t=0 ¢ § Each rat decides where to move next 0 1 2 3 4 5 6 7 8 Graph § W X H grid ¢ Initial State § Start with all R rats in center 15 -418/618 Spring 2020 Transitions Don’t like crowds § But also don’t like to be alone § Weighted random choice § t=1 0 1 2 3 4 5 6 7 8 3
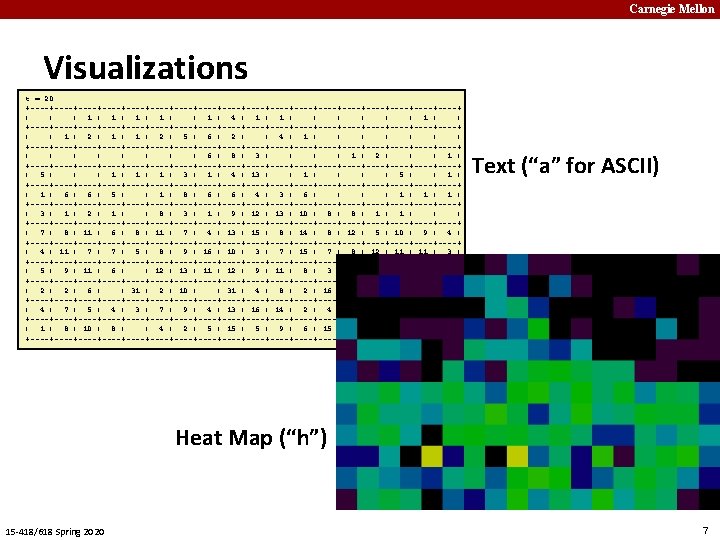
Carnegie Mellon Running it yourself linux> cd some directory linux> git clone https: //github. com/cmu 15418/asst 3 -s 20. git linux> cd asst 3 -s 20/code Linux> make demo. X X from 1 to 11 ¢ Demos § 1: Text visualization, synchronous updates § 2: Heap-map, synchronous updates 15 -418/618 Spring 2020 8
Carnegie Mellon Determining Rat Moves 300 8 83 40 120 ¢ Count number of rats at current and adjacent locations § Adjacency structure represented as graph ¢ Compute reward value for each location § Based on load factor l = count/average count § l* Ideal load factor (ILF) (varying) § �� Fitting parameter (= 0. 4) 15 -418/618 Spring 2020 9
Carnegie Mellon Reward Function 1. 2 1 0. 8 0. 6 ILF 1. 25 0. 4 0. 2 0 0 2 4 Load Factor 6 8 10 § Maximized at ILF Just above average population § Drops for smaller loads (too few) and larger loads (too crowded) § 15 -418/618 Spring 2020 10
Carnegie Mellon Reward Function (cont. ) Reward Function 1. 1 1 0. 9 0. 8 0. 7 0. 6 0. 5 0. 4 0. 3 0. 2 0. 1 0 ILF 1. 25 ILF 1. 75 ILF 2. 25 1 10 Load Factor 1000 § Falls off gradually § Reward(1000) = 0. 0132 15 -418/618 Spring 2020 11
Carnegie Mellon Computing Ideal Load Factor (ILF) ¢ ¢ Suppose node has count cl and neighbor has count cr Compute imbalance as Maximum +1 cr ≫ cl Minimum – 1 cl ≫ cr 15 -418/618 Spring 2020 12
Carnegie Mellon Computing Ideal Load Factor (cont. ) ¢ For node u with population p(u) ¢ Define ILF as ¢ Minimum 1. 25 § When adjacent nodes much less crowded ¢ Maximum 2. 25 § When adjacent nodes much more crowded ¢ Changes as rats move around 15 -418/618 Spring 2020 13
Carnegie Mellon Selecting Next Move Population Reward (avg load = 10) 300 8 83 120 0. 071 40 0. 655 0. 226 0. 545 0. 154 Weighted Choices (node followed by row-major ordering of neighbors) § Choose random number between 0 and sum of rewards § Move according to interval hit 15 -418/618 Spring 2020 14
Carnegie Mellon Update Models ¢ Synchronous § Demo 3 § Compute next positions for all rats, and then move them § Causes oscillations/instabilities ¢ Rat-order § Demo 4 § For each rat, compute its next position and then move it § Smooth transitions, but costly ¢ Batch § § Demo 5 For each batch of B rats, compute next moves and then move them B = 0. 02 * R Smooth enough, with better performance possibilities 15 -418/618 Spring 2020 15
Carnegie Mellon What We Provide ¢ Python version of simulator § Demos 1– 2 § Very slow ¢ C version of simulator § Fast sequential implementation § Demos 3– 5: 36 X 32 grid, 11, 520 rats § Demos 6– 11: 180 X 160 grid, 1, 008, 000 rats § ¢ That’s what we’ll be using for benchmarks Generate visualizations by piping C simulator output into Python simulator § Operating in visualization mode § See Makefile for examples 15 -418/618 Spring 2020 16
Carnegie Mellon Correctness ¢ Simulator is Deterministic § Global random seed § Random seeds for each rat § Process rats in fixed order ¢ You Must Preserve Exact Same Behavior § Python simulator generates same result as C simulator § Use regress. py to check Only checks small cases § Useful sanity check § Benchmark program compares your results to reference solution § Handles full-sized graphs § 15 -418/618 Spring 2020 17
Carnegie Mellon Fractal Graph frac. Z (Demos 1– 5) Rats spread quickly within region More slowly across regions Hub nodes tend to have high counts ¢ Base grid § W X H nodes, each with nearest neighbor connectivity ¢ Regions § Recursively partition rectangles into two or three subrectangles § Leaves of tree form regions ¢ Hubs § Connect to every other node in region § Each region has one or three hubs 15 -418/618 Spring 2020 18
Carnegie Mellon Benchmark Graph Uni. A (Demo 7) Nodes 28, 800 Edges 286, 780 Regions 15 Hubs 45 Max Degree 15 -418/618 Spring 2020 1, 919 19
Carnegie Mellon Benchmark Graph Uni. B (Demo 8) Nodes 28, 800 Edges 171, 400 Regions 72 Hubs 72 Max Degree 15 -418/618 Spring 2020 399 20
Carnegie Mellon Benchmark Graph Frac. C (Demos 9– 10) Nodes 28, 800 Edges 187, 612 Regions 30 Hubs 46 Max Degree 15 -418/618 Spring 2020 4, 899 21
Carnegie Mellon Benchmark Graph Frac. D Nodes 28, 800 Edges 208, 902 Regions 21 Hubs 37 Max Degree 4, 899 15 -418/618 Spring 2020 22
Carnegie Mellon Initial States (frac. Z) Center (r) ~Demo 7 Diagonal (d) ~Demo 9 Random (u) ~Demo 10 t=0 t = 20 15 -418/618 Spring 2020 23
Carnegie Mellon Graph Representation 0 1 2 4 5 6 7 8 0 neighbor Includes self edges length = N+M 15 -418/618 Spring 2020 (length = N+1) neighbor_start 0 3 N node, M edges 3 7 10 14 19 23 26 6 1 3 1 0 2 4 2 1 5 3 0 4 4 1 3 5 7 5 2 4 8 6 3 7 7 4 6 8 8 5 7 30 33 Having pointer to end is useful (why? ) 24
Carnegie Mellon Sample Code ¢ ¢ From sim. c Compute reward value for node /* Compute weight for node nid */ static inline double compute_weight(state_t *s, int nid) { int count = s->rat_count[nid]; double ilf = neighbor_ilf(s, nid); return mweight((double) count/s->load_factor, ilf); } ¢ ¢ Simulation state stored in state_t struct Reward function computed by mweight 15 -418/618 Spring 2020 25
Carnegie Mellon Sample Code ¢ ¢ From sim. c Compute reward value for all nodes static inline void compute_all_weights(state_t *s) { graph_t *g = s->g; double *node_weight = s->node_weight; int nid; for (nid = 0; nid < g->nnode; nid++) node_weight[nid] = compute_weight(s, nid); } ¢ Simulation state stored in state_t struct 15 -418/618 Spring 2020 26
Carnegie Mellon Sample Code ¢ ¢ From sim. c Compute sum of reward values for node Store cumulative value for each edge Store total sum for later reuse static inline void find_all_sums(state_t *s) { graph_t *g = s->g; int nid, eid; for (nid = 0; nid < g->nnode; nid++) { double sum = 0. 0; for (eid = g->neighbor_start[nid]; eid < g->neighbor_start[nid+1]; eid++) { sum += s->node_weight[g->neighbor[eid]]; s->neighbor_accum_weight[eid] = sum; } s->sum_weight[nid] = sum; } } 15 -418/618 Spring 2020 27
Carnegie Mellon Sample Code ¢ Compute next move for rat static inline int fast_next_random_move(state_t *s, int r) { int nid = s->rat_position[r]; graph_t *g = s->g; random_t *seedp = &s->rat_seed[r]; double tsum = s->sum_weight[nid]; double val = next_random_float(seedp, tsum); int estart = g->neighbor_start[nid]; int elen = g->neighbor_start[nid+1] - estart; /* Find location by binary search */ int offset = locate_value(val, &s->neighbor_accum_weight[estart], elen); return g->neighbor[estart + offset]; } 15 -418/618 Spring 2020 28
Carnegie Mellon Instrumented Code ¢ ¢ From sim. c Wrap major sections with instrumentation macros static inline void find_all_sums(state_t *s) { graph_t *g = s->g; START_ACTIVITY(ACTIVITY_SUMS); int nid, eid; for (nid = 0; nid < g->nnode; nid++) { double sum = 0. 0; for (eid = g->neighbor_start[nid]; eid < g->neighbor_start[nid+1]; eid++) { ¢ Simulation state stored in state_t struct sum += s->node_weight[g->neighbor[eid]]; s->neighbor_accum_weight[eid] = sum; } s->sum_weight[nid] = sum; } FINISH_ACTIVITY(ACTIVITY_SUMS); } 15 -418/618 Spring 2020 29
Carnegie Mellon Running Instrumented Code ¢ Demo 11 . /crun-seq -g data/g-180 x 160 -frac. C. gph -r data/r-180 x 160 -r 35. rats -u b -n 50 -I -q 50 steps, 1008000 rats, 13. 770 seconds 228 ms 1. 6 % startup 10677 ms 76. 3 % compute_weights 750 ms 5. 4 % compute_sums 2340 ms 16. 7 % find_moves 2 ms 0. 0 % unknown 13998 ms 100. 0 % elapsed ¢ ¢ ¢ Shows breakdown of where time spent See speedups of different parts of code Can instrument both your code & reference version 15 -418/618 Spring 2020 30
Carnegie Mellon Finding Parallelism ¢ Sequential constraints § Must complete time steps sequentially § Must complete each batch before starting next § ¢ ILF values and weights then need to be recomputed Sources of parallelism § Over nodes Computing ILFs and reward functions § Computing cumulative sums § Over rats (within a batch) § Computing next moves § Updating node counts § 15 -418/618 Spring 2020 31
Carnegie Mellon Performance Measurements ¢ Nanoseconds per move (NPM) § § R rats running for S steps Requires time T seconds NPM = 109 * T / (R * S) Reference solution: § Average 290 NPM for 1 thread § Average 44. 6 NPM for 12 threads § Speedups: – Uni. A 6. 78 – Uni. B 6. 43 – Frac. C 6. 45 – Frac. D 6. 55 § Maybe you can do better! 15 -418/618 Spring 2020 32
Carnegie Mellon Performance Targets ¢ Benchmarks § 4 combinations of graph/initial state § Each counts 16 points ¢ Target performance § T = measured time § Tr = time for reference solution § Tr / T = How well you reach reference solution performance Full credit when ≥ 0. 95 § Partial when ≥ 0. 60 § 15 -418/618 Spring 2020 33
Carnegie Mellon Machines ¢ Latedays cluster § § § ¢ 16 worker nodes + 1 head node Each is 12 -core Xeon processor (dual socket with 6 cores each) You submit jobs to batch queue Assigned single processor for entire run Python script provided Code Development § § OK to do code development and testing on other machines But, they have different performance characteristics Max threads on GHC cluster = 8 Code should run for any number of threads (up to machine limit) 15 -418/618 Spring 2020 34
Carnegie Mellon Some Logos 15 -418/618 Spring 2020 35