Cari COF Climate Outlook JuneJulyAugust 2016 and SeptemberOctoberNovember

Cari. COF Climate Outlook June-July-August 2016 and September-October-November 2016 Coordination – CIMH – Dr. Cédric J. Van Meerbeeck caricof@cimh. edu. bb Participating territories Antigua & Barbuda, Aruba, Bahamas, Barbados, Belize, Cayman Islands, Cuba, Curaçao, Dominican Republic, French Guiana, Grenada, Guadeloupe, Guyana, Haïti, Jamaica, Martinique, Puerto Rico, St. Barth’s, St. Kitts & Nevis, St. Lucia, St. Maarten/St. Martin, St. Vincent & the Grenadines, Suriname, Trinidad & Tobago and the US Virgin Islands

Regional Climate Outlook Forums Cari. COF - FCAC Cari. COF FCAC 2

RAINFALL caricof@cimh. edu. bb
 caricof@cimh. edu. bb")
JJA RAINFALL O MONTH LEAD (ML) caricof@cimh. edu. bb

CPT probabilistic JJA rainfall forecast CCA experiments: 1. 2. 3. 4. 5. 6. 7. Predictor is observed SST over the tropical Atlantic and Pacific over Apr (data source: NOAA ERSSTv 3 b, obtained from the IRI data library). Predictor is observed SST over the tropical North Atlantic over Apr Predictor is predicted SST over the tropical Atlantic and Pacific over JJA data source: NOAA CPC CFSv 2 , May initialisation). Predictor is predicted SST over the tropical North Atlantic over JJA Predictor is predicted rainfall totals over the Caribbean over JJA (data source: ECHAM 4. 5 ensemble 24, obtained from the IRI data library). Predictor is predicted SST over the tropical Atlantic and Pacific over JJA (data source: NOAA CPC NMME , May initialisation). Predictor is predicted SST over the tropical North Atlantic over JJA Besides the major control of ENSO (here represented by Pacific tropical SST anomalies) and tropical north Atlantic SSTs on Caribbean rainfall variability, these experiments take the contrast between Pacific and Caribbean/tropical N Atlantic SSTs into account, as those factors are regarded as the most important drivers of rainfall throughout the Caribbean. caricof@cimh. edu. bb

CPT probabilistic JJA Rainfall forecast Maximum Optimum No. of Stations Missing Y data Goodness Index CCA modes: 5 CCA modes: 3 Initial : 468 Values : 20 Index : 0. 221 140 E-20 W & 30 N-20 S X modes : 8 X modes : 5 Used : 430 Stations : 10 Moderate ERSSTv 3 b Y modes : 8 Experiment 2 CCA modes: 5 CCA modes: 4 Initial : 468 Values : 20 Index : 0. 201 90 -20 W & 30 -0 N X modes : 8 X modes : 6 Used : 430 Stations : 10 Moderate ERSSTv 3 b Y modes : 8 Y modes : 6 Experiment 3 CCA modes: 5 CCA modes: 2 Initial : 468 Values : 20 Index : 0. 305 140 E-20 W & 30 N-20 S X modes : 8 Used : 429 Stations : 10 Good CFSv 2 Y modes : 8 Y modes : 2 Experiment 4 CCA modes: 5 CCA modes: 2 Initial : 468 Values : 20 Index : 0. 285 90 -20 W & 30 -0 N X modes : 8 Used : 429 Stations : 10 Fair caricof@cimh. edu. bb Experiment 1

CPT probabilistic JJA Rainfall forecast Maximum Optimum No. of Stations Missing Y data Goodness Index Experiment 5 CCA modes: 3 CCA modes: 2 Initial : 468 Values : 20 Index : 0. 241 100 -40 W & 35 N-5 S X modes : 5 Used : 430 Stations : 10 Moderate ECHAM 4. 5 Y modes : 2 Experiment 6 CCA modes: 5 CCA modes: 2 Initial : 468 Values : 20 Index : 0. 268 140 E-20 W & 30 N-20 S X modes : 8 X modes : 7 Used : 429 Stations : 10 Fair NMME Y modes : 8 Y modes : 2 Experiment 7 CCA modes: 5 CCA modes: 2 Initial : 468 Values : 20 Index : 0. 278 90 -20 W & 30 -0 N X modes : 8 X modes : 6 Used : 429 Stations : 10 Fair NMME Y modes : 8 Y modes : 2 caricof@cimh. edu. bb
 caricof@cimh. edu. bb")
SON RAINFALL 3 MONTH LEAD (ML) caricof@cimh. edu. bb

CPT probabilistic SON rainfall forecast CCA experiments: 1. 2. 3. 4. 5. 6. 7. Predictor is observed SST over the tropical Atlantic and Pacific over Apr (data source: NOAA ERSSTv 3 b, obtained from the IRI data library). Predictor is observed SST over the tropical North Atlantic over Apr Predictor is predicted SST over the tropical Atlantic and Pacific over SON (data source: NOAA CPC CFSv 2 , May initialisation). Predictor is predicted SST over the tropical North Atlantic over SON Predictor is predicted rainfall totals over the Caribbean over SON (data source: ECHAM 4. 5 ensemble 24, obtained from the IRI data library). Predictor is predicted SST over the tropical Atlantic and Pacific over SON (data source: NOAA CPC NMME, May initialisation). Predictor is predicted SST over the tropical North Atlantic over SON caricof@cimh. edu. bb

CPT probabilistic SON Rainfall forecast Maximum Optimum No. of Stations Missing Y data Goodness Index CCA modes: 5 CCA modes: 2 Initial : 468 Values : 20 Index : 0. 130 140 E-20 W & 30 N-20 S X modes : 8 X modes : 5 Used : 435 Stations : 10 !Limited! ERSSTv 3 b Y modes : 8 Y modes : 4 Experiment 2 CCA modes: 5 CCA modes: 3 Initial : 468 Values : 20 Index : 0. 129 90 -20 W & 30 -0 N X modes : 8 X modes : 5 Used : 435 Stations : 10 !Limited! ERSSTv 3 b Y modes : 8 Experiment 3 CCA modes: 5 CCA modes: 2 Initial : 468 Values : 20 Index : 0. 181 140 E-20 W & 30 N-20 S X modes : 8 X modes : 4 Used : 432 Stations : 10 !Limited! CFSv 2 Y modes : 8 Y modes : 3 Experiment 4 CCA modes: 5 CCA modes: 3 Initial : 468 Values : 20 Index : 0. 176 90 -20 W & 30 -0 N X modes : 8 X modes : 6 Used : 432 Stations : 10 !Limited! Experiment 1 caricof@cimh. edu. bb

CPT probabilistic SON Rainfall forecast Maximum Optimum No. of Stations Missing Y data Goodness Index Experiment 5 CCA modes: 3 CCA modes: 2 Initial : 468 Values : 20 Index : 0. 241 100 -40 W & 35 N-5 S X modes : 5 Used : 430 Stations : 10 Moderate ECHAM 4. 5 Y modes : 2 Experiment 6 CCA modes: 5 CCA modes: 3 Initial : 468 Values : 20 Index : 0. 197 140 E-20 W & 30 N-20 S X modes : 8 X modes : 3 Used : 432 Stations : 10 !Limited! NMME Y modes : 8 Y modes : 3 Experiment 7 CCA modes: 5 CCA modes: 4 Initial : 468 Values : 20 Index : 0. 187 90 -20 W & 30 -0 N X modes : 8 Used : 432 Stations : 10 !Limited! NMME Y modes : 8 Y modes : 4 caricof@cimh. edu. bb
 June-July-August 2016")
Cari. COF Objective Rainfall Outlook for the Caribbean (National + Regional Ensemble) June-July-August 2016 caricof@cimh. edu. bb
 September-October-November 2016")
Cari. COF Objective Rainfall Outlook for the Caribbean (National + Regional Ensemble) September-October-November 2016 caricof@cimh. edu. bb

PRECIPITATION OUTLOOKS caricof@cimh. edu. bb
: 1) IRI multi-model probability forecast")
Supporting probabilistic precipitation forecasts Nine data sources (incl. GPCs): 1) IRI multi-model probability forecast (only multi-model forecast that recalibrates & weights the models based on past performance); 2) UK Met Office GCM (UKMO) probability forecast; 3) European Center for Mid-range Weather Forecast GCM (ECMWF) and EUROSIP (multi-model) probability forecasts; 4) APEC Climate Center (APCC) multi=model probability forecasts; 5) WMO Lead Centre for LRF – MME. 6) CFSv 2 model 7) Météo. France Arpège model. 8) JMA model 9) Environment Canada CMC model Rainfall outlooks are generated next to T 2 m outlooks (see Appendix). Rainfall tendencies from supporting models and local expertise: 1) El Niño peaked in November 2015 and has weakened to a moderate state by the end of April (Niño 3. 4 SST anom. ~1. 1°C). Most models suggest a rapidly weakening El Niño, likely disappearing by MJJ 2016, with an estimated overall confidence of ENSO neutral conditions being 55 -75% for MJJ. It is expected that either neutral or La Niña conditions will prevail during ASO, with 50 -65% probability for La Niña, versus 30 -40% for neutral. Tropical North Atlantic SSTs tend to be warmer than average after an El Niño, and are currently above average to the north of the Caribbean Islands. However, SSTs in the southern Caribbean Sea and eastwards in the North Atlantic are near-average due to stronger than average trade winds, but are expected to warm somewhat into MJJ. A cold SST anomaly will likely develop around the equatorial east Atlantic during the MJJ period. 2) Warm SSTs north and east of the islands may lead to above-average humidity for MJJ and ASO throughout the region. However, perhaps because of the cooling further out in the Atlantic around the equator and west of Africa during MJJ, a pattern of drier air may be observed to reach into the Eastern Caribbean towards July. 3) Global models are in disagreement as to the expected rainfall during MJJ and ASO, with the exception of the Guianas, which tend to retain a shift to below-normal rainfall in most models.

Probabilistic JJA rainfall forecast map caricof@cimh. edu. bb

Probabilistic SON rainfall forecast map caricof@cimh. edu. bb

2 M MEAN TEMPERATURE caricof@cimh. edu. bb
 caricof@cimh. edu. bb")
JJA TEMPERATURE O MONTH LEAD (ML) caricof@cimh. edu. bb

CPT probabilistic JJA 2 m Temperature forecast CCA experiments: 1. 2. 3. 4. 5. 6. 7. Predictor is observed SST over the tropical Atlantic and Pacific over Apr (data source: NOAA ERSSTv 3 b, obtained from the IRI data library). Predictor is observed SST over the tropical North Atlantic over Apr Predictor is predicted SST over the tropical Atlantic and Pacific over JJA (data source: NOAA CPC CFSv 2 , May initialisation). Predictor is predicted SST over the tropical North Atlantic over JJA Predictor is predicted T 2 m over the Caribbean over JJA (data source: ECHAM 4. 5 ensemble 24, obtained from the IRI data library). Predictor is predicted SST over the tropical Atlantic and Pacific over JJA (data source: NOAA CPC NMME , May initialisation). Predictor is predicted SST over the tropical North Atlantic over JJA caricof@cimh. edu. bb

CPT probabilistic JJA 2 m Temperature forecast Maximum Optimum No. of Stations Missing Y data Goodness Index CCA modes: 5 CCA modes: 4 Initial : 74 Values : 20 Index : 0. 230 140 E-20 W & 30 N-20 S X modes : 8 Used : 52 Stations : 10 Moderate ERSSTv 3 b Y modes : 8 Y modes : 7 Experiment 2 CCA modes: 5 CCA modes: 3 Initial : 74 Values : 20 Index : 0. 183 90 -20 W & 30 -0 N X modes : 8 Used : 52 Stations : 10 !Limited! ERSSTv 3 b Y modes : 8 Y modes : 4 Experiment 3 CCA modes: 5 CCA modes: 3 Initial : 74 Values : 20 Index : 0. 258 140 E-20 W & 30 N-20 S X modes : 8 X modes : 3 Used : 51 Stations : 10 Fair CFSv 2 Y modes : 8 Y modes : 7 Experiment 4 CCA modes: 5 CCA modes: 3 Initial : 74 Values : 20 Index : 0. 216 90 -20 W & 30 -0 N X modes : 8 X modes : 4 Used : 51 Stations : 10 Moderate CFSv 2 Y modes : 8 Y modes : 4 Experiment 1 caricof@cimh. edu. bb

CPT probabilistic JJA 2 m Temperature forecast Maximum Optimum No. of Stations Missing Y data Goodness Index Experiment 5 CCA modes: 3 CCA modes: 2 Initial : 74 Values : 20 Index : 0. 140 100 -40 W & 35 N-5 S X modes : 5 X modes : 2 Used : 52 Stations : 10 !Limited! ECHAM 4. 5 Y modes : 5 Experiment 6 CCA modes: 5 CCA modes: 2 Initial : 74 Values : 20 Index : 0. 240 140 E-20 W & 30 N-20 S X modes : 8 X modes : 7 Used : 51 Stations : 10 Moderate NMME Y modes : 8 Y modes : 2 Experiment 7 CCA modes: 5 CCA modes: 3 Initial : 74 Values : 20 Index : 0. 242 90 -20 W & 30 -0 N X modes : 8 Used : 51 Stations : 10 Moderate NMME Y modes : 8 Y modes : 4 caricof@cimh. edu. bb
 caricof@cimh. edu. bb")
SON TEMPERATURE 3 MONTH LEAD (ML) caricof@cimh. edu. bb

CPT probabilistic SON 2 m Temperature forecast CCA experiments: 1. 2. 3. 4. 5. 6. 7. Predictor is observed SST over the tropical Atlantic and Pacific over Apr (data source: NOAA ERSSTv 3 b, obtained from the IRI data library). Predictor is observed SST over the tropical North Atlantic over Apr Predictor is predicted SST over the tropical Atlantic and Pacific over SON (data source: NOAA CPC CFSv 2 , May initialisation). Predictor is predicted SST over the tropical North Atlantic over SON Predictor is predicted T 2 m over the Caribbean over SON (data source: ECHAM 4. 5 ensemble 24, obtained from the IRI data library). Predictor is predicted SST over the tropical Atlantic and Pacific over SON (data source: NOAA CPC NMME , May initialisation). Predictor is predicted SST over the tropical North Atlantic over SON caricof@cimh. edu. bb

CPT probabilistic SON 2 m Temperature forecast Maximum Optimum No. of Stations Missing Y data Goodness Index CCA modes: 5 CCA modes: 2 Initial : 74 Values : 20 Index : 0. 160 140 E-20 W & 30 N-20 S X modes : 8 X modes : 7 Used : 50 Stations : 10 !Limited! ERSSTv 3 b Y modes : 8 Y modes : 7 Experiment 2 CCA modes: 5 CCA modes: 1 Initial : 74 Values : 20 Index : 0. 091 90 -20 W & 30 -0 N X modes : 8 Used : 50 Stations : 10 !Very Limited! ERSSTv 3 b Y modes : 8 Y modes : 4 Experiment 3 CCA modes: 5 CCA modes: 2 Initial : 74 Values : 20 Index : 0. 190 140 E-20 W & 30 N-20 S X modes : 8 X modes : 2 Used : 49 Stations : 10 !Limited! CFSv 2 Y modes : 8 Y modes : 2 Experiment 4 CCA modes: 5 CCA modes: 2 Initial : 74 Values : 20 Index : 0. 183 90 -20 W & 30 -0 N X modes : 8 Used : 49 Stations : 10 !Limited! CFSv 2 Y modes : 8 Experiment 1 caricof@cimh. edu. bb

CPT probabilistic ASO 2 m Temperature forecast Maximum Optimum No. of Stations Missing Y data Goodness Index Experiment 5 CCA modes: 3 CCA modes: 2 Initial : 74 Values : 20 Index : 0. 140 100 -40 W & 35 N-5 S X modes : 5 X modes : 2 Used : 52 Stations : 10 !Limited! ECHAM 4. 5 Y modes : 5 Experiment 6 CCA modes: 5 CCA modes: 4 Initial : 74 Values : 20 Index : 0. 238 140 E-20 W & 30 N-20 S X modes : 8 Used : 49 Stations : 10 Moderate NMME Y modes : 8 Y modes : 7 Experiment 7 CCA modes: 5 CCA modes: 2 Initial : 74 Values : 20 Index : 0. 230 90 -20 W & 30 -0 N X modes : 8 X modes : 5 Used : 49 Stations : 10 Fair NMME Y modes : 8 Y modes : 3 caricof@cimh. edu. bb

Cari. COF Objective Mean T 2 m outlook for the Caribbean (National + Regional Ensemble) June-July-August 2016 caricof@cimh. edu. bb

Cari. COF Objective Mean T 2 m outlook for the Caribbean (National + Regional Ensemble) September-October-November 2016 caricof@cimh. edu. bb

TEMPERATURE OUTLOOKS caricof@cimh. edu. bb

Probabilistic JJA 2 m Temperature forecast map caricof@cimh. edu. bb

Probabilistic SON 2 m Temperature forecast map caricof@cimh. edu. bb

MAXIMUM AND MINIMUM 2 M TEMPERATURE caricof@cimh. edu. bb
 caricof@cimh. edu. bb")
JJA MAX. TEMPERATURE O MONTH LEAD (ML) caricof@cimh. edu. bb

CPT probabilistic JJA 2 m Max. Temperature forecast CCA experiments: 1. 2. 3. 4. 5. 6. 7. Predictor is observed SST over the tropical Atlantic and Pacific over Apr (data source: NOAA ERSSTv 3 b, obtained from the IRI data library). Predictor is observed SST over the tropical North Atlantic over Apr Predictor is predicted SST over the tropical Atlantic and Pacific over JJA (data source: NOAA CPC CFSv 2 , May initialisation). Predictor is predicted SST over the tropical North Atlantic over JJA Predictor is predicted T 2 m over the Caribbean over JJA (data source: ECHAM 4. 5 ensemble 24, obtained from the IRI data library). Predictor is predicted SST over the tropical Atlantic and Pacific over JJA (data source: NOAA CPC NMME , May initialisation). Predictor is predicted SST over the tropical North Atlantic over JJA caricof@cimh. edu. bb

CPT probabilistic JJA 2 m Max. Temperature forecast Maximum Optimum No. of Stations Missing Y data Goodness Index CCA modes: 5 Initial : 51 Values : 20 Index : 0. 224 140 E-20 W & 30 N-20 S X modes : 8 X modes : 6 Used : 39 Stations : 10 Moderate ERSSTv 3 b Y modes : 8 Y modes : 7 Experiment 2 CCA modes: 5 Initial : 51 Values : 20 Index : 0. 194 90 -20 W & 30 -0 N X modes : 8 X modes : 6 Used : 39 Stations : 10 !Limited! ERSSTv 3 b Y modes : 8 Y modes : 5 Experiment 3 CCA modes: 5 CCA modes: 4 Initial : 51 Values : 20 Index : 0. 230 140 E-20 W & 30 N-20 S X modes : 8 X modes : 4 Used : 39 Stations : 10 Moderate CFSv 2 Y modes : 8 Y modes : 4 Experiment 4 CCA modes: 5 CCA modes: 4 Initial : 51 Values : 20 Index : 0. 208 90 -20 W & 30 -0 N X modes : 8 X modes : 6 Used : 39 Stations : 10 Moderate CFSv 2 Y modes : 8 Y modes : 4 Experiment 1 caricof@cimh. edu. bb

CPT probabilistic JJA 2 m Max. Temperature forecast Maximum Optimum No. of Stations Missing Y data Goodness Index Experiment 5 CCA modes: 3 CCA modes: 2 Initial : 51 Values : 20 Index : 0. 130 100 -40 W & 35 N-5 S X modes : 5 X modes : 2 Used : 39 Stations : 10 !Limited! ECHAM 4. 5 Y modes : 5 Experiment 6 CCA modes: 5 CCA modes: 4 Initial : 51 Values : 20 Index : 0. 214 140 E-20 W & 30 N-20 S X modes : 8 X modes : 7 Used : 39 Stations : 10 Moderate NMME Y modes : 8 Y modes : 5 Experiment 7 CCA modes: 5 Initial : 51 Values : 20 Index : 0. 204 90 -20 W & 30 -0 N X modes : 8 Used : 39 Stations : 10 Moderate NMME Y modes : 8 Y modes : 5 caricof@cimh. edu. bb
 caricof@cimh. edu. bb")
SON MAX. TEMPERATURE 3 MONTH LEAD (ML) caricof@cimh. edu. bb

CPT probabilistic SON 2 m Max. Temperature forecast CCA experiments: 1. 2. 3. 4. 5. 6. 7. Predictor is observed SST over the tropical Atlantic and Pacific over Apr (data source: NOAA ERSSTv 3 b, obtained from the IRI data library). Predictor is observed SST over the tropical North Atlantic over Apr Predictor is predicted SST over the tropical Atlantic and Pacific over SON (data source: NOAA CPC CFSv 2 , May initialisation). Predictor is predicted SST over the tropical North Atlantic over SON Predictor is predicted T 2 m over the Caribbean over SON (data source: ECHAM 4. 5 ensemble 24, obtained from the IRI data library). Predictor is predicted SST over the tropical Atlantic and Pacific over SON (data source: NOAA CPC NMME , May initialisation). Predictor is predicted SST over the tropical North Atlantic over SON caricof@cimh. edu. bb

CPT probabilistic SON 2 m Max. Temperature forecast Maximum Optimum No. of Stations Missing Y data Goodness Index CCA modes: 5 CCA modes: 2 Initial : 51 Values : 20 Index : 0. 175 140 E-20 W & 30 N-20 S X modes : 8 Used : 39 Stations : 10 !Limited! ERSSTv 3 b Y modes : 8 Y modes : 2 Experiment 2 CCA modes: 5 Initial : 51 Values : 20 Index : 0. 086 90 -20 W & 30 -0 N X modes : 8 X modes : 7 Used : 39 Stations : 10 !!Very Limited!! ERSSTv 3 b Y modes : 8 Experiment 3 CCA modes: 5 CCA modes: 2 Initial : 51 Values : 20 Index : 0. 211 140 E-20 W & 30 N-20 S X modes : 8 X modes : 4 Used : 39 Stations : 10 Moderate CFSv 2 Y modes : 8 Y modes : 7 Experiment 4 CCA modes: 5 CCA modes: 4 Initial : 51 Values : 20 Index : 0. 176 90 -20 W & 30 -0 N X modes : 8 Used : 38 Stations : 10 !Limited! CFSv 2 Y modes : 8 Experiment 1 caricof@cimh. edu. bb

CPT probabilistic SON 2 m Max. Temperature forecast Maximum Optimum No. of Stations Missing Y data Goodness Index Experiment 5 CCA modes: 3 CCA modes: 2 Initial : 51 Values : 20 Index : 0. 130 100 -40 W & 35 N-5 S X modes : 5 X modes : 2 Used : 39 Stations : 10 !Limited! ECHAM 4. 5 Y modes : 5 Experiment 6 CCA modes: 5 CCA modes: 2 Initial : 51 Values : 20 Index : 0. 275 140 E-20 W & 30 N-20 S X modes : 8 X modes : 5 Used : 38 Stations : 10 Fair NMME Y modes : 8 Y modes : 6 Experiment 7 CCA modes: 5 CCA modes: 4 Initial : 51 Values : 20 Index : 0. 225 90 -20 W & 30 -0 N X modes : 8 X modes : 5 Used : 38 Stations : 10 Moderate NMME Y modes : 8 Y modes : 7 caricof@cimh. edu. bb

Cari. COF Objective Maximum T 2 m outlook for the Caribbean (National + Regional Ensemble) June-July-August 2016 caricof@cimh. edu. bb

Cari. COF Objective Maximum T 2 m outlook for the Caribbean (National + Regional Ensemble) September-October-November 2016 caricof@cimh. edu. bb

Probabilistic JJA 2 m Maximum Temperature forecast map caricof@cimh. edu. bb

Probabilistic SON 2 m Maximum Temperature forecast map caricof@cimh. edu. bb
 caricof@cimh. edu. bb")
JJA MIN. TEMPERATURE O MONTH LEAD (ML) caricof@cimh. edu. bb

CPT probabilistic JJA 2 m Min. Temperature forecast CCA experiments: 1. 2. 3. 4. 5. 6. 7. Predictor is observed SST over the tropical Atlantic and Pacific over Apr (data source: NOAA ERSSTv 3 b, obtained from the IRI data library). Predictor is observed SST over the tropical North Atlantic over Apr Predictor is predicted SST over the tropical Atlantic and Pacific over JJA (data source: NOAA CPC CFSv 2 , May initialisation). Predictor is predicted SST over the tropical North Atlantic over JJA Predictor is predicted T 2 m over the Caribbean over JJA (data source: ECHAM 4. 5 ensemble 24, obtained from the IRI data library). Predictor is predicted SST over the tropical Atlantic and Pacific over JJA (data source: NOAA CPC NMME , May initialisation). Predictor is predicted SST over the tropical North Atlantic over JJA caricof@cimh. edu. bb

CPT probabilistic JJA 2 m Min. Temperature forecast Maximum Optimum No. of Stations Missing Y data Goodness Index CCA modes: 5 CCA modes: 4 Initial : 51 Values : 20 Index : 0. 150 140 E-20 W & 30 N-20 S X modes : 8 X modes : 5 Used : 40 Stations : 10 !Limited! ERSSTv 3 b Y modes : 8 Y modes : 4 Experiment 2 CCA modes: 5 Initial : 51 Values : 20 Index : 0. 147 90 -20 W & 30 -0 N X modes : 8 X modes : 7 Used : 40 Stations : 10 !Limited! ERSSTv 3 b Y modes : 8 Y modes : 6 Experiment 3 CCA modes: 5 CCA modes: 3 Initial : 51 Values : 20 Index : 0. 194 140 E-20 W & 30 N-20 S X modes : 8 X modes : 4 Used : 40 Stations : 10 !Limited! CFSv 2 Y modes : 8 Experiment 4 CCA modes: 5 Initial : 51 Values : 20 Index : 0. 164 90 -20 W & 30 -0 N X modes : 8 X modes : 7 Used : 40 Stations : 10 !Limited! CFSv 2 Y modes : 8 Experiment 1 caricof@cimh. edu. bb

CPT probabilistic JJA 2 m Min. Temperature forecast Maximum Optimum No. of Stations Missing Y data Goodness Index Experiment 5 CCA modes: 3 CCA modes: 2 Initial : 51 Values : 20 Index : 0. 075 100 -40 W & 35 N-5 S X modes : 5 X modes : 4 Used : 40 Stations : 10 !!Very Limited!! ECHAM 4. 5 Y modes : 5 Experiment 6 CCA modes: 5 CCA modes: 2 Initial : 51 Values : 20 Index : 0. 195 140 E-20 W & 30 N-20 S X modes : 8 X modes : 4 Used : 39 Stations : 10 !Limited! NMME Y modes : 8 Experiment 7 CCA modes: 5 CCA modes: 2 Initial : 51 Values : 20 Index : 0. 185 90 -20 W & 30 -0 N X modes : 8 X modes : 7 Used : 40 Stations : 10 !Limited! NMME Y modes : 8 Y modes : 2 caricof@cimh. edu. bb
 caricof@cimh. edu. bb")
SON MIN. TEMPERATURE 3 MONTH LEAD (ML) caricof@cimh. edu. bb

CPT probabilistic SON 2 m Min. Temperature forecast CCA experiments: 1. 2. 3. 4. 5. 6. 7. Predictor is observed SST over the tropical Atlantic and Pacific over Apr (data source: NOAA ERSSTv 3 b, obtained from the IRI data library). Predictor is observed SST over the tropical North Atlantic over Apr Predictor is predicted SST over the tropical Atlantic and Pacific over SON (data source: NOAA CPC CFSv 2 , May initialisation). Predictor is predicted SST over the tropical North Atlantic over SON Predictor is predicted T 2 m over the Caribbean over SON (data source: ECHAM 4. 5 ensemble 24, obtained from the IRI data library). Predictor is predicted SST over the tropical Atlantic and Pacific over SON (data source: NOAA CPC NMME , May initialisation). Predictor is predicted SST over the tropical North Atlantic over SON caricof@cimh. edu. bb

CPT probabilistic SON 2 m Min. Temperature forecast Maximum Optimum No. of Stations Missing Y data Goodness Index CCA modes: 5 CCA modes: 4 Initial : 51 Values : 20 Index : 0. 038 140 E-20 W & 30 N-20 S X modes : 8 Used : 41 Stations : 10 !Very Limited! ERSSTv 3 b Y modes : 8 Y modes : 5 Experiment 2 CCA modes: 5 CCA modes: 2 Initial : 51 Values : 20 Index : 0. 004 90 -20 W & 30 -0 N X modes : 8 Used : 41 Stations : 10 !Very Limited! ERSSTv 3 b Y modes : 8 Y modes : 4 Experiment 3 CCA modes: 5 CCA modes: 2 Initial : 51 Values : 20 Index : 0. 038 140 E-20 W & 30 N-20 S X modes : 8 X modes : 3 Used : 39 Stations : 10 !Very Limited! CFSv 2 Y modes : 8 Y modes : 6 Experiment 4 CCA modes: 5 Initial : 51 Values : 20 Index : 0. 062 90 -20 W & 30 -0 N X modes : 8 X modes : 5 Used : 39 Stations : 10 !Very Limited! CFSv 2 Y modes : 8 Y modes : 6 Experiment 1 caricof@cimh. edu. bb

CPT probabilistic SON 2 m Min. Temperature forecast Maximum Optimum No. of Stations Missing Y data Goodness Index Experiment 5 CCA modes: 3 CCA modes: 2 Initial : 51 Values : 20 Index : 0. 075 100 -40 W & 35 N-5 S X modes : 5 X modes : 4 Used : 40 Stations : 10 !Very Limited! ECHAM 4. 5 Y modes : 5 Experiment 6 CCA modes: 5 CCA modes: 4 Initial : 51 Values : 20 Index : 0. 142 140 E-20 W & 30 N-20 S X modes : 8 Used : 39 Stations : 10 !Limited! NMME Y modes : 8 Y modes : 7 Experiment 7 CCA modes: 5 CCA modes: 2 Initial : 51 Values : 20 Index : 0. 118 90 -20 W & 30 -0 N X modes : 8 X modes : 4 Used : 39 Stations : 10 !Limited! NMME Y modes : 8 Y modes : 3 caricof@cimh. edu. bb

Cari. COF Objective Minimum T 2 m outlook for the Caribbean (National + Regional Ensemble) June-July-August 2016 caricof@cimh. edu. bb

Cari. COF Objective Minimum T 2 m outlook for the Caribbean (National + Regional Ensemble) September-October-November 2016 caricof@cimh. edu. bb

Probabilistic JJA 2 m Minimum Temperature forecast map caricof@cimh. edu. bb

Probabilistic SON 2 m Minimum Temperature forecast map caricof@cimh. edu. bb

DROUGHT OUTLOOK caricof@cimh. edu. bb

DROUGHT OUTLOOK MAMJJA caricof@cimh. edu. bb

CPT probabilistic MAMJJA CCA experiments: 1. 2. 3. Predictor is observed SST over the tropical Atlantic and Pacific over Apr (data source: NOAA ERSSTv 3 b, obtained from the IRI data library). Predictor is observed SST over the tropical North Atlantic over Apr Predictor is predicted rainfall totals over the Caribbean over MJJA (data source: ECHAM 4. 5 ensemble 24, obtained from the IRI data library). caricof@cimh. edu. bb

CPT probabilistic MAMJja Drought forecast Maximum Optimum No. of Stations Missing Y data Goodness Index Experiment 1 CCA modes: 5 CCA modes: 2 Initial : 468 Values : 20 Index : 0. 234 140 E-20 W & 30 N-20 S X modes : 8 Used : 432 Stations : 10 Moderate ERSSTv 3 b Y modes : 8 Y modes : 2 Experiment 2 CCA modes: 5 CCA modes: 2 Initial : 468 Values : 20 Index : 0. 179 90 -20 W & 30 -0 N X modes : 8 X modes : 5 Used : 432 Stations : 10 ! Limited ! ERSSTv 3 b Y modes : 8 Y modes : 2 Experiment 3 CCA modes: 2 Initial : 468 Values : 20 Index : 0. 238 100 -40 W & 35 N-5 S X modes : 5 Used : 432 Stations : 10 Moderate ECHAM 4. 5 Y modes : 2 caricof@cimh. edu. bb

DROUGHT OUTLOOK DJFMAMJJASON 2015 -16 caricof@cimh. edu. bb

CPT probabilistic DJFMAMJJASON CCA experiments: 1. Predictor is observed SST over the tropical Atlantic and Pacific over Apr (data source: NOAA ERSSTv 3 b, obtained from the IRI data library). caricof@cimh. edu. bb

CPT probabilistic DJFMAMJJASON Drought forecast Maximum Optimum No. of Stations Missing Y data Goodness Index Experiment 1 CCA modes: 5 CCA modes: 4 Initial : 468 Values : 20 Index : 0. 236 140 E-20 W & 30 N-20 S X modes : 8 Used : 404 Stations : 10 Moderate ERSSTv 3 b Y modes : 8 Y modes : 5 caricof@cimh. edu. bb

Cari. COF Drought Outlook By the end of August 2016 Coordination – CIMH – Dr. Cédric J. Van Meerbeeck caricof@cimh. edu. bb Participating territories Antigua & Barbuda, Aruba, Bahamas, Barbados, Belize, Cayman Islands, Cuba, Curaçao, Dominican Republic, French Guiana, Grenada, Guadeloupe, Guyana, Haïti, Jamaica, Martinique, Puerto Rico, St. Barth’s, St. Kitts & Nevis, St. Lucia, St. Maarten/St. Martin, St. Vincent & the Grenadines, Suriname, Trinidad & Tobago and the US Virgin Islands

Drought Outlook March to August Areas under immediate drought concern? Current Outlook Current update (May 2016): May 2016 Drought concern has lifted for the region but remains for southern Haïti and west-central Belize. caricof@cimh. edu. bb Previous Outlook

Drought outlook – Drought outlook shorter-/longer-term concern? • Current drought situation (up to the end of April 2016): (more information here) – After below-normal rainfall during 2015 resulting in long-term drought, water shortages persisted throughout the first 4 months of 2016 in many portions of the Antilles. – Nearly all island nations of the Lesser Antilles are in longer-term drought. – After a failure of the secondary wet season in the Guianas, short-term drought was alleviated in coastal areas by heavy rains in March, but persisted in the south-western areas of Guyana. • Shorter-term drought situation (till August 2016): – We expect that a shorter-term drought situation may develop in west-central Belize and southern Haïti • Longer-term drought situation (until November 2016): – El Niño peaked in strength last November and has rapidly weakened since then. The El Niño resulted in a drier early part of the year in the Lesser Antilles and a failure of the secondary wet season in the northern Guianas. This has led to drought concerns carrying through to the end of the Caribbean dry season (i. e. May 31), except in coastal areas of the Guianas. – In the islands, the wet season is expected to bring longer-term drought recovery for Barbados, Cayman, central Hispaniola, Jamaica, Leewards, Trinidad & Tobago, US C’bean Terr. and Windwards. – Fading El Niño will likely be followed by a La Niña later this year. This evolution should finally bring drought relief to the region, but may tilt the odds towards increased flash flood potential. MONITOR DROUGHT & CONSERVE WATER !! caricof@cimh. edu. bb

Long-term drought outlook Concerns by the end of the Caribbean wet/hurricane season (Nov 30 th, 2016)? Current Outlook • This 12 -month SPI-based drought outlook uses observations through April 2016, 2016 with potential impacts on large surface water reserves and groundwater. In general, impacts are expected if the 12 -month SPI is ≤-1. 3 (very dry or worse – ref. : CDPMN). • Impactful hydrological drought by the end of the wet season (Nov 30 th) is a concern across the Caribbean (insufficient data available for Haïti). • A drought warning is issued for the ABC Islands, Antigua and Barbuda. A drought watch is issued for Barbados, centralwest Belize, south Haïti, Leewards except Guadeloupe, Suriname, Trinidad and Tobago, Windwards, and U. S. C’bean Territories. caricof@cimh. edu. bb Previous Outlook

ALERT LEVEL NO CONCERN DROUGHT WATCH DROUGHT WARNING DROUGHT EMERGENCY caricof@cimh. edu. bb MEANING ACTION LEVEL ü ü No drought concern ü ü monitor resources update and ratify management plans public awareness campaigns upgrade infrastructure Drought possible ü ü ü keep updated protect resources and conserve water implement management plans response training monitor and repair infrastructure Drought evolving ü ü ü protect resources conserve and recycle water implement management plans release public service announcements last minute infrastructural repairs and upgrades report impacts ü ü Drought of immediate ü concern ü ü ü release public service announcements implement management and response plans enforce water restrictions and recycling enforce resource protection repair infrastructure report impacts

Thresholds Goodness Index Drought Skill Thresholds Alert Levels Probabilities Negative Skill <0 No Concern < 35 Very Limited 0 – 0. 1 Drought Watch 53 – 50 Limited 0. 1 – 0. 2 Drought Warning 50 – 85 Moderate 0. 2 – 0. 25 Fair 0. 25 -0. 3 Good > 0. 3 Drought Emergency > 85 caricof@cimh. edu. bb Roc Discrimination Thresholds No < 0. 5 Poor 0. 5 0. 6 Moderate 0. 6 – 0. 7 Fair 0. 7 -0. 8 Good 0. 8 – 0. 95 Very Good > 0. 95

Rainfall frequency and extreme forecasts – wet days and wet spells outlooks June to August 2016 Dr. Cedric VAN MEERBEECK 1 , Wazita Scott 1, Dr. Simon MASON 2, Ángel MUÑOZ 2, Dr. Teddy ALLEN 2, Dale Destin 3 1 Caribbean Institute for Meteorology and Hydrology (CIMH), Barbados 2 International Research Institute for Climate and Society (IRI), USA 3 Antigua and Barbuda Meteorological Services caricof@cimh. edu. bb

Wet day frequency shifts Forecast for: June to August 2016 USUALLY: Across the region during June-July-August, about 35 to 70 days are wet days. FORECAST: JJA rainfall is likely to be above- to normal in many parts of the Antilles, as well as the western half of the Guianas, but below- to normal in Belize. Fewer wet days than normal (low to medium confidence) are forecast across the region. caricof@cimh. edu. bb IMPLICATION: • Increasing surface wetness; • Increasing disruption of outdoor activities (however perhaps less often than usual).

Wet spells frequency shifts Forecast for: June to August 2016 JJA 2016 frequency of 7 -day wet spells JJA 2016 frequency of 7 -day very wet spells USUALLY: Roughly 3 to 6 wet spells occur between June & August, of which 1 to 3 are very wet. FORECAST: JJA rainfall is likely to be above- to normal in many parts of the Antilles, as well as the western half of the Guianas, but below- to normal in Belize. Fewer wet days and wet spells than normal are forecast, except for the Guianas where more wet spells are forecast (low to medium confidence). IMPLICATION: Recharging of large water reservoirs after a prolonged drought. caricof@cimh. edu. bb

Extreme wet spells frequency shifts Forecast for: June to August 2016 USUALLY: Up to 1 extreme wet spell JJA 2016 frequency of extreme (top 1%) occurs between June & August. 3 -day wet spells caricof@cimh. edu. bb FORECAST: JJA rainfall is likely to be above- to normal in many parts of the Antilles, as well as the western half of the Guianas, but below- to normal in Belize. Fewer wet days and wet spells than normal are forecast, except for the Guianas where more wet spells are forecast (low to medium confidence). There is an increased chance of extreme wet spells in the Lesser Antilles (medium to high confidence), whereas no frequency shifts are forecast elsewhere. IMPLICATION: Flash flood potential developing.

Climatology Forecast 26 -43 6 -16 34 -51 36 -48 33 -49 27 -42 7 -15 49 -67 53 -70 41 -51 25 -36 37 -52 44 -60 38 -57 41 -57 51 -63 46 -60 45 -52 55 -68 50 -64 24 -38 51 -63 31 -52 40 -57 27 -45 54 -67 51 -63 52 -64 43 -50 1. 7 -4. 7 0. 4 -3. 4 2. 6 -6. 4 3 -5. 7 2. 6 -5. 7 2. 9 -6. 7 0. 9 -3. 4 3. 9 -7 2. 2 -5. 6 3. 9 -6. 4 3. 3 -5. 7 3. 4 -6. 9 2. 2 -5. 2 3 -6 2. 9 -5. 6 3. 5 -6. 2 3. 1 -6. 4 3. 3 -5. 9 3. 3 -6. 1 2. 1 -4. 9 3 -6 2. 4 -5. 6 2. 9 -5. 7 1. 7 -4. 8 2. 9 -5. 5 2. 9 -5. 1 4. 3 -6. 6 3. 7 -5. 9 0. 9 -3. 2 0 -2. 1 0. 9 -3 0. 9 -2. 7 1. 3 -3. 4 0. 9 -4 0 -1. 4 1. 6 -4. 6 0. 9 -3 1. 7 -3. 6 1. 3 -3. 4 1. 7 -3. 7 1. 3 -4 0. 7 -3. 1 0. 9 -3. 4 1. 3 -3. 3 1. 1 -4 1. 3 -3. 6 0. 9 -3. 4 0. 9 -3 1. 3 -3. 2 1. 1 -3. 4 0. 9 -2. 9 0. 4 -2. 7 0. 9 -3. 2 1. 3 -3. 2 1. 6 -3. 6 1. 3 -3. 6 0 -1 0 -0. 3 0 -1 0 -1. 4 0 -1. 3 0 -0 0 -1 0 -1 0 -0. 6 0 -1 0 -1 0 -2 0 -1. 4 0 -1 0 -1 0 -1. 4 0 -1 25 -38 4 -16 31 -45 34 -46 29 -45 25 -42 6 -13 46 -64 52 -67 40 -53 27 -40 37 -55 45 -63 34 -64 41 -60 48 -65 43 -58 44 -53 55 -69 50 -65 20 -36 48 -63 31 -52 38 -53 25 -45 52 -68 49 -64 46 -60 34 -51 1. 3 -3. 8 0 -3. 3 1. 9 -4. 8 2. 4 -4. 9 1. 7 -5. 2 2. 3 -6. 5 0. 5 -2. 9 3. 2 -6. 6 1. 5 -4. 7 3. 1 -6. 1 3. 3 -7. 3 3. 6 -7. 4 4. 1 -10. 3 2. 3 -8. 9 3. 4 -7. 9 4 -9 3. 1 -7. 8 3. 6 -7. 7 3. 9 -8. 1 1. 7 -4. 9 3 -5. 6 1. 8 -4. 8 2. 5 -5. 1 1. 1 -3. 5 2. 3 -5. 2 3. 2 -6. 1 3. 8 -6. 3 2. 8 -5. 9 0. 7 -2. 7 0 -1. 8 1 -3 0. 8 -2. 6 1 -3. 5 0. 8 -3. 6 0 -1. 6 1. 2 -4. 6 0. 7 -3. 1 1. 1 -4. 3 1. 5 -4. 2 1. 6 -4. 6 0. 9 -3. 5 0. 9 -4. 4 1. 2 -3. 6 1. 5 -3. 9 1. 1 -4. 6 1. 2 -4. 1 0. 9 -4. 3 0. 8 -2. 9 1. 2 -3 0. 8 -3 0. 7 -3 0. 1 -2. 5 0. 8 -3. 3 1. 1 -3. 5 1. 6 -3. 6 1. 3 -3. 6 0 -0 0 -0. 9 0 -1. 2 0 -1. 7 0 -1. 3 0 -0 0 -1. 5 0 -0 0 -1. 6 0 -0. 9 0 -1. 3 0 -0. 6 0 -1. 2 0 -0. 9 0 -1. 7 0 -1. 2 0 -1. 4 0 -1. 5 0 -1. 8 0 -1. 3 0 -0. 8 0 -0. 6 0 -1. 5 0 -1. 4 0 -1. 5 0 -1. 2 grey none are expected No. of 3 -day extremely wet spells (1% wettest) dark blue an increase, Antigua (VC Bird) Aruba (Beatrix) Barbados (CIMH) Barbados (GAIA) Belize (C. Farm) Cayman Cuba (Punta Maisi) Dom. Republic (Las Americas) Dominica (Canefield) Dominica (Douglas Charles) Grenada (MBIA) Guyana_73 Guyana (Albion) Guyana (Blairmont) Guyana (Charity) Guyana (Enmore) Guyana (Georgetown) Guyana (New Amsterdam) Guyana (Skeldon) Guyana (Timehri) Guyana_Wales Jamaica (Worthy Park) Martinique (FDF Desaix) Puerto Rico (San Juan) St. Lucia (Hewanorra) St. Maarten (TNCM) St. Vincent (ET Joshua) Suriname (Zanderij) Tobago (ANR Robinson) Trinidad (Piarco) caricof@cimh. edu. bb No. of wet days No. of 7 -day wet spells No. of 7 -day very wet (20% wettest) spells (10% wettest) brown is a decrease in frequency, June to August 2016

June – November Atlantic Hurricane Season Outlooks prepared by CIMH Kathy-Ann Caesar, Chief Meteorologist Ag. ; adapted by Dr. Cédric J. Van Meerbeeck, Climatologist

June – November 2016 Atlantic Hurricane Season Outlooks an ACTIVE SEASON ? compiled by CIMH Dr. Cédric J. Van Meerbeeck, Climatologist & Wazita B. Scott, Assistant Climate Forecaster After Kathy-Ann Caesar, Chief Meteorologist
 CSU (Gray")
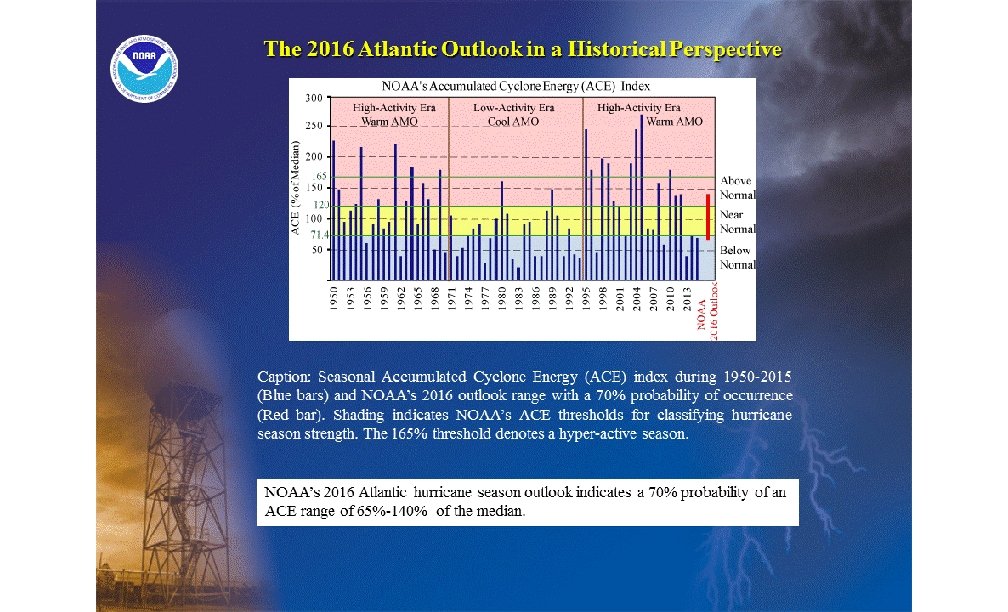
2016 Hurricane Season Forecasts Forecast Parameter and 1950 -2000 Climatology (in parentheses) CSU (Gray et al) 14 April 2016 Tropical Storm Risk 27 th May 2016 Weather Channel 17 th May 2016 NOAA-CPC 27 May 2015 (70% likelihood ranges) Named Storms (NS) (10) 12 17 14 10 -16 (B 25% - N 45% A 30%) Hurricanes (H) (5. 9) 5 9 8 4 -8 Intense Hurricanes (IH) (2. 3) 2 4 3 1 -4 Accumulated Cyclone Energy (ACE) (median = 100) 90 130 - 65%-140% 77

El Niño event to be replaced by La Niña � � � � WHAT? La Niña (El Niño), a periodic cooling (warming) of the equatorial Pacific waters, causes atmospheric conditions that are favourable for tropical cyclones. WHAT NOW? The 2015/6 very strong El Niño is fading. WHAT NEXT? El Niño expected to disappear by May or June. La Niña chances are ~70% at the peak of the Hurricane season (i. e. between August and October).
 � January to April SSTs (source: IRI,")
Warm to average Sea Surface Temperatures (SSTs) � January to April SSTs (source: IRI, adapted from NOAA) � � � WHAT? Heat in the top layers of the tropical North Atlantic Ocean and Caribbean Sea = fuel source for tropical cyclones. Warmer sea-surface temperatures (SSTs) = more active season. WHAT NOW / NEXT? Warm to average SSTs in the west of main development region (MDR) this year & predicted to remain on the warm side. HOWEVER, cool SSTs observed in the east of the MDR. more heat enhanced tropical cyclone activity.

Caribbean Landfall probabilities � � � Klotzbach and Gray Probability for at least one major (category 3, 4 or 5) hurricane tracking into the Caribbean (10 -20°N, 60 -88°W) � 40% (average for last century is 42%) TSR - Caribbean Forecast Lesser Antilles Land falling Numbers in 2015 � Possible 2 Named storm and 1 Hurricane MDR, Caribbean Sea and Mexico (Belize) � Possible 12 Named Storms and 7 Hurricanes, incl. 4 intense hurricanes.

Disclaimer DISCLAIMER � CIMH is providing special weather interpretation of the current and forecasted tropical weather affecting the Caribbean region. � CIMH is not an official forecasting agency.

APPENDIX caricof@cimh. edu. bb

US Climate Prediction center – Climate Diagnostics bulletin caricof@cimh. edu. bb http: //www. cpc. ncep. noaa. gov/products/CDB/Extratropics/fige 1. shtml http: //www. cpc. ncep. noaa. gov/products/CDB/Extratropics/fige 3. shtml

US Climate Prediction center – Climate Diagnostics bulletin caricof@cimh. edu. bb http: //www. cpc. ncep. noaa. gov/products/CDB/Tropics/figt 5. shtml http: //www. cpc. ncep. noaa. gov/products/CDB/Tropics/figt 18. shtml

NOAA CPC NAO index monitoring/forecasting caricof@cimh. edu. bb http: //www. cpc. ncep. noaa. gov/products/precip/CWlink/pna/nao_index_ensm. shtml

Explanatory variables – IRI Predicted SSTs Caribbean & tropical Atlantic El Niño region caricof@cimh. edu. bb http: //iridl. ldeo. columbia. edu/maproom/Global/Forecasts/SST. html? L=2. 5

Explanatory variables – IRI Predicted SSTs Caribbean & tropical Atlantic El Niño region caricof@cimh. edu. bb http: //portal. iri. columbia. edu/portal/server. pt? open=512&obj. ID=585&Page. ID=0&cached=true&mode=2&user. ID=2

Explanatory variables – ECMWF Predicted Tropical SSTs caricof@cimh. edu. bb http: //www. ecmwf. int/en/forecasts/charts/seasonal/sea-surface-temperature-public-charts-long-range-forecast

US Climate Prediction Center – El Niño update caricof@cimh. edu. bb http: //www. cpc. ncep. noaa. gov/products/analysis_monitoring/enso_update/ssta_c. gif

Explanatory variables – CPC/IRI ENSO Forecast caricof@cimh. edu. bb http: //iri. columbia. edu/our-expertise/climate/forecasts/enso/current/

caricof@cimh. edu. bb http: //iri. columbia. edu/our-expertise/climate/forecasts/enso/2013 -december-quick-look/

IRI – multi-model probabilistic rainfall forecast caricof@cimh. edu. bb http: //iri. columbia. edu/our-expertise/climate/forecasts/seasonal-climate-forecasts/

EUROSIP - multi-model probabilistic rainfall forecast caricof@cimh. edu. bb http: //old. ecmwf. int/products/forecasts/d/charts/seasonal/forecast/eurosip/group_euro_public/seasonal_charts_rain

ECMWF - ensemble probabilistic rainfall forecast caricof@cimh. edu. bb http: //www. ecmwf. int/en/forecasts/charts/seasonal/rain-public-charts-long-rangeforecast? time=2015100100, 5088, 2016043000&area=Tropics&forecast_type_and_skill_measures=tercile%20 summary

UK Met Office – probabilistic Rainfall forecast caricof@cimh. edu. bb http: //www. metoffice. gov. uk/research/climate/seasonal-to-decadal/gpc-outlooks/glob-seas-prob

NOAA CPC – probabilistic rainfall forecast caricof@cimh. edu. bb http: //www. cpc. ncep. noaa. gov/products/international/cfsv 2/camerica_prec_prob 2. shtml

APCC – multi-model probabilistic rainfall forecast caricof@cimh. edu. bb http: //www. apcc 21. org/eng/service/6 mon/ps/japcc 030703. jsp

Météo France Arpège – probabilistic rainfall forecast *** courtesy of Christophe Montout and Florian Gibier caricof@cimh. edu. bb

Japan Met Agency - probabilistic rainfall forecast caricof@cimh. edu. bb http: //ds. data. jma. go. jp/tcc/products/model/probfcst/3 -mon/fcst_gl. php
")
Environment Canada Can. SIPS - probabilistic Rainfall forecast JJA 2015 (0. 5 month lead) caricof@cimh. edu. bb SON 2016 (3. 5 month lead)

IRI – multi-model probabilistic T 2 m forecast caricof@cimh. edu. bb http: //iri. columbia. edu/our-expertise/climate/forecasts/seasonal-climate-forecasts/

EUROSIP - multi-model probabilistic T 2 m forecast caricof@cimh. edu. bb http: //old. ecmwf. int/products/forecasts/d/charts/seasonal/forecast/eurosip/group_euro_public/seasonal_charts_2 tm

ECMWF - ensemble probabilistic T 2 m forecast caricof@cimh. edu. bb http: //www. ecmwf. int/en/forecasts/charts/seasonal/2 m-temperature-public-charts-long-rangeforecast? time=2015100100, 3624, 2016022900&area=Tropics&forecast_type_and_skill_measures=tercile%20 summary

UK Met Office – probabilistic T 2 m forecast caricof@cimh. edu. bb http: //www. metoffice. gov. uk/research/climate/seasonal-to-decadal/gpc-outlooks/glob-seas-prob

APCC – multi-model probabilistic T 2 m forecast caricof@cimh. edu. bb http: //www. apcc 21. org/eng/service/6 mon/ps/japcc 030703. jsp

Météo France Arpège – probabilistic T 2 m forecast *** courtesy of Christophe Montout and Florian Gibier caricof@cimh. edu. bb

Japan Met Agency - probabilistic T 2 m forecast caricof@cimh. edu. bb http: //ds. data. jma. go. jp/tcc/products/model/probfcst/3 -mon/fcst_gl. php

Environment Canada Can. SIPS - probabilistic T 2 m forecast MJJ 2016 (0. 5 month lead) caricof@cimh. edu. bb ASO 2016 (3. 5 month lead)

caricof@cimh. edu. bb rcc. cimh. edu. bb Caribbean Institute for Meteorology and Hydrology TEL: (246) 425 -1362/3 | FAX: (246) 424 -4733
- Slides: 110