Cardiovascular Epidemiology and Prevention Nathan D Wong Ph


 or CORONARY HEART DISEASE (CHD) (often broadly referred")
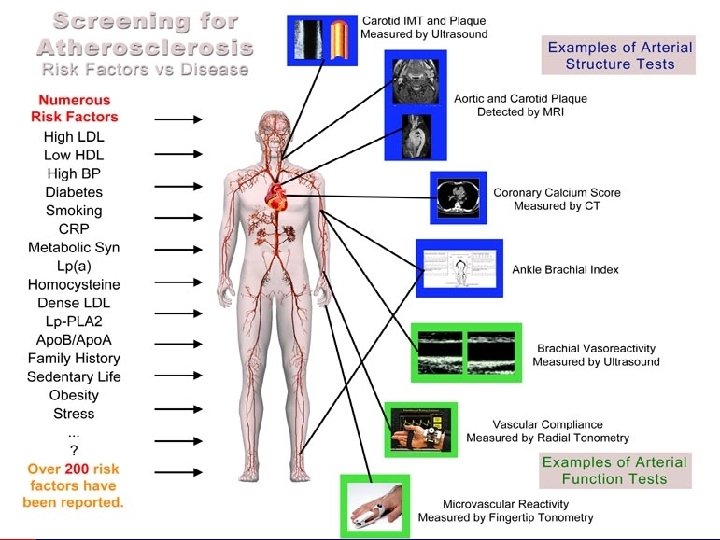
 • SURROGATE MEASURES include: carotid intimal medial thickness (IMT), coronary calcium,")

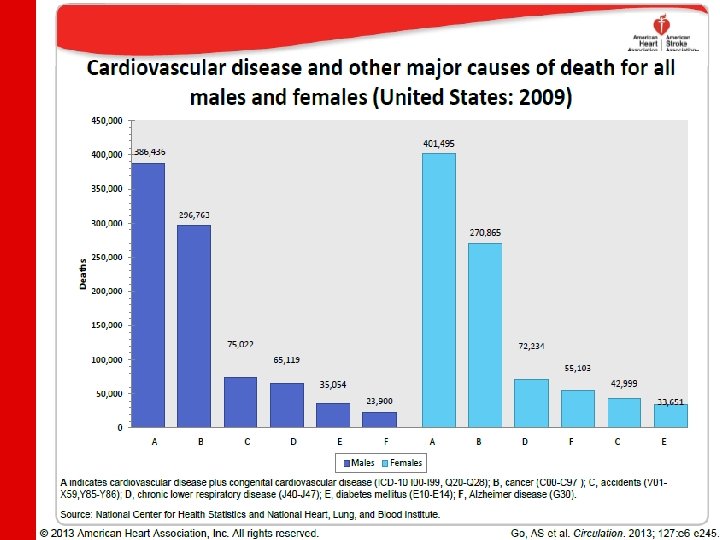

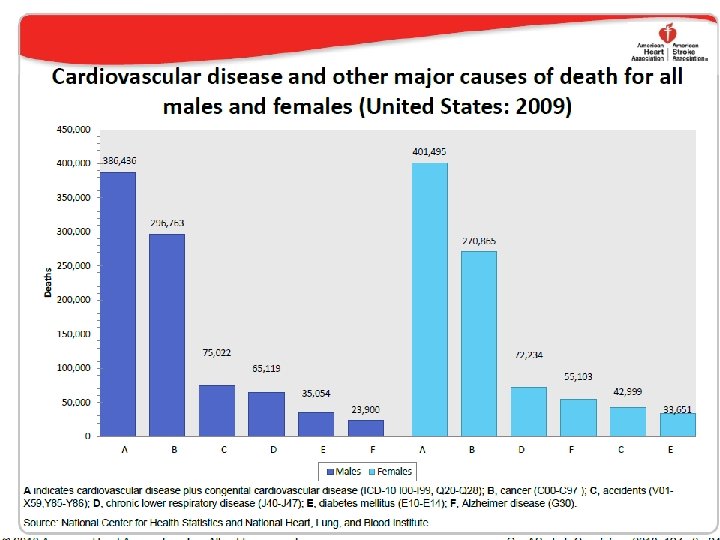
 of major cardiovascular diseases and stroke")
 in the United States")

. 18 16 14. 5")


 B: 3")


 showed mass media")


")


, (obesity)")


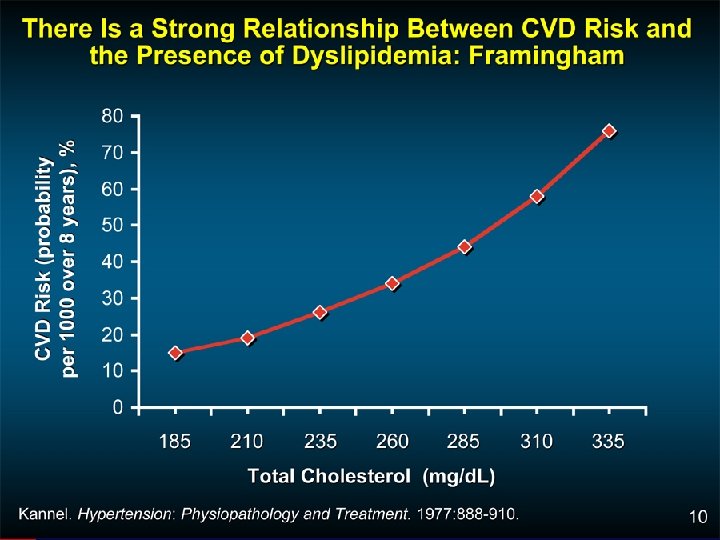


 As early as 1976, former Framingham director Dr. William")
 Endpoint Definition")

 LDL-C Treatment Targets Risk Category LDL-C Goal Initiate")
 Global Risk")

")


 Homocysteine IL-6 TC LDLC s. ICAM-1")


 C-statistics: FRS alone 0. 623 FRS+CAC 0. 784 (p<0.")
 – 5, 115 adults (half African-American)")


")

 –")


- Slides: 117
Cardiovascular Epidemiology and Prevention Nathan D. Wong, Ph. D, FACC, FAHA Professor and Director, Heart Disease Prevention Program, Division of Cardiology, University of California, Irvine Adjunct Prof. Epidemiology (UCLA and UCI) Immediate Past President, American Society of Preventive Cardiology
Textbooks
Cardiovascular Epidemiology: Definitions, Concepts, Historical Perspectives and Statistics
Definitions • CORONARY ARTERY DISEASE (CAD) or CORONARY HEART DISEASE (CHD) (often broadly referred to as ISCHEMIC HEART DISEASE (IHD): primarily myocardial infarction and sudden coronary death, broader definition may include angina pectoris, atherosclerosis, positive angiogram, and revascularization (perceutaneous coronary interventions, or PCI such as angioplasty and stents) • CARDIOVASCULAR DISEASE or CVD includes CHD, cerebrovascular disease, peripheral vascular disease, and other cardiac conditions (congenital, arrhythmias, and congestive heart failure)
Definitions (cont. ) • SURROGATE MEASURES include: carotid intimal medial thickness (IMT), coronary calcium, angiographic stenosis, brachial ultrasound flow mediated dilatation (FMD) • Hard endpoints include myocardial infarction, CHD death, and stroke
THE REAL NIGHTMARE
Trends in cardiovascular procedures, United States: 1979– 2009 1400 Procedures in Thousands 1200 1000 800 600 400 200 0 1979 1980 1985 1990 1995 2000 2005 2009 Years Catheterizations Bypass PCI Carotid Endarterectomy Pacemakers Note: Inpatient procedures only. Source: National Hospital Discharge Survey, NCHS, and NHLBI. © 2011 American Heart Association, Inc. All rights reserved. Roger VL et al. Published online in Circulation Dec. 15, 2011
Direct and indirect costs (in billions of dollars) of major cardiovascular diseases and stroke (United States: 2008) 200 190. 3 180 160 Billions of Dollars 140 120 100 80 60 50. 6 34. 3 40 22. 5 20 0 Heart disease Hypertension Stroke Other CVD Source: National Heart, Lung, and Blood Institute. © 2011 American Heart Association, Inc. All rights reserved. Roger VL et al. Published online in Circulation Dec. 15, 2011
Projected Total Costs of CVD, 2015– 2030 (in Billions 2008$) in the United States 1200 1117. 6 Total Dollars (in Billions) 1000 886. 2 704. 7 564. 9 600 408. 5 400 245. 2 194. 1 121. 1 250. 5 186. 7 153. 2 200 320. 0 223. 8 143. 0 97. 0 156. 9 132. 4 44. 6 57. 0 197. 8 111. 2 74. 1 69. 1 87. 1 0 All CVD Hypertension CHD 2015 2020 HF 2025 Stroke Other CVDs 2030 Unpublished data tabulated by AHA using methods described in Circulation. 2011; 123: 933– 944. © 2011 American Heart Association, Inc. All rights reserved. Roger VL et al. Published online in Circulation Dec. 15, 2011
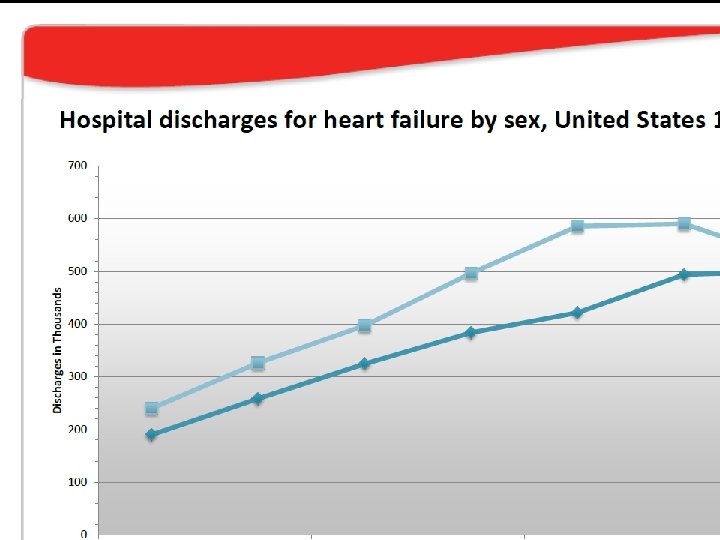
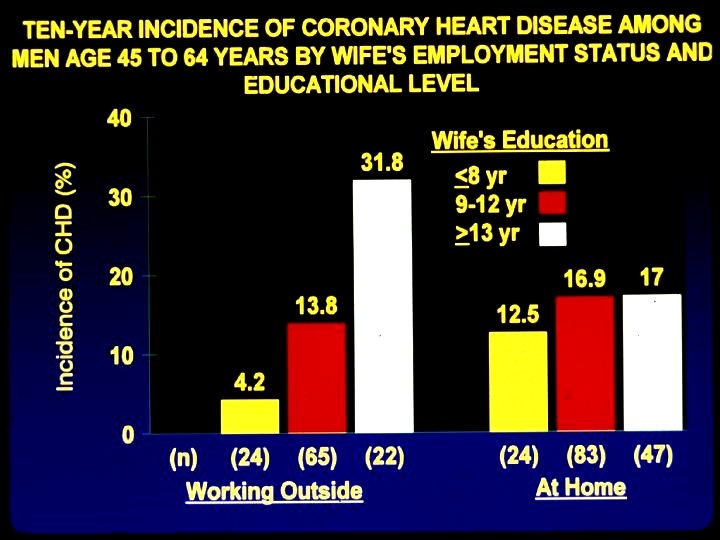
So how long have we known that women are just not small men? ? ?
Prevalence of stroke by age and sex (NHANES: 2005– 2008). 18 16 14. 5 14. 8 Percent of Population 14 12 10 8. 2 8 7. 2 6 4 2. 4 1. 6 2 0. 3 0. 5 0 20 -39 40 -59 Men Age 60 -79 80+ Women Source: NCHS and NHLBI. © 2010 American Heart Association, Inc. All rights reserved. Roger VL et al. Published online in Circulation Dec. 15, 2010
Development of Atherosclerotic Plaques Fatty streak Normal Lipid-rich plaque Foam cells Fibrous cap Thrombus Ross R. Nature. 1993; 362: 801 -809. Lipid core
PDAY: Percentage of Right Coronary Artery Intimal Surface Affected With Early Atherosclerosis 30 Intimal surface (%) Men Raised lesions 30 Fatty streaks 20 20 10 10 0 30 0 15 -19 20 -24 25 -29 30 -34 White 30 20 20 10 10 0 0 15 -19 20 -24 25 -29 30 -34 Black Age (y) PDAY= Pathobiological Determinants of Atherosclerosis in Youth. Strong JP, et al. JAMA. 1999; 281: 727 -735. Women 15 -19 20 -24 25 -29 30 -34 White 15 -1920 -2425 -2930 -34 Black
Most Myocardial Infarctions Are Caused by Low-Grade Stenoses Pooled data from 4 studies: Ambrose et al, 1988; Little et al, 1988; Nobuyoshi et al, 1991; and Giroud et al, 1992. (Adapted from Falk et al. ) Falk E et al, Circulation, 1995.
Coronary Remodeling Progression Compensatory expansion maintains constant lumen Normal vessel (Adapted from Glagov et al. ) Glagov et al, N Engl J Med, 1987. Minimal CAD Moderate CAD Expansion overcome: lumen narrows Severe CAD
Atherosclerotic Plaque Rupture and Thrombus Formation Intraluminal thrombus Growth of thrombus Blood Flow Intraplaque thrombus Adapted from Weissberg PL. Eur Heart J Supplements 1999: 1: T 13– 18 Lipid pool
Features of a Ruptured Atherosclerotic Plaque • Eccentric, lipid-rich • Fragile fibrous cap • Prior luminal obstruction < 50% • Visible rupture and thrombus Constantinides P. Am J Cardiol. 1990; 66: 37 G-40 G.
Vulnerable Versus Stable Atherosclerotic Plaques Vulnerable Plaque Lumen Fibrous Cap Lipid Core • Thin fibrous cap • Inflammatory cell infiltrates: proteolytic activity • Lipid-rich plaque Stable Plaque Lumen Lipid Core Fibrous Cap Libby P. Circulation. 1995; 91: 2844 -2850. • Thick fibrous cap • Smooth muscle cells: more extracellular matrix • Lipid-poor plaque
Correlation of CT angiography of the coronary arteries with intravascular ultrasound illustrates the ability of MDCT to demonstrate calcified and non-calcified coronary plaques (Becker et al. , Eur J Radiol 2000) Non-calcified, soft, lipid-rich plaque in left anterior descending artery (arrow) (Somatom Sensation 4, 120 ml Imeron 400). The plaque was confirmed by intravascular ultrasound (Kopp et al. , Radiology 2004)
Pyramid of Risk (Werner et al. Canadian Journal of Cardiology 1998; 14(Suppl) B: 3 B-10 B)
Approaches to Primary and Secondary Prevention of CVD • Primary prevention involves prevention of onset of disease in persons without symptoms. • Primordial prevention involves the prevention of risk factors causative o the disease, thereby reducing the likelihood of development of the disease. • Secondary prevention refers to the prevention of death or recurrence of disease in those who are already symptomatic
Risk Factor Concepts in Primary Prevention • Nonmodifiable risk factors include age, sexc, race, and family history of CVD, which can identify high-risk populations • Behavioral risk factors include sedentary lifestyle, unhealthful diet, heavy alcohol or cigarette consumption. • Physiological risk factors include hypertension, obesity, lipid problems, and diabetes, which may be a consequence of behavioral risk factors.
Population vs. High-Risk Approach • Risk factors, such as cholesterol or blood pressure, have a wide bell-shaped distribution, often with a “tail” of high values. • The “high-risk approach” involves identification and intensive treatment of those at the high end of the “tail”, often at greatest risk of CVD, reducing levels to “normal”. • But most cases of CVD do not occur among the highest levels of a given risk factor, and in fact, occur among those in the “average” risk group. • Significant reduction in the population burden of CVD can occur only from a “population approach” shifting the entire population distribution to lower levels.
Expected Shifts in Cholesterol Distribution from High-Risk, Population, and Combined Approaches
Population and Community. Wide CVD Risk Reduction Approaches • Populations with high rates of CVD are those with Western lifestyles of high-fat diets, physical inactivity, and tobacco use. • Targets of a population-wide approach must be these behaviors causative of the physiologic risk factors or directly causative of CVD. • Requires public health services such as surveillance (e. g. , BFRSS), education (AHA, NCEP), organizational partnerships (Singapore Declaration), and legislation/policy (Anti-Tobacco policies) • Activities in a variety of community settings: schools, worksites, churches, healthcare facilities, entire communities
A conceptual framework for public health practice in CVD prevention. (From Pearson et al. , J Public Health. 2001; 29: 69 – 78)
Communitywide CVD Prevention Programs • Stanford 3 -Community Study (1972 -75) showed mass media vs. no intervention in high-risk residents to result in 23% reduction in CHD risk score • North Karelia (1972 -) showed public education campaign to reduce smoking, fat consumption, blood pressure, and cholesterol • Stanford 5 -City Project (1980 -86) showed reductions in smoking, cholesterol, BP, and CHD risk • Minnesota Heart Health Program (1980 -88) showed some increases in physical activity and in women reductions in smoking
Materials Developed for US Community Intervention Trials • • • Mass media, brochures and direct mail Events and contests Screenings Group and direct education School programs and worksite interventions Physician and medical setting programs Grocery store and restaurant projects Church interventions Policies
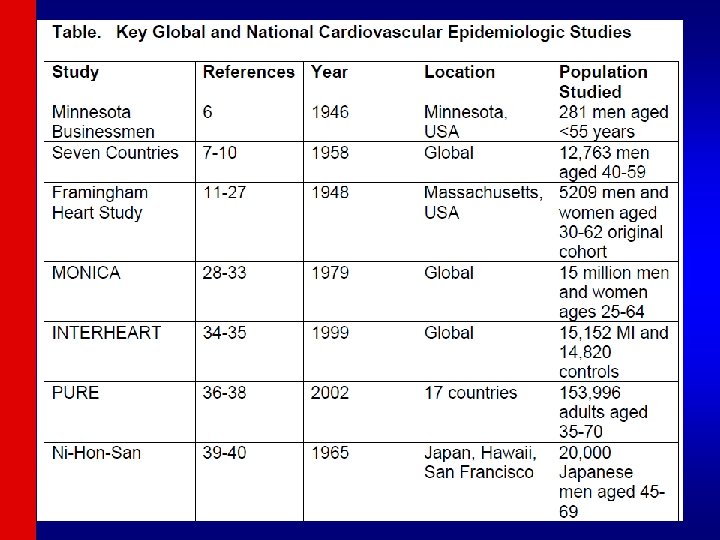
Foundations of CVD Epidemiology • Lack of reliable data on CVD noted as early as 1880’s and in 1934 the Society of Geographic Pathology noted the frequency of atherosclerotic lesions by country, social class and occupation. • In 1946 the first prospective study of CVD was launched by Ansel Keys in Minnesota businessmen.
Cholesterol intake and CHD Death Rate: The Seven Countries Study (n=12763 men aged 40 -59)
Cholesterol and Mortality: WHO Monica (n=15 million men and women aged 25 -64)
Migrant Studies • Ni-Hon-San Study showed Japanese living in Japan to have the lowest cholesterol levels and lowest rates of CHD, those living in Hawaii to have intermediate rates for both, and those living in San Francisco to have the highest cholesterol levels and CHD incidence
Framingham Heart Study • Longest running study of cardiovascular disease in the world • Began in 1948 with original cohort of 5, 209 subjects aged 30 -62 at baseline • Biennial examinations, still ongoing, most of original cohort deceased • Offspring cohort of 5, 124 of children of original cohort enrolled in 1971, and more recently and still being enrolled to better understand genetic components of CVD risk are up to 3, 500 grandchildren of the original cohort. • Routine surveillance of cardiovascular disease events adjudicated by panel of physicians
Concept of cardiovascular “risk factors” Age, sex, hypertension, hyperlipidemia, smoking, diabetes, (family history), (obesity) Kannel et al, Ann Intern Med 1961
Framingham Most Significant Milestones • 1960 Cigarette smoking found to increase the risk of heart disease • 1961 Cholesterol level, blood pressure, and electrocardiogram abnormalities found to increase the risk of heart disease • 1967 Physical activity found to reduce the risk of heart disease and obesity to increase the risk of heart disease • 1970 High blood pressure found to increase the risk of stroke • 1976 Menopause found to increase the risk of heart disease • 1978 Psychosocial factors found to affect heart disease • 1988 High levels of HDL cholesterol found to reduce risk of death • 1994 Enlarged left ventricle (one of two lower chambers of the heart) shown to increase the risk of stroke
9 Doubts about cholesterol as late as 1989
Total Cholesterol Distribution: CHD vs Non-CHD Population Framingham Heart Study— 26 -Year Follow-up No CHD 35% of CHD Occurs in People with TC<200 mg/d. L CHD 150 200 250 300 Total Cholesterol (mg/d. L) Castelli WP. Atherosclerosis. 1996; 124(suppl): S 1 -S 9. 1996 Reprinted with permission from Elsevier Science.
Low HDL-C Levels Increase CHD Risk Even When Total-C Is Normal 12 11 . 91 11. 24 11 9. 0 0. 7 1 5 6. 6 5. 5 6 6. 5 3. 7 7 < 40 40– 4950– 59 60 HDL-C (mg/d. L) 2 260 230– 259 200– 229 < 200 . 78 2. 0 6 ) 5 d. L 4. 1 5 (m g/ 7 3 l. C 4. 6 3. 8 ta 4. 8 3 To 14 -y incidence rates (%) for CHD 14 12 10 8 6 4 2 0 . 50 Risk of CHD by HDL-C and Total-C levels; aged 48– 83 y Castelli WP et al. JAMA 1986; 256: 2835– 2838
Messerli, F. H. N Engl J Med 199561
____________________________ CK Friedberg on Hypertension: Diseases of the Heart 1996 ______________________________ “There is a lack of correlation in most cases between the severity and duration of hypertension and development of cardiac complications. ” ________________________________
Relation of Non-Hypertensive Blood Pressure to Cardiovascular Disease Vasan R, et al. N Engl J Med 2001; 345: 1291 -1297 10 -year Age- Adjusted Cumulative Incidence Hazard Ratio* 10. 1 7. 6 5. 8 4. 4 SBP Women Men <120/80 1. 0 120 -129 1. 5 1. 3 130 -139 2. 5 1. 6 H. R. adjusted for age, BMI, Cholesterol, Diabetes and smoking *P<. 001 2. 8 1. 9 Framingham Study: Subjects Ages 35 -90 yrs.
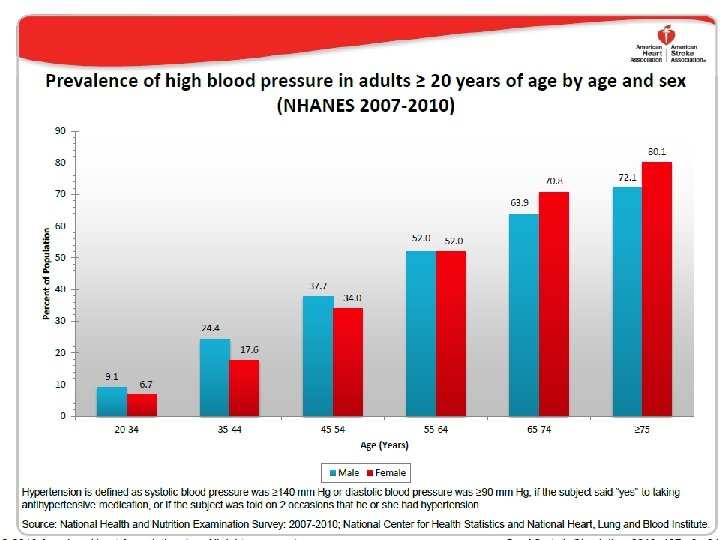
Extent of awareness, treatment and control of high blood pressure by race/ethnicity (NHANES : 2005 -2006). Source: NCHS and NHLBI.
______________________________ Smoking Statement Issued in 1956 by American Heart Association ______________________________ “It is the belief of the committee that much greater knowledge is needed before any conclusions can be drawn concerning relationships between smoking and death rates from coronary heart disease. The acquisition of such knowledge may well require the use of techniques and research methods that have not hitherto been applied to this problem. ” ______________________________ Circulation 1960; vol. 23
CHD Risk by Cigarette Smoking. Filter Vs. Non-filter. Framingham Study. Men <55 Yrs. 14 -yr. Rate/1000 206 210 119 112 59
Prevalence of students in grades 9 to 12 reporting current cigarette use by sex and race/ethnicity (YRBSS, 2009) 25 22. 3 22. 8 19. 4 Percent of the Population 20 16. 7 15 10. 7 10 8. 4 5 0 NH White NH Black Males Hispanic Females Source: MMWR Surveill Summ. 2010; 59: 1– 142. NH indicates non-Hispanic. © 2011 American Heart Association, Inc. All rights reserved. Roger VL et al. Published online in Circulation Dec. 15, 2011
Prevalence of current smoking for adults > 18 years of age by race/ethnicity and sex (NHIS: 2007 -2009) 30 26. 8 Percent of Population 25 22. 9 23. 6 20 19. 9 18. 9 17. 0 15. 4 15 9. 3 10 5. 4 5 0 Men NH White NH Black Women Hispanic Asian* American Indian/Alaska Native* All percentages are age-adjusted. NH indicates non-Hispanic. *Includes both Hispanics and non-Hispanics. Data derived from Centers for Disease Control and Prevention/National Center for Health Statistics, Health Data Interactive. © 2011 American Heart Association, Inc. All rights reserved. Roger VL et al. Published online in Circulation Dec. 15, 2011
Diseases of The Heart Charles K Friedberg MD, WB ________________________________ Saunders Co. Philadelphia, 1949 “The proper control of diabetes is obviously desirable even though there is uncertainty as to whether coronary atherosclerosis is more frequent or severe in the uncontrolled diabetic” _______________________________
Risk of Cardiovascular Events in Diabetics Framingham Study _________________________________ Cardiovascular Event Coronary Disease Stroke Peripheral Artery Dis. Cardiac Failure All CVD Events Age-adjusted Biennial Rate Age-adjusted Per 1000 Risk Ratio Men Women 39 21 1. 5** 2. 2*** 15 6 2. 9*** 2. 6*** 18 18 3. 4*** 6. 4*** 23 21 4. 4*** 7. 8*** 76 65 2. 2*** 3. 7*** _________________________________ Subjects 35 -64 36 -year Follow-up **P<. 001, ***P<. 0001
Skepticism About Importance of Obesity Keys A, Aravanis C, Blackburn H, et al. Ann Intern Med 1972; 77: 15 -27. Concluded that all the excess risk of coronary heart disease in the obese derives from its atherogenic accompaniments, illogically leaving the impression that obesity is therefore unimportant. Mann GV. N Engl J Med 1974; 291: 226 -232. “The contribution of obesity to CHD is either small or non-existent. It cannot be expected that treating obesity is either logical or a promising approach to the management of CHD”. Barrett-Connor EL. Ann Intern Med 1985; 103: 1010 -1019 NIH consensus panel is equivocal about the role of obesity as a cause of CHD.
Relation of Weight Change to Changes in Atherogenic Traits: The Framingham Study Frantz Ashley, Jr. and William B Kannel J Chronic Dis 1974 “Weight gain is accompanied by atherogenic alterations in blood lipids, blood pressure, uric acid and carbohydrate tolerance. ” “It seems reasonable to expect that correction of overweight will improve the coronary risk problem. ” “Avoidance of overweight would seem a desirable goal in the general population if the appalling annual toll from disease is to be substantially reduced. ”
Trends in the prevalence of obesity among US children and adolescents by age and survey year (National Health and Nutrition Examination Survey: 1971 -1974, 1976 -1980, 1988 -1994, 19992002 and 2005– 2008) 20 16. 0 15. 9 16 Percent of Population 17. 9 17. 4 18 14 11. 3 12 10. 5 10 8 6. 5 6. 1 6 5. 0 4 2 0 6 -11 1971 -1974 12 -19 Age (Years) 1976 -1980 1988 -1994 1999 -2002 2005 -2008 Data derived from Health, United States, 2010: With Special Feature on Death and Dying. NCHS, 2011. © 2011 American Heart Association, Inc. All rights reserved. Roger VL et al. Published online in Circulation Dec. 15, 2011
Age-adjusted prevalence of obesity in adults 20– 74 years of age, by sex and survey year (NHES: 1960– 62; NHANES: 1971– 74, 1976– 80, 1988– 94, 1999 -2002 and 2005 -08) 40 36. 2 35 34. 0 33. 3 30 28. 1 Percent of Population 26. 0 25 20. 6 20 15. 7 15 12. 2 16. 8 17. 1 12. 8 10. 7 10 5 0 Men 1960 -62 Women 1971 -74 1976 -80 1988 -94 1999 -2002 2005 -08 Data derived from Health, United States, 2010: With Special Feature on Death and Dying. NCHS, 2011. © 2011 American Heart Association, Inc. All rights reserved. Roger VL et al. Published online in Circulation Dec. 15, 2011
Framingham Heart Study: Kannel et al. , 1961
Why Use Risk Scores? 1) As early as 1976, former Framingham director Dr. William Kannel had noted risk functions provide an “economic and efficient method of identifying persons at high cardiovascular risk who need preventive treatment and persons at low risk who need not be alarmed about one moderately elevated risk characteristic” (AJC 1976) 2) The ACC Bethesda Conference noted the intensity of treatment should match a person’s risk (Califf RM, JACC 1996). 3) Studies show a physician’s estimate is only accurate 24% of the time (Pignone et al, BMC health Serv Res 2003). 4) Routine use of global risk scores leads to greater use of guideline-based therapy and modest improvements in intermediate outcomes with no harm identified (Sheridan et al. BMC Health Serv Res 2008).
Key Risk Scores Used in CHD and CVD Prediction Risk Score (year) Endpoint Definition Framingham, 1991 (Anderson) 10 -year all CHD death, MI, unstable angina, angina Framingham, 1998 (Wilson) 10 -year all CHD and CHD death, MI, unstable hard CHD angina, angina ATP III, 2001 (Framingham) 10 -year hard CHD death, nonfatal MI PROCAM 2002 (Germany) 10 -year hard CHD death, non-fatal MI European SCORE 2003 and after 10 -year CVD death only (country and region specific) QRISK 2007 (England Wales) 10 -year global CVD death, MI, stroke, revascularization Reynolds women (2007) and men 10 -year global CVD (2008) (Boston, USA) CHD death, MI, stroke, revascularization Framingham Global CVD 2008 10 -year global CVD death, all CHD, stroke, heart failure, claudication Pooled Cohort Equations 2013 (USA) 10 -year and lifetime ASCVD Nonfatal/fatal MI & stroke
ATP III Framingham Risk Scoring Assessing CHD Risk in Women Step 4: Systolic Blood Pressure Step 1: Age Years Points 20 -34 -7 35 -39 -3 40 -44 0 45 -49 3 50 -54 6 55 -59 8 60 -64 10 65 -69 12 70 -74 14 75 -79 16 Step 2: Total Cholesterol TC Points at (mg/d. L) Age 20 -39 70 -79 <160 0 160 -199 4 200 -239 8 240 -279 11 13 Step 280 3: HDL-Cholesterol HDL-C (mg/d. L) 60 Points -1 50 -59 0 40 -49 1 Systolic BP (mm Hg) <120 120 -129 130 -139 140 -159 160 Step 6: Adding Up the Points if Untreated if Treated 0 0 1 3 2 4 3 5 4 6 Age Total cholesterol HDL-cholesterol Systolic blood pressure Smoking status Point total Step 7: CHD Risk Points at Age 40 -49 Age 50 -59 Age 60 -69 Age 0 0 3 2 6 4 8 5 10 7 Step 5: Smoking Status Nonsmoker Smoker Points at Age 20 -39 0 1 2 3 4 0 1 1 2 2 Points at Age 40 -49 0 7 Point Total 10 -Year Risk <9 <1% 20 11% 9 1% 21 14% 10 1% 22 17% 11 1% 23 22% 12 1% 24 27% 13 2% 25 30% 14 2% 15 3% 16 4% 17 5% 18 6% 19 8% Points at Age 50 -59 Age 60 -69 Age 70 -79 0 0 0 4 2 1 <40 2 Note: Risk estimates were derived from the experience of the Framingham Heart Study, a predominantly Caucasian population in Massachusetts, USA. Expert Panel on Detection, Evaluation, and Treatment of High Blood Cholesterol in Adults. JAMA. 2001; 285: 2486 -2497. © 2001, Professional Postgraduate Service www. lipidhealth. org
ATP III Update ( 2004 ) LDL-C Treatment Targets Risk Category LDL-C Goal Initiate TLC Consider Drug Therapy High risk: CHD or CHD risk equivalents (10 -year risk >20%) <100 mg/d. L (optional goal: 100 mg/d. L <70 mg/d. L) 100 mg/d. L (<100 mg/d. L: consider drug Rx) Moderately high risk: 2+ risk factors (10 -year risk 10% to 20%) <130 mg/d. L (optimal <100 mg/d. L) 130 mg/d. L (100 -129 mg/d. L: consider Rx ) Moderate risk: 2+ risk factors (risk <10%) <130 mg/d. L 160 mg/d. L Lower risk: 0 -1 risk factor <160 mg/d. L 190 mg/d. L Adapted from Grundy SM, et al. Circulation. 2004; 110: 227 -239.
10 -Year Framingham Total Cardiovascular Disease Risk Score (D’Agostino et al, 2008) Global Risk Scoring: Class 1 a ACCF/AHA Guideline for Assessment of Cardiovascular Risk in Asymptomatic Adults, Circulation 2010
Recommendation to begin with a global risk assessment using the Pooled Cohort Equations to estimate 10 -year ASCVD Risk
Pooled Cohort Equations 10 -year ASCVD Risk Calculator (Framingham, ARIC, CARDIA, and CHS)
Lifetime Risks of Cardiovascular Disease Death by Number of Risk Factors and Attained Age (Berry et al. , 2012) Men Women Optimal risk factors: total cholesterol <180 mg/dl, blood pressure <120/80, nonsmoking, non-diabetic. Major risk factors: current smoker, diabetes, treated cholesterol or untreated cholesterol >=240 mg/dl, treated hypertension or untreated systolic BP >=160 mm. Hg or diastolic BP>=100 mm. Hg.
________________________________________ Lifetime Risk of CHD Increases with Serum Cholesterol ______________________________________ Cholesterol 57 44 34 29 33 19 Framingham Study: Subjects age 40 years DM Lloyd-Jones et al Arch Intern Med 2003; 1966 -1972
Relation of Non-Hypertensive Blood Pressure to Cardiovascular Disease Vasan R, et al. N Engl J Med 2001; 345: 1291 -1297 10 -year Age- Adjusted Cumulative Incidence Hazard Ratio* 10. 1 7. 6 5. 8 4. 4 SBP Women Men <120/80 1. 0 120 -129 1. 5 1. 3 130 -139 2. 5 1. 6 H. R. adjusted for age, BMI, Cholesterol, Diabetes and smoking *P<. 001 2. 8 1. 9 Framingham Study: Subjects Ages 35 -90 yrs.
Risk of Cardiovascular Events in Diabetics Framingham Study _________________________________ Cardiovascular Event Coronary Disease Stroke Peripheral Artery Dis. Cardiac Failure All CVD Events Age-adjusted Biennial Rate Age-adjusted Per 1000 Risk Ratio Men Women 39 21 1. 5** 2. 2*** 15 6 2. 9*** 2. 6*** 18 18 3. 4*** 6. 4*** 23 21 4. 4*** 7. 8*** 76 65 2. 2*** 3. 7*** _________________________________ Subjects 35 -64 36 -year Follow-up **P<. 001, ***P<. 0001
Risk Factors for Future Cardiovascular Events: WHS Lipoprotein(a) Homocysteine IL-6 TC LDLC s. ICAM-1 SAA Apo B TC: HDLC hs-CRP + TC: HDLC 0 1. 0 2. 0 4. 0 6. 0 Relative Risk of Future Cardiovascular Events Ridker et al, N Engl J Med. 2000; 342: 836 -43
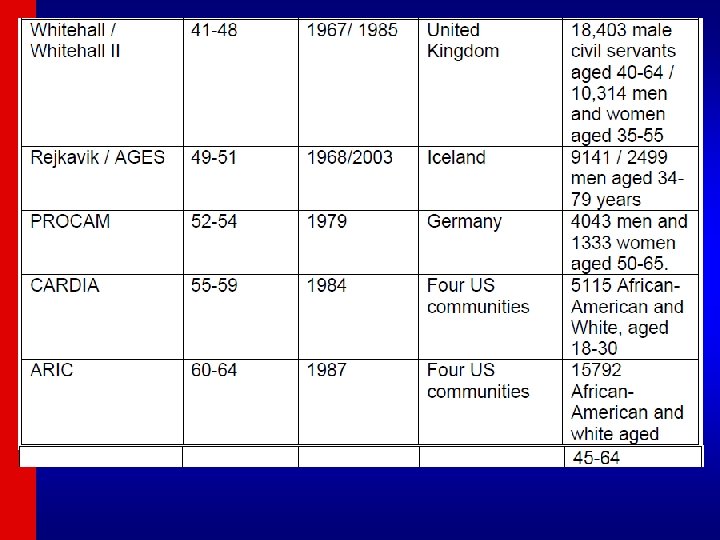
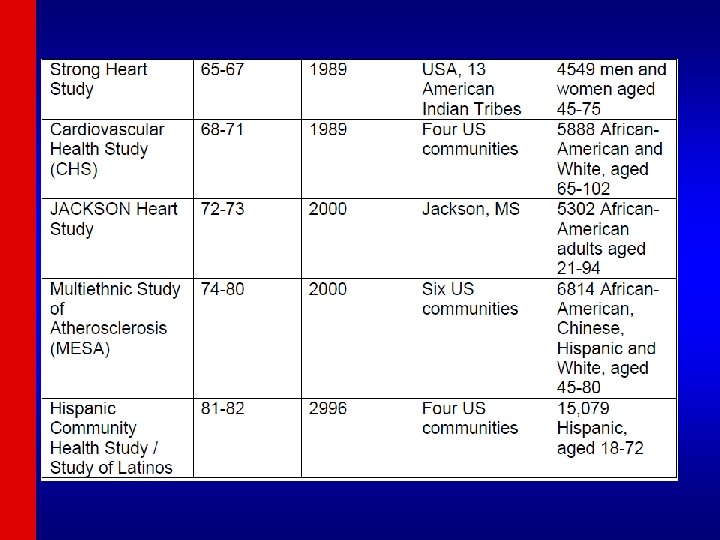
Cardiovascular Health Study • 5, 201 Medicare eligible individuals aged 65 -102 at baseline enrolled beginning 1992 at six field centers. • Assessment of newer and older risk factors. • Ongoing follow-up of cardiovascular events and mortality • Subclinical disease measures included: – carotid B-mode ultrasound for carotid IMT at Year 2, Year 7, and Year 11 – m-mode echocardiographic measures of left ventricular mass and dimensions, left atrial dimension done at baseline (Year 2) (at UC Irvine) and follow-up (Year 7) examinations. – Ankle brachial index (ABI) for measurement of PAD – Pulmonary function (FVC and FEV 1)
Cardiovascular Health Study: Combined intimal-medial thickness predicts total MI and stroke Cardiovascular Health Study (CHS) (aged 65+): MI or stroke rate 25% over 7 years in those at highest quintile of combined IMT (O’Leary et al. 1999)
Multiethnic Study of Atherosclerosis • 6, 814 adults aged 45 -80 enrolled at 6 field centers, including Caucasians, African. Americans, Hispanics, and Chinese beginning 2000. • Extensive assessment of standard and novel risk factors, unique blood cohort among 1000 subjects. • Multiple evaluations of carotid IMT, ABI, and coronary calcium. Ancillary studies of LV size and extracoronary measures of calcification (Harbor-UCLA) and abdominal aortic calcium (UC San Diego) in full or partial cohorts.
MESA Study Design Features Four examinations approximately two years apart, exam 5 just completed Major risk factors measured at each exam Coronary calcium measured in entire cohort at Exam 1, ½ cohort at Exam 2, ½ cohort at Exam 3, and in about 1000 pts in Exam 4. Carotid IMT measured at Exam 1 and 2 -3. Cardiac MRI measured at Exam 1 and 2 -3 Ankle Brachial Index Pulse wave analysis Endothelial function measures Follow-up for CVD events and incident DM, mortality
Cumulative Incidence of Any Coronary Event by Coronary Calcium Score: MESA Study (Detrano et al. , NEJM 2008)
Intermediate Risk MESA Subjects (n=1330) C-statistics: FRS alone 0. 623 FRS+CAC 0. 784 (p<0. 001) FRS+CIMT 0. 652 (p=0. 01) FRS+FMD 0. 639 (p=0. 06) FRS+CRP 0. 640 (p=0. 03) FRS+Fam. Hx 0. 675 (p=0. 001) FRS+ABI 0. 650 (p=0. 01) Yeboah J et al, JAMA 2012
Coronary Artery Risk Development in Young Adults (CARDIA) – 5, 115 adults (half African-American) aged 18 -30 at baseline in 1985 enrolled at 4 field centers. – Ongoing evaluation (Year 20 exam recently completed). – Echocardiographic M-mode and 2 D measures available at Year 5 and Year 10 exams (UC Irvine Echo Reading Center) – CT Coronary Calcium at Years 15 (Harbor. UCLA) and 20 (Wake Forest University)
NHANES Cross-Sectional and Mortality Follow-up Studies • NHES 1960, NHANES II 1976, NHANES III 1988 -1994, and NHANES IV 2000 -2012 crosssectional health survey and clinic exam data • NHES, NHANES 2, 3 Mortality Follow -up
Risk for CHD Increases with the Number of Risk Factors: NHANES/NHEFS ------ 40 Events/100 Patients* 35 30 25 20 15 10 5 0 35. 0 N = 12, 932 Risk Factors (RFs) • SBP >140 mm Hg or DBP >80 mm Hg 29. 7 • TC >240 mg/d. L 22. 3 • BMI >27. 3 kg/m 2 (women) >27. 8 kg/m 2 (men) 15. 3 • Current smoker • Diabetes 6. 3 0 1 2 3 4 -5 # of RFs (any combination) Yusuf HR, et al. Prev Med. 1998; 27: 1 - *Cumulative 21 yr. incidence *1971 -1992. 9.
Distribution of HTN Subtypes in the untreated Hypertensive Population in NHANES III by Age ISH (SBP 140 mm Hg and DBP <90 mm Hg) SDH (SBP 140 mm Hg and DBP 90 mm Hg) IDH (SBP <140 mm Hg and 16% DBP 90 mm Hg) 17% 16% 20% 100 20% 11% 70 -79 80+ 80 Frequency of hypertension 60 subtypes in all untreated 40 hypertensives (%) 20 0 <40 40 -49 50 -59 60 -69 Age (y) Numbers at top of bars represent the overall percentage distribution of untreated hypertension by age. Franklin et al. Hypertension 2001; 37: 869 -874.
Does DM Carry a CVD or Mortality Risk Equivalent? US Men and Women Ages 30 -74 (age, gender, and risk-factor adjusted Cox regression) NHANES II Follow. Up (n=6255) (Malik and Wong, et al. , Circulation 2004; 110: 1245 -1250) *** *** *** ** * p<. 05, ** p<. 01, **** p<. 0001 compared to none
Mylifecheck. heart. org
Age-standardized prevalence estimates for poor, intermediate and ideal cardiovascular health for each of the seven metrics of cardiovascular health in the AHA 2020 goals, among US adults >20 years of age, NHANES 2005 -2006 (baseline available data as of January 1, 2010). Fewer than 1% of US adults are at ideal levels for all 7 measures of cardiovascular health! © 2010 American Heart Association, Inc. All rights reserved. Roger VL et al. Published online in Circulation Dec. 15, 2010
Ideal Cardiovascular Health and CVD Incidence: ARIC Study (Folsom et al, JACC 2011)
Risk Factor Consortia • The Emerging Risk Factors Collaboration incorporating over 1. 3 million person years at risk demonstrate – the independent predictive value of C-reactive protein with CHD and stroke among 54 prospective studies (Lancet 2010) – the clinical utility of C-reactive protein and fibrinogen (NEJM 2012) – the limited role of adding the novel lipid markers apolipoprotein B, apolipoprotein A 1, lipoprotein (a) and lipoprotein-associated phospholipase A 2 to traditional lipid measures (JAMA 2012). • The group also showed in 97 prospective studies the strong relation of diabetes with deaths from vascular disease and other causes (NEJM 2011).
Multinational Registries of CAD Patients • Euroaspire I, III, IV (just completed 2013) – compares adherence to recommended lifestyle and therapies in secondary prevention across European countries. • Prospective Urban Rural Epidemiology (PURE) – 139, 506 subjects enrolled among 600 communities in 17 low, middle and high income countries.
Big Gap in use of Evidence Based Drugs for Secondary Prevention in China PURE study 55. 4% 52. 7% Percentage(%) 50 40 Antiplatelets Percentage(%) 60 32. 8% 30 15. 5% 20 11. 6% 14. 9% 10 3. 4% 50 45 40 35 30 25 20 15 10 5 0 46. 8% 40. 2% ACE-1/ARB 26. 2% 6. 4% 7. 8% 12. 8% Yusuf S et al. Lancet. 2011; 378(9798): 1231 -43 6. 8% Percentage(%) 0 50 45 40 35 30 25 20 15 10 5 0 45. 4% 60 56. 7% 44. 9% 37. 0% Beta-blockers 30 S. Asia China 11. 9% 0 Malaysia 12. 5% Africa 6. 8% 1. 9% Statins 37. 3% 19. 0% 20 10 S. America Middle East 50 40 N. Amerrica/Europe 15. 9% 4. 8% 2. 0% 1. 4%
Interaction Between Therapies to Treat Atherosclerosis 113
What are the Cost Savings from Prevention Strategies in the US? • Community-based programs to increase physical activity, improve nutrition, prevent smoking would provide a $5. 60 return on investment for every $1 spent within 5 years • Comprehensive worksite wellness and school based programs would reduce medical costs by $3. 27 and absenteeism costs by $2. 73 for every $1 spent • Building bike and pedestrian trials would save $3 in medical cost savings for every $1 spent Weintraub et al. Circulation 2011
What are the Cost Savings from Prevention Strategies in the US? • Reducing the population sodium intake to 1500 mg/day would save $26. 2 billion in healthcare savings annually • A 40% cigarette price increase from taxes would reduce smoking to 15. 2% by 2025 with large gains in quality adjusted life years (QALYs) (13 milllion) saving $682 billion • Eliminating exposure to second hand smoke would save $10 billion annually in healthcare costs • Comprehensive coverage on smoking cessation programs results in a $3 return per $1 spent • Adherence to ATP III lipid primary prevention guidelines would cost of $42, 000 and BP therapy $37, 100 per life year saved