CARDIAC CYCLE DR KIRTI P SARKATE CARDIAC CYCLE


 § 1/3 of stroke volume ejected §")
 1. Protodiastole (0. 04 sec ) ( SV valves")


 Tracing")
")


- Slides: 24
CARDIAC CYCLE DR. KIRTI P. SARKATE
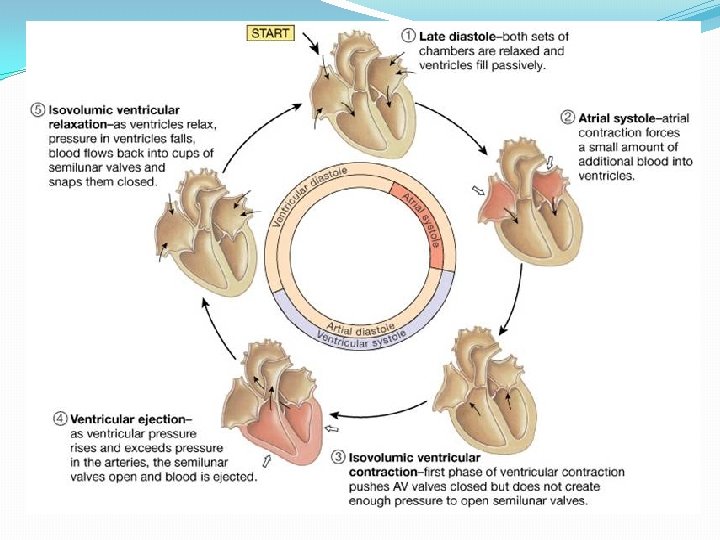
CARDIAC CYCLE �The cardiac events that occur from the beginning of one heart beat to the beginning of the next. �Events : Electrical Mechanical �Electrical and mechanical events occur in a co-ordinated manner to generate effective contractions �Duration – 0. 8 s
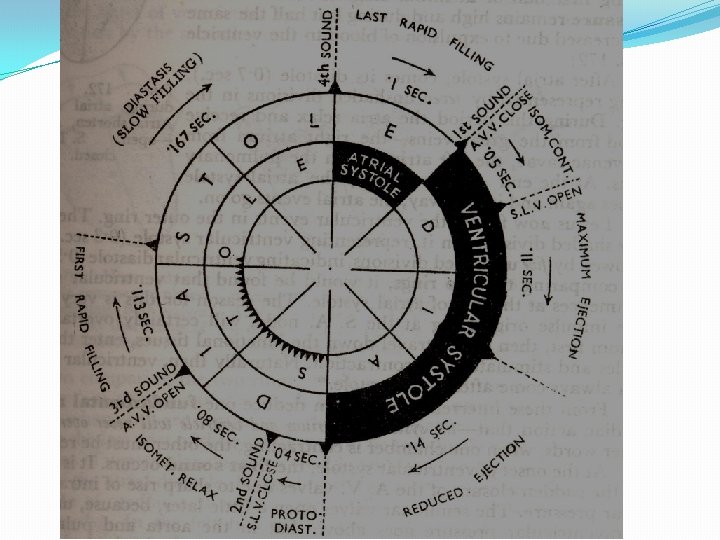
ATRIAL CYCLE �Both artia contract and relax. 1. Atrial systole – 0. 1 sec increase right atrial pressure- a wave 2. Atrial diastole – 0. 7 sec AV valves open
VENTRICULAR CYCLE �Both ventricles contract and relax. 1. Ventricular systole ( 0. 3 sec ) a) Isovolumic contraction phase( 0. 05 sec) § AV valves closed § Increased ventricular pressure § Bulging of AV valves into atria increases atrial pressure – c wave. b) Phase of ventricular ejection ( sv valve open ) Ø Rapid ejection phase ( 0. 1 sec ) § 2/3 of stroke volume ejected § Pressure in left ventricle – 120 mm. Hg / right ventricle – 25 mm of Hg.
Ø Slow ejection phase (0. 15 sec) § 1/3 of stroke volume ejected § Intraventricular pressure decreases
VENTRICULAR DIASTOLE (0. 5 sec) 1. Protodiastole (0. 04 sec ) ( SV valves closed ) 2. Isovolumic relaxation phase (0. 06 sec) § Decrease ventricular pressure( falls from 80 mm. Hg – 2 to 3 mm. Hg ) § AV vaslves open § Peak of V wave. 3. Rapid filling phase (0. 11 sec) 3 rd heart sound. 4. Reduced filling (0. 19 sec) diastasis. 5. Last rapid filling phase( additional 25% of blood pushed into ventricle) coincides with atrial systole.
ATRIAL SYSTOLE Atrial Depolarization Atrial contraction Atrial pressures rise Blood flows across AV valves � Ventricular filling : 80% - direct flow from SVC 20% - atrial contraction. ATRIA = PRIMER PUMPS.
ISOVOLUMETRIC CONTRACTION Increase in ventricular pressure > atrial pressure → AV valves close After 0. 02 s, semilunar valves open Period between AV valve closure and semilunar valve opening → contraction occurs without emptying Tension develops without change in muscle length
EJECTION • When LV pres > 80 mm Hg RV pres > 8 mm Hg, The semilunar valves open. • Rapid Ejection – 70% emptying in first 1/3 • Slow Ejection – 30% in last 2/3 • The pressure in the ventricle keeps decreasing until it becomes lower than that of the great vessels
ISOVOULUMETRIC RELAXATION • When ventricle pressure < arterial pressure→ backflow of blood → forces semilunar valves to close. • For 0. 03 -0. 06 s, ventricle relaxes despite no change in its volume • Meanwhile, atria fill up and atrial pressure gradually rises • Pressures in ventricle keep falling till it is < atrial pressure
VENTRICULAR FILLING • Begins with the opening of AV valves • Rapid filling – first 1/3 of diastole • Reduced filling (Diastasis) – middle 1/3 of diastole • Atrial contraction – last 1/3 of diastole • As the atrial pressures fall, the AV valves close and left ventricular volume is now maximum → EDV (120 ml in LV)
CARDIAC CYCLE �The cardiac events that occur from the beginning of one heart beat to the beginning of the next. �Events : Electrical Mechanical �Electrical and mechanical events occur in a co-ordinated manner to generate effective contractions �Duration – 0. 8 s
D E F C G A B H
D C E F G A B H Pressure changes in ventricles: 1. During atrial systole Before beginning of A. S- IV pr. Zero After beginning of A. S- 6 -7 mm. Hg(rt. v) 7 -8 mm. Hg(lt. v) segment A-B – pr. Changes during atrial systole point A – onset of atrial systole point B – closure of AV valves 2. During ventricular systole: • Phase of isometric contraction segment BC – isometric contraction phase point C – opening of SV • Phase of rapid ejection contraction of vent greater than rate of ejection pressure in lt. vent is 128 mm. Hg & rt. vent 25 mm. Hg
D C E F G A B H In the intraventricular pr. curve Segment CD – rapid ejection phase Point D - peak of IV pressure 3. Slow ejection phase segment DE – decrease vent contraction pr. Declines ØDuring ventricular diastole: 1. During protodiastole : decrease IVP than pr. In aorta and pulmo segment EF – decrease IVP point F – semilunar valves closed 2. During isovolumic relaxation phase : decrease IVP than pr. in atria ( 80 mm. Hg – 2 to 3 mm. Hg) Segment FG – isovolumic relaxation phase point G – opening of AV valves
D C E F G A B H 3. During rapid filling phase: segment GH – rapid filling phase decrease IVP pressure. 4. During reduced filling phase: ventricular pressure – little above zero ceasation of ventricular filling.
x y z PRESSURE CHANGES IN ATRIA : (Studied by cardiac catherisation ) Tracing of JVP curve similar to intraatrial pressure curve : +ve ( a, c, v) , -ve (x, y, z) 1. During atrial systole: rt. At. Pr – 4 – 6 mm. Hg , lt. at – 7 -8 mm. Hg increase rt. at. pr – a wave(+ve) after atrial systole decrease atrial pressure - atrial diastole – x wave (-ve). 2. During ventricular systole: • Isometric contraction phase : increase intraventricular pressure , AV valve bulge – c wave(+ve). • During ventricular ejection phase – papillary muscles contract , pull AV fibrous ring decrease intraatrial pressure – y wave (-ve)
x ØDuring ventricular diastole 1. Isometric relaxation phase increase atrial pressure – v wave(+ve) 2. During rapid filling phase decrease atrial pressure – z wave(-ve) y z
ØPressure changes in aorta varies between – 80 -120 mm. Hg 1. During atrial systole : pr in aorta – 80 mm. Hg 2. During ventricle systole: increase pressur in ventricles (isometric contraction) SV – open , increase in aortic pressure – 120 mm. Hg 3. During ventricular diastole : protodiastole – back flow of blood - increase aortic pressure- Incisura - diacrotic notch rest of diastole – decrease aortic pressure Ø Pressure changes in pulmonary artery pr. curve same as aorta pul. artery systolic pr. – 15 -18 mm Hg diastolic pressure – 8 -10 mm. Hg
ØVolume changes in ventricles • During atrial systole in the ventricular volume curve segment AB – atrial systole end of atrial systole – end of ventricular diastole EDV = 130 ml • during ventricular systole: 1. Isovolumetric contraction phase – no change 2. Ventricular ejection phase – segment CD – 80 ml(SV) ESV – 50 ml • During rapid/slow filling phase vent volume increases – 105 ml. Ø Valvular events ( heart sounds) ( phonocardiogram is graphical record) 1 st heart sound – cause 2 nd , 3 rd, 4 th heart sound
THANK U